
Abstract
Background:
Pompe disease is a rare neuromuscular disorder caused by acid alpha-glucosidase deficiency, leading to glycogen accumulation and progressive striated muscle weakness. The 6-minute walk test (6MWT) is commonly used to assess functional capacity in neuromuscular diseases but can be challenging for severely affected ambulant patients.
Objective:
This study aimed to develop and validate predictive models for 6MWT performance using simpler, less demanding tests.
Methods:
This retrospective monocentric study included 74 patients with Pompe disease (712 visits) and a mean follow-up of 6.6 ± 3.8 years. Functional assessments included the 6MWT, 10-meter walk test (10mWT) which was specifically used to determine gait speed, timed tests, strength and respiratory measures, and the Motor Function Measure (MFM-32). Linear regression models were developed to predict 6MWT speed, with validation using an 80%-20% training-testing split.
Results:
The cohort had an equal male-to-female ratio, with a mean age of 54.4 ± 13.5 years. The 10mWT speed showed a strong correlation with 6MWT speed (R = 0.91, p < 0.0001), confirming its potential as a surrogate measure. The most practical predictive model included 10mWT speed, age, sex, height, and weight, achieving an adjusted R2 of 0.86. This model balances simplicity and accuracy, relying on easily measurable parameters suitable for routine clinical use. More complex models, including variables such as the MFM-32 or supine-to-sit time, offered only marginal improvements in accuracy.
Conclusion:
The 10mWT offers a robust and less exhausting alternative to the 6MWT for assessing walking capacity in Pompe disease, particularly for ambulant patients with severe mobility limitations. Its strong correlation with the 6MWT and ease of implementation support its integration into clinical practice and trials.
Keywords
Introduction
Pompe disease, or glycogen storage disease type II, is a rare neuromuscular disorder caused by a deficiency in the lysosomal enzyme acid alpha-glucosidase (GAA), leading to glycogen accumulation in skeletal and cardiac muscles. 1 Clinically, it ranges from a severe infantile form with hypertrophic cardiomyopathy and profound muscle weakness to a later-onset form characterized by progressive limb and respiratory muscle weakness. Without treatment, Pompe disease leads to significant morbidity and mortality.1,2 While enzyme replacement therapy (ERT) with recombinant GAA (alglucosidase alfa) available since 2006, can improve survival and slow disease progression,3,4 its long-term benefits are limited and variable.5,6
Monitoring motor function is essential for managing Pompe disease and evaluating treatment outcomes. The 6-Minute Walk Test (6MWT) is a widely used measure of functional capacity, assessing endurance and cardiorespiratory fitness. 7
This test has been extensively used in various neuromuscular and cardiopulmonary diseases, including Pompe disease, to monitor disease progression and evaluate treatment efficacy.5,8,9 However, the 6MWT may not fully reflect a patient's maximum exercise capacity, as some patients often lack motivation and may be anxious about exercising for such a long period. 10
Given the limitations of the 6MWT, particularly in weaker patients, alternative shorter-duration tests, such as the 2-Minute Walk Test (2MWT), have been proposed as potential surrogates. Studies have demonstrated a high correlation between the distance covered in the 2MWT and the 6MWT (R ≥ 0.90), suggesting that the 2MWT could be a viable alternative for patients with significant mobility impairments.11,12 Moreover, recent research in neuromuscular diseases supports the utility of the 2MWT as an effective and less burdensome alternative both in pediatric 12 and adult populations. 11 However, these gait tests are still difficult for some patients with severe walking impairments, and respiratory insufficiency which is not correlated to the severity of lower limb weakness, is an important confounding factor and source of bias in patients with Pompe disease. It would therefore be worth investigating whether other common and less strenuous assessments could be used as a surrogate of the 6MWT.
Estimating 6MWT enables comparisons with previous studies for meta-analyses, facilitates the assessment of all Pompe patients regardless of disease severity, and ensures consistent longitudinal follow-up by tracking the same variable over time despite progressive muscle deterioration. This approach enhances clinical decision-making by providing a standardized measure that can be applied across different levels of functional impairment. Building on these considerations, this retrospective study aims to analyze data from Pompe disease patients followed at the Institute of Myology in Paris, France, to identify the best predictors of 6MWT performance and propose a model for estimating 6MWT outcomes using shorter-duration tests.
Methods
Seventy-four individuals with Pompe disease treated with alglucosidase alfa (Myozyme®) were followed at the Institute of Myology (Paris, France) between February 2005 and February 2020. Reviewing all the visits, 712 visits included at least a 6MWT. The assessments could also include a 10-meter walk test (10mWT), timed tests, strength assessments, and pulmonary function tests (PFT). Demographic and anthropometric data (age, gender, height, weight) and some clinical parameters were also recorded.
Timed tests
6MWT. The 6MWT measures the distance walked in 6 minutes. Patients were instructed to walk as far as possible, without running, along a 20-meter long path marked with a tape measure scaled at each meter, with the ends of the path identified by a cone. 7 The total distance covered was recorded and subsequently converted into mean walking speed (meters per second) for analysis.
10mWT. The 10mWT was performed in a corridor graduated on the ground, over a distance of 12 meters. The subject stood with shoes on and feet behind the starting line. The subject was instructed to walk as fast as possible without running to the finish line located 12 meters ahead, in order to avoid a deceleration effect. The stopwatch was stopped as soon as the tip of the front foot crossed the 10-meter line. The time recorded was subsequently converted into walking speed (meters per second) for analysis.
Supine-to-sit. This test assesses the time taken to switch from a lying to a sitting position. The participant begins in a supine position on a plinth with arms positioned alongside the body. Upon the examiner's verbal cue, the participant is instructed to transition to a seated position as swiftly as possible. Timing begins at the initiation of the cue and stops once the participant achieves an upright sitting position, with legs off the table, feet on the ground, and hands resting on the thighs. The total time (measured in seconds) is recorded, along with any observed reliance on external support (e.g., using hands on the table or thighs to assist the movement).
Chair stand time. This test assesses the time taken to move from a sitting to a standing position. The participant begins seated on a chair, wearing shoes, with hands resting on their thighs and both feet flat on the floor. Upon the examiner's verbal cue, the participant is instructed to stand up as quickly as possible. Timing starts when the cue is given and stops once the participant achieves a stable upright posture, with arms relaxed at the sides. The total time (in seconds) is recorded, along with any observed reliance on external support (e.g., pushing off with hands or using the chair for assistance).
Four steps climbing time. This test evaluates the time taken to climb 4 steps of standard height. The participant begins standing in front of the stairs, wearing shoes, with arms relaxed alongside the body. Upon the examiner's verbal cue, the participant is instructed to ascend four steps as quickly and safely as possible. Timing starts when the cue is given and stops when the participant reaches the top of the stairs with both feet firmly on the upper landing, arms relaxed at their sides, and no longer using the railings for support. The total time (in seconds) is recorded, along with observations regarding the use of support, such as one or both railings, self-support (e.g., pushing on thighs), or the absence of assistance.
1-min sit-to-stand test. This test measures the number of sit-to-stand performed in one minute. The participant begins seated on a chair, wearing shoes, with hands resting on their thighs and both feet flat on the floor. 13 Upon the examiner's verbal cue, the participant is instructed to stand up and sit down as many times as possible within one minute. Timing starts when the cue is given, and the total number of complete sit-to-stand repetitions performed within 60 s is recorded. Additionally, observations are made regarding any reliance on external support (e.g., using armrests, a table, or hands on thighs for assistance).
Strength assessments. Isometric strength of the elbow and knee flexors/extensors was assessed using a Quantitative Muscle Assessment (QMA) system and/or a Biodex® dynamometer. Strength measurements for elbow flexors (EF) and extensors (EE) were performed maintaining the elbow at a 90° flexion angle with the participant lying on a plinth for the QMA and seated for the Biodex. Knee flexors (KF) and extensors (KE) strength were evaluated seated with the knee positioned at 90° flexion for both QMA and/or Biodex recordings. Muscle strength was tested bilaterally, and the highest value obtained over 3 to 5 trials for each muscle group was recorded. The average of the maximum values from both sides was then calculated for each muscle group. The testing sequence was standardized, with elbow flexors and extensors assessed first, followed by knee flexors and extensors. All results were expressed in Newton meters (Nm).
Grip strength was assessed using a Jamar dynamometer and expressed in kilograms (kg) and recorded by QMA system, sitting with a backrest, feet on the ground, elbow bent at 90° along the trunk.
MFM. The Motor Function Measure (MFM) is a functional scale designed to evaluate motor function in individuals with neuromuscular disorders. It assesses three functional domains: standing and transfers (D1), axial and proximal motor function (D2), and distal motor function (D3). It includes 32 items that are scored based on the ability to perform specific tasks, providing a detailed profile of a patient's motor capabilities and limitations. Each item is scored on a scale from 0 to 3, where 0 indicates that the task cannot be performed and 3 indicates that the task is performed with no difficulty and no compensation. The total score ranges from 0 to 100%, with higher scores indicating better motor function. 14
Respiratory functional assessments. Sitting Forced vital capacity (FVC) was recorded by spirometry, while maximum inspiratory pressure (MIP) and maximum expiratory pressure (MEP) were measured using a microRPM® device.
Data analysis
All statistical analyzes were performed with R version 4.4.0. All visits were assessed as independent measures. The visits of the patients who were not able to perform the 6MWT were discarded. Descriptive statistics were calculated for all variables as mean and standard deviation.
Statistical significance was set at p < 0.05 for all tests. Correlations were classified as weak (0.10–0.39), moderate (0.40–0.69), strong (0.70–0.89) and very strong from (0.90–1.00). 15 Pearson's correlation analysis was used to construct a correlation matrix and assess associations between the clinical variables and the 6MWT speed with statistical significance tested at the 0.001 (***), 0.01(**), and 0.05 (*) levels. To identify clusters of related variables, hierarchical clustering was applied to the correlation matrix using Euclidean distance and Ward's linkage method.
Variables demonstrating a strong or very strong correlation with 6MWT speed were selected for regression analysis, using a subset comprising 80% of the data (training phase) to propose a predictive equation to calculate the theoretical 6MWT speed. Validation was performed on the remaining 20% of the data (testing phase). This approach enabled parameter estimation on the training set and error assessment on the testing set, minimizing the risk of overfitting.
A simpler linear regression model was constructed with 6MWT speed as the response variable and 10mWT speed only as the predictor variable. Additionally, more complex models incorporating multiple predictors were tested. To evaluate model performance, a 1000-fold cross-validation approach was applied, with repeated random splitting into 80% training and 20% testing subsets. Model quality was assessed using the coefficient of determination (R2), mean squared error (MSE), mean absolute error (MAE), root mean squared error (RMSE), and the percentage error (%), calculated from the ratio of the MAE to the mean. Additionally, the estimated regression parameters were recorded for further analysis.
Results
Cohort analysis
The study included 74 patients with Pompe disease, representing 712 clinical visits. The cohort had an equal male-to-female ratio, with a mean age of 54.4 ± 13.5 years and a mean follow-up duration of 6.6 ± 3.8 years, with an average of 9.0 ± 6.3 visits per patient. For eight visits, data were available for the 10mWT but not for the 6-min walk test (6MWT), as patients felt unable to undertake the 6-min test due to their condition. Additionally, 21 patients covered less than 50 meters during the 6MWT, highlighting the severe mobility limitations for some patients in this cohort. Descriptive statistics for all recorded variables were calculated and summarized in Table 1. All the evaluated measures were normally distributed.
Descriptive statistics.
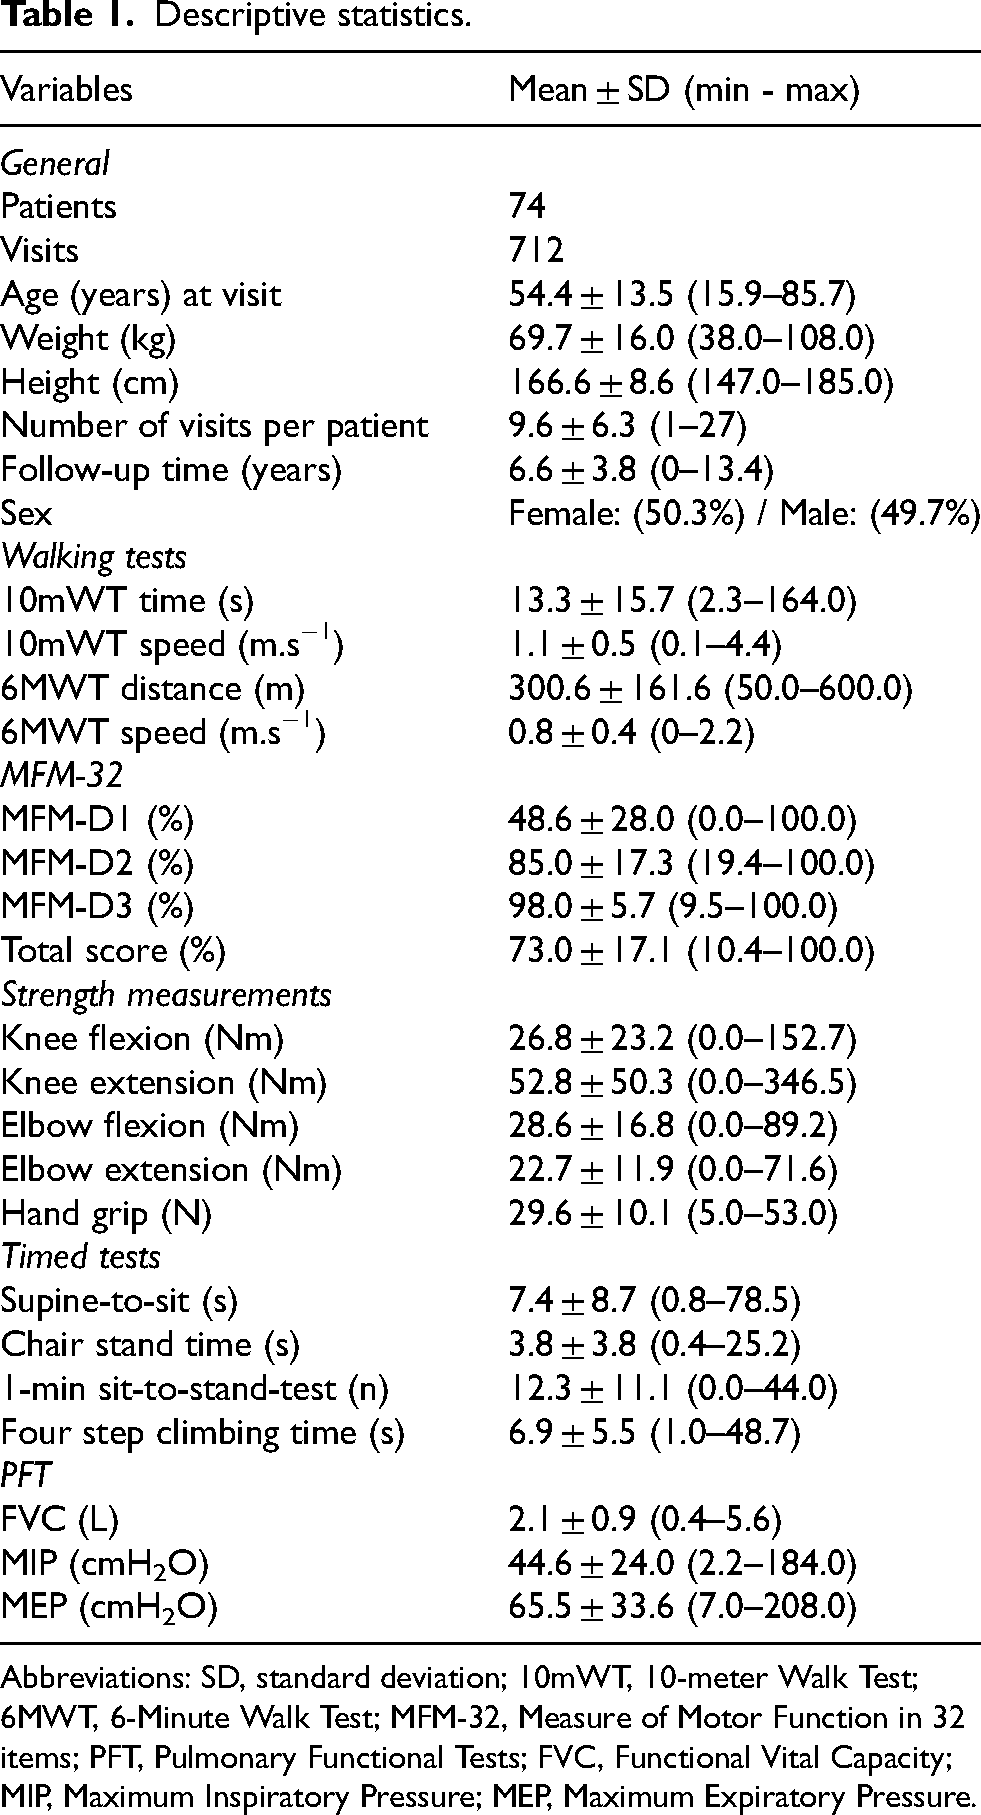
Abbreviations: SD, standard deviation; 10mWT, 10-meter Walk Test; 6MWT, 6-Minute Walk Test; MFM-32, Measure of Motor Function in 32 items; PFT, Pulmonary Functional Tests; FVC, Functional Vital Capacity; MIP, Maximum Inspiratory Pressure; MEP, Maximum Expiratory Pressure.
Correlation matrix
Pearson correlation coefficients were calculated to investigate associations between various clinical parameters and 6MWT speed (Figure 1). The dataset comprised a comprehensive range of variables, including measures of muscular strength, respiratory function, and mobility. Data preprocessing was performed to address missing values and ensure analytical rigor.
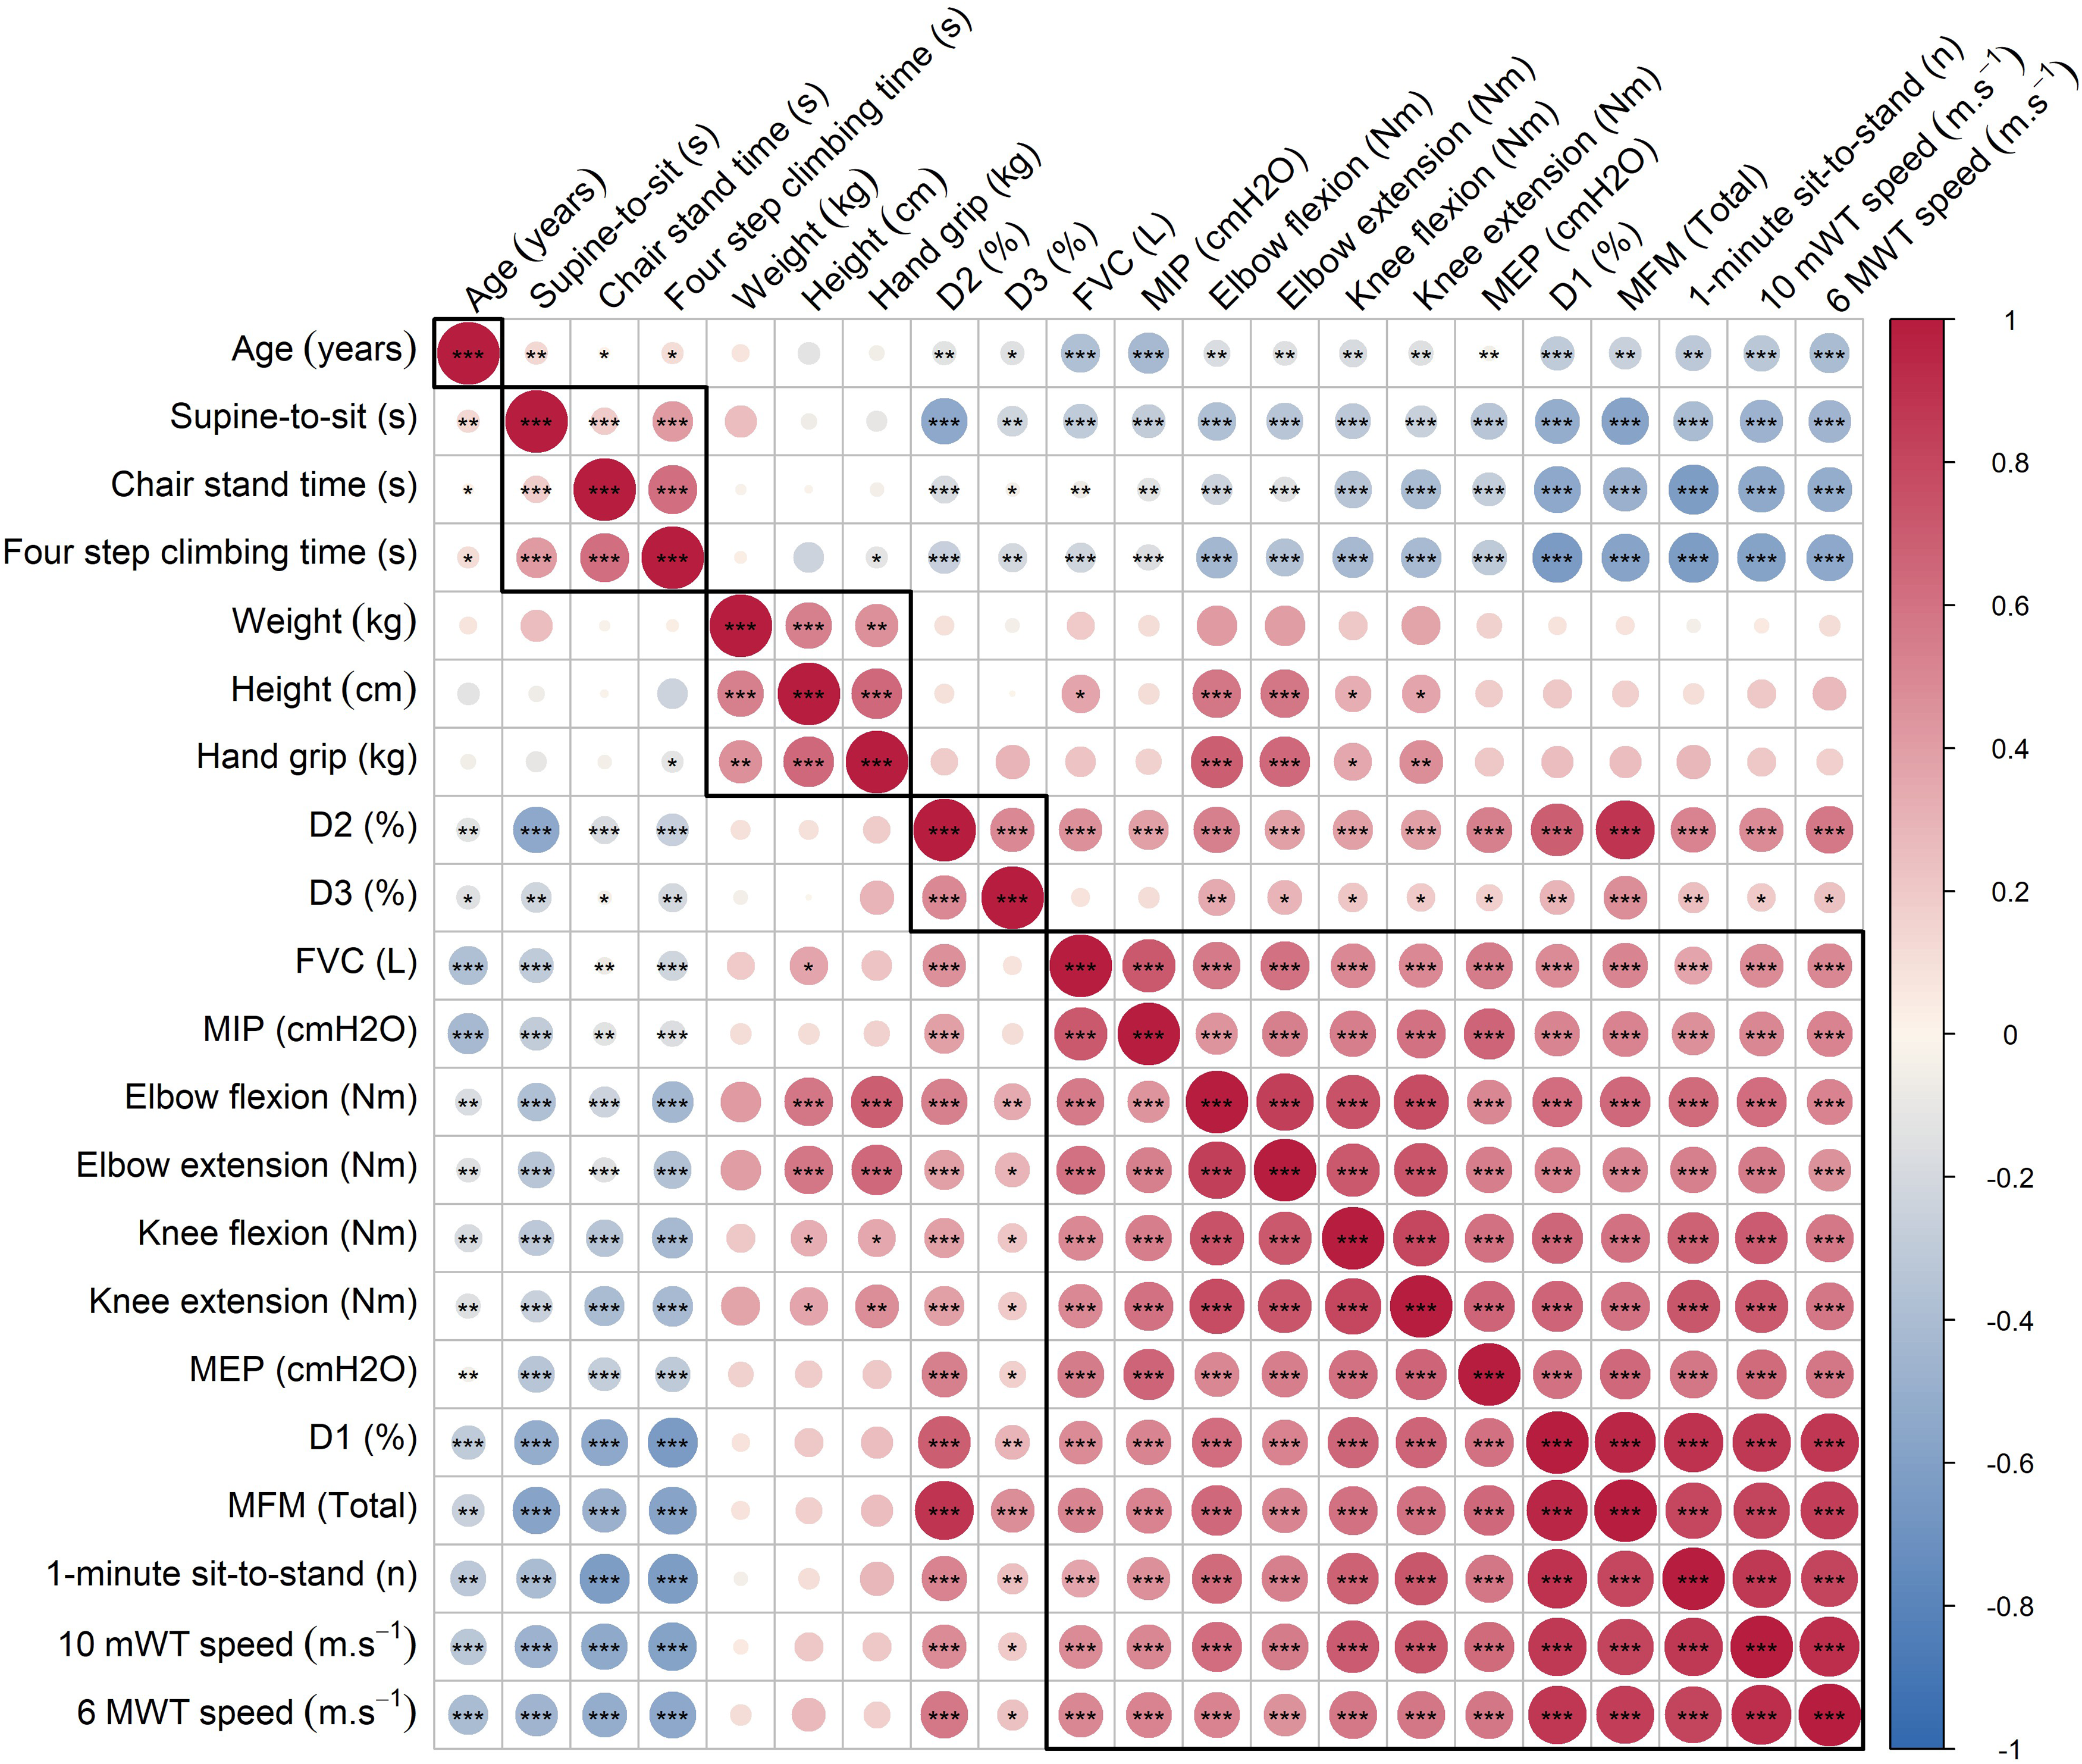
Correlation matrix analysis of clinical parameters in patients with mobility impairments using Pearson correlation coefficients, with statistical significance tested at the 0.001 (***), 0.01 (**) and 0.05 (*) levels. The visualization of the correlation matrix incorporates hierarchical clustering, facilitating the identification of variable clusters with similar associations. Cool colors (eg. blue) denote stronger negative correlations, while warm colors (eg. red) represent stronger positive correlations.
The results reveal a complex interplay between the clinical parameters assessed in patients with mobility impairments. Significant correlations are noted between muscular strength measurements (e.g., knee extension, elbow extension) and functional mobility tests (e.g., 10mWT speed, supine-to-sit). These findings highlight the multifaceted nature of mobility impairments and underscore the importance of comprehensive assessment approaches.
Development and validation of predictive models for 6MWT speed
The variables used in the model were first selected on the basis of the number of valid data available, clinical relevance, and also correlation and significance levels (
Correlation coefficients between variables and the 6MWT speed.
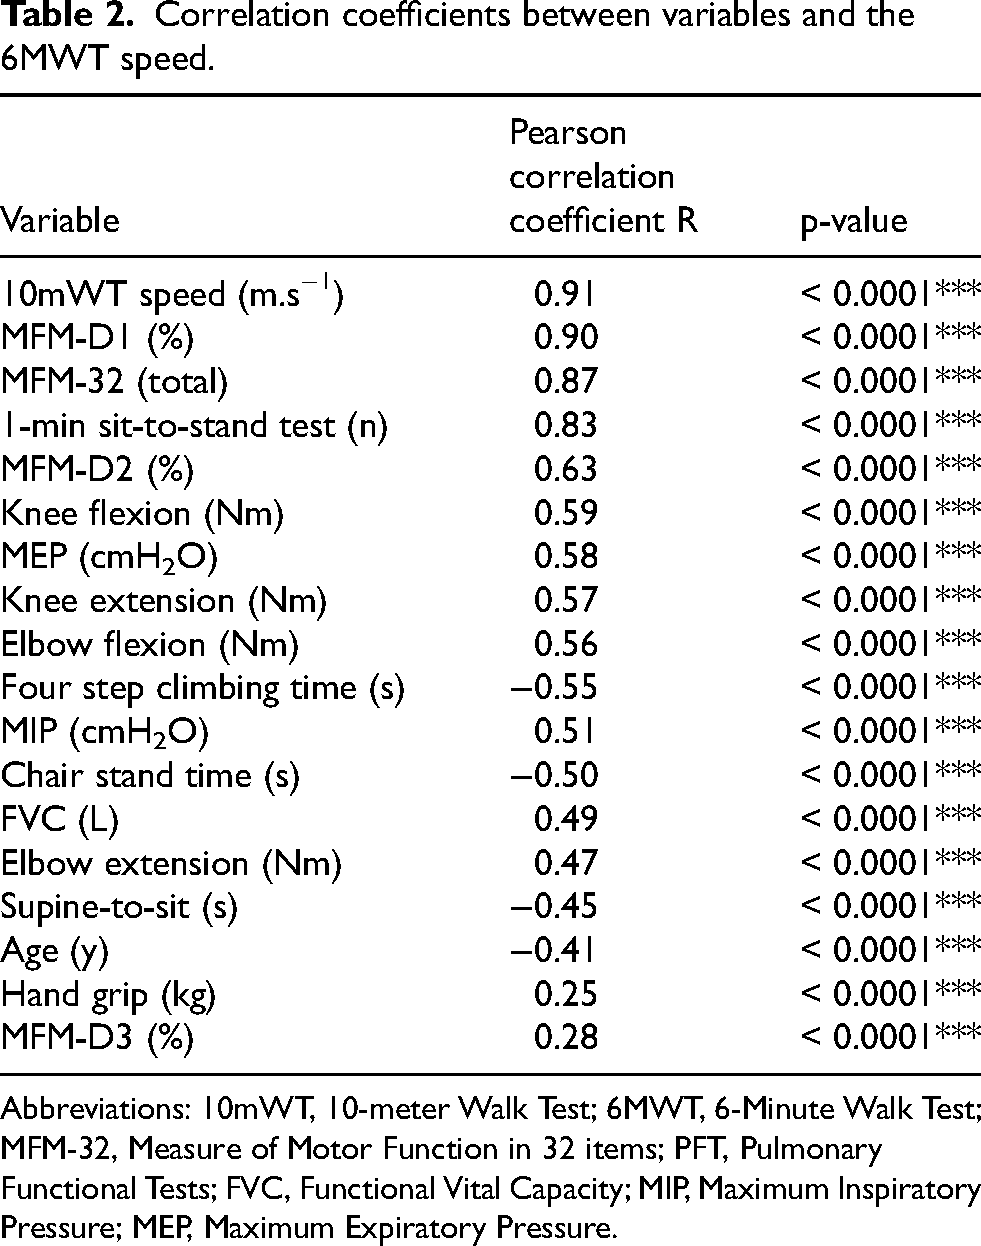
Abbreviations: 10mWT, 10-meter Walk Test; 6MWT, 6-Minute Walk Test; MFM-32, Measure of Motor Function in 32 items; PFT, Pulmonary Functional Tests; FVC, Functional Vital Capacity; MIP, Maximum Inspiratory Pressure; MEP, Maximum Expiratory Pressure.
A linear regression model was fitted to predict the 6MWT speed from the selected variables. Individual patient effects were assessed using analysis of variance (ANOVA). A stepwise variable selection procedure was used to identify the most significant variables for inclusion in the final models: 10mWT speed, age, sex, weight, height, MFM-32, maximal knee extension strength, and 1-min sit-to-stand test.
The model was trained and evaluated using 1000 iterations of random sampling (bootstrapping). For each iteration, dataset was split into training (80%) and testing (20%) subsets; a linear regression model was fitted on the training set to predict 6MWT speed using all selected variables; predictions were made on both the training and testing sets using the fitted model, empirical prediction error was calculated as the absolute difference between the true and predicted values on the test set.
Linear models
Three models, with 1, 5 or 8 parameters, have been retained for the analysis. The model's goodness of fit was evaluated using the coefficient of determination (R2), MSE, MAE, and RMSE.
The single parameter model included only the 10mWT speed which was the variable most correlated with the 6MWT speed (R = 0.91), yielding an R2 of 0.83. The distance covered during the 6MWT (6MWD) can be estimated using a predictive equation:
In addition to the 10mWT, the five-parameter model incorporated anthropometric variables, including age, sex, height and weight, to enhance predictive accuracy (R2adjusted = 0.86).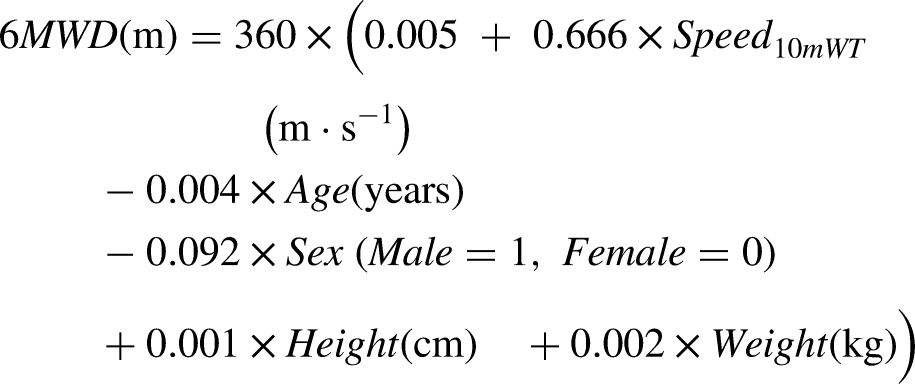
The eight-parameter model, which included 10mWT speed, age, sex, weight, height, MFM-32 score, maximal knee extension strength (mean), and 1-min sit-to-stand test result, was constructed to assess its potential for improving predictive accuracy. However, the determination coefficient was poorly improved compared to the five-parameter model (R2adjusted = 0.89).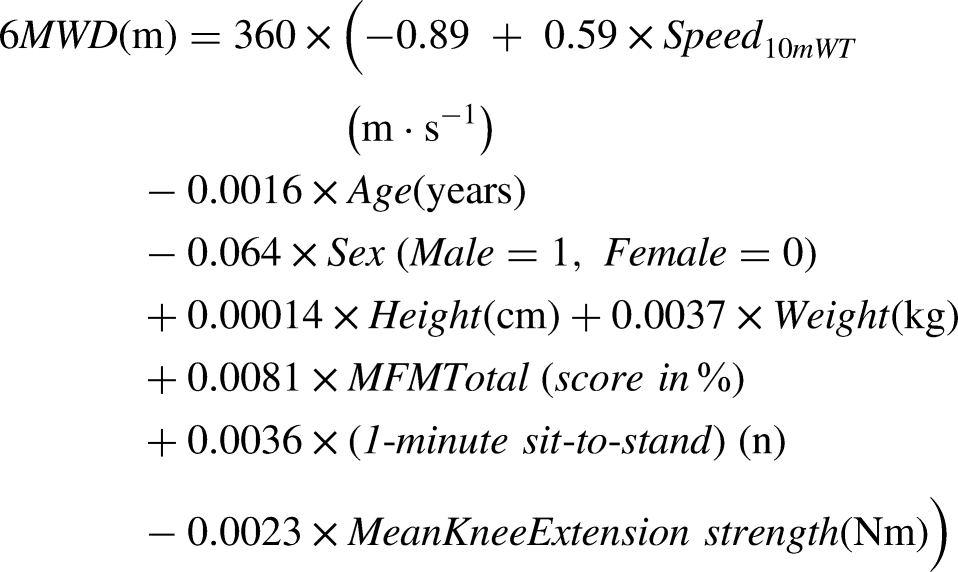
Analysis of the single parameter (10mWT speed) model
The graph (Figure 2) visually demonstrates a strong positive linear relationship between 6MWT speed and 10mWT speed, as evidenced by the upward trend of the data points and the steep slope of the regression line.
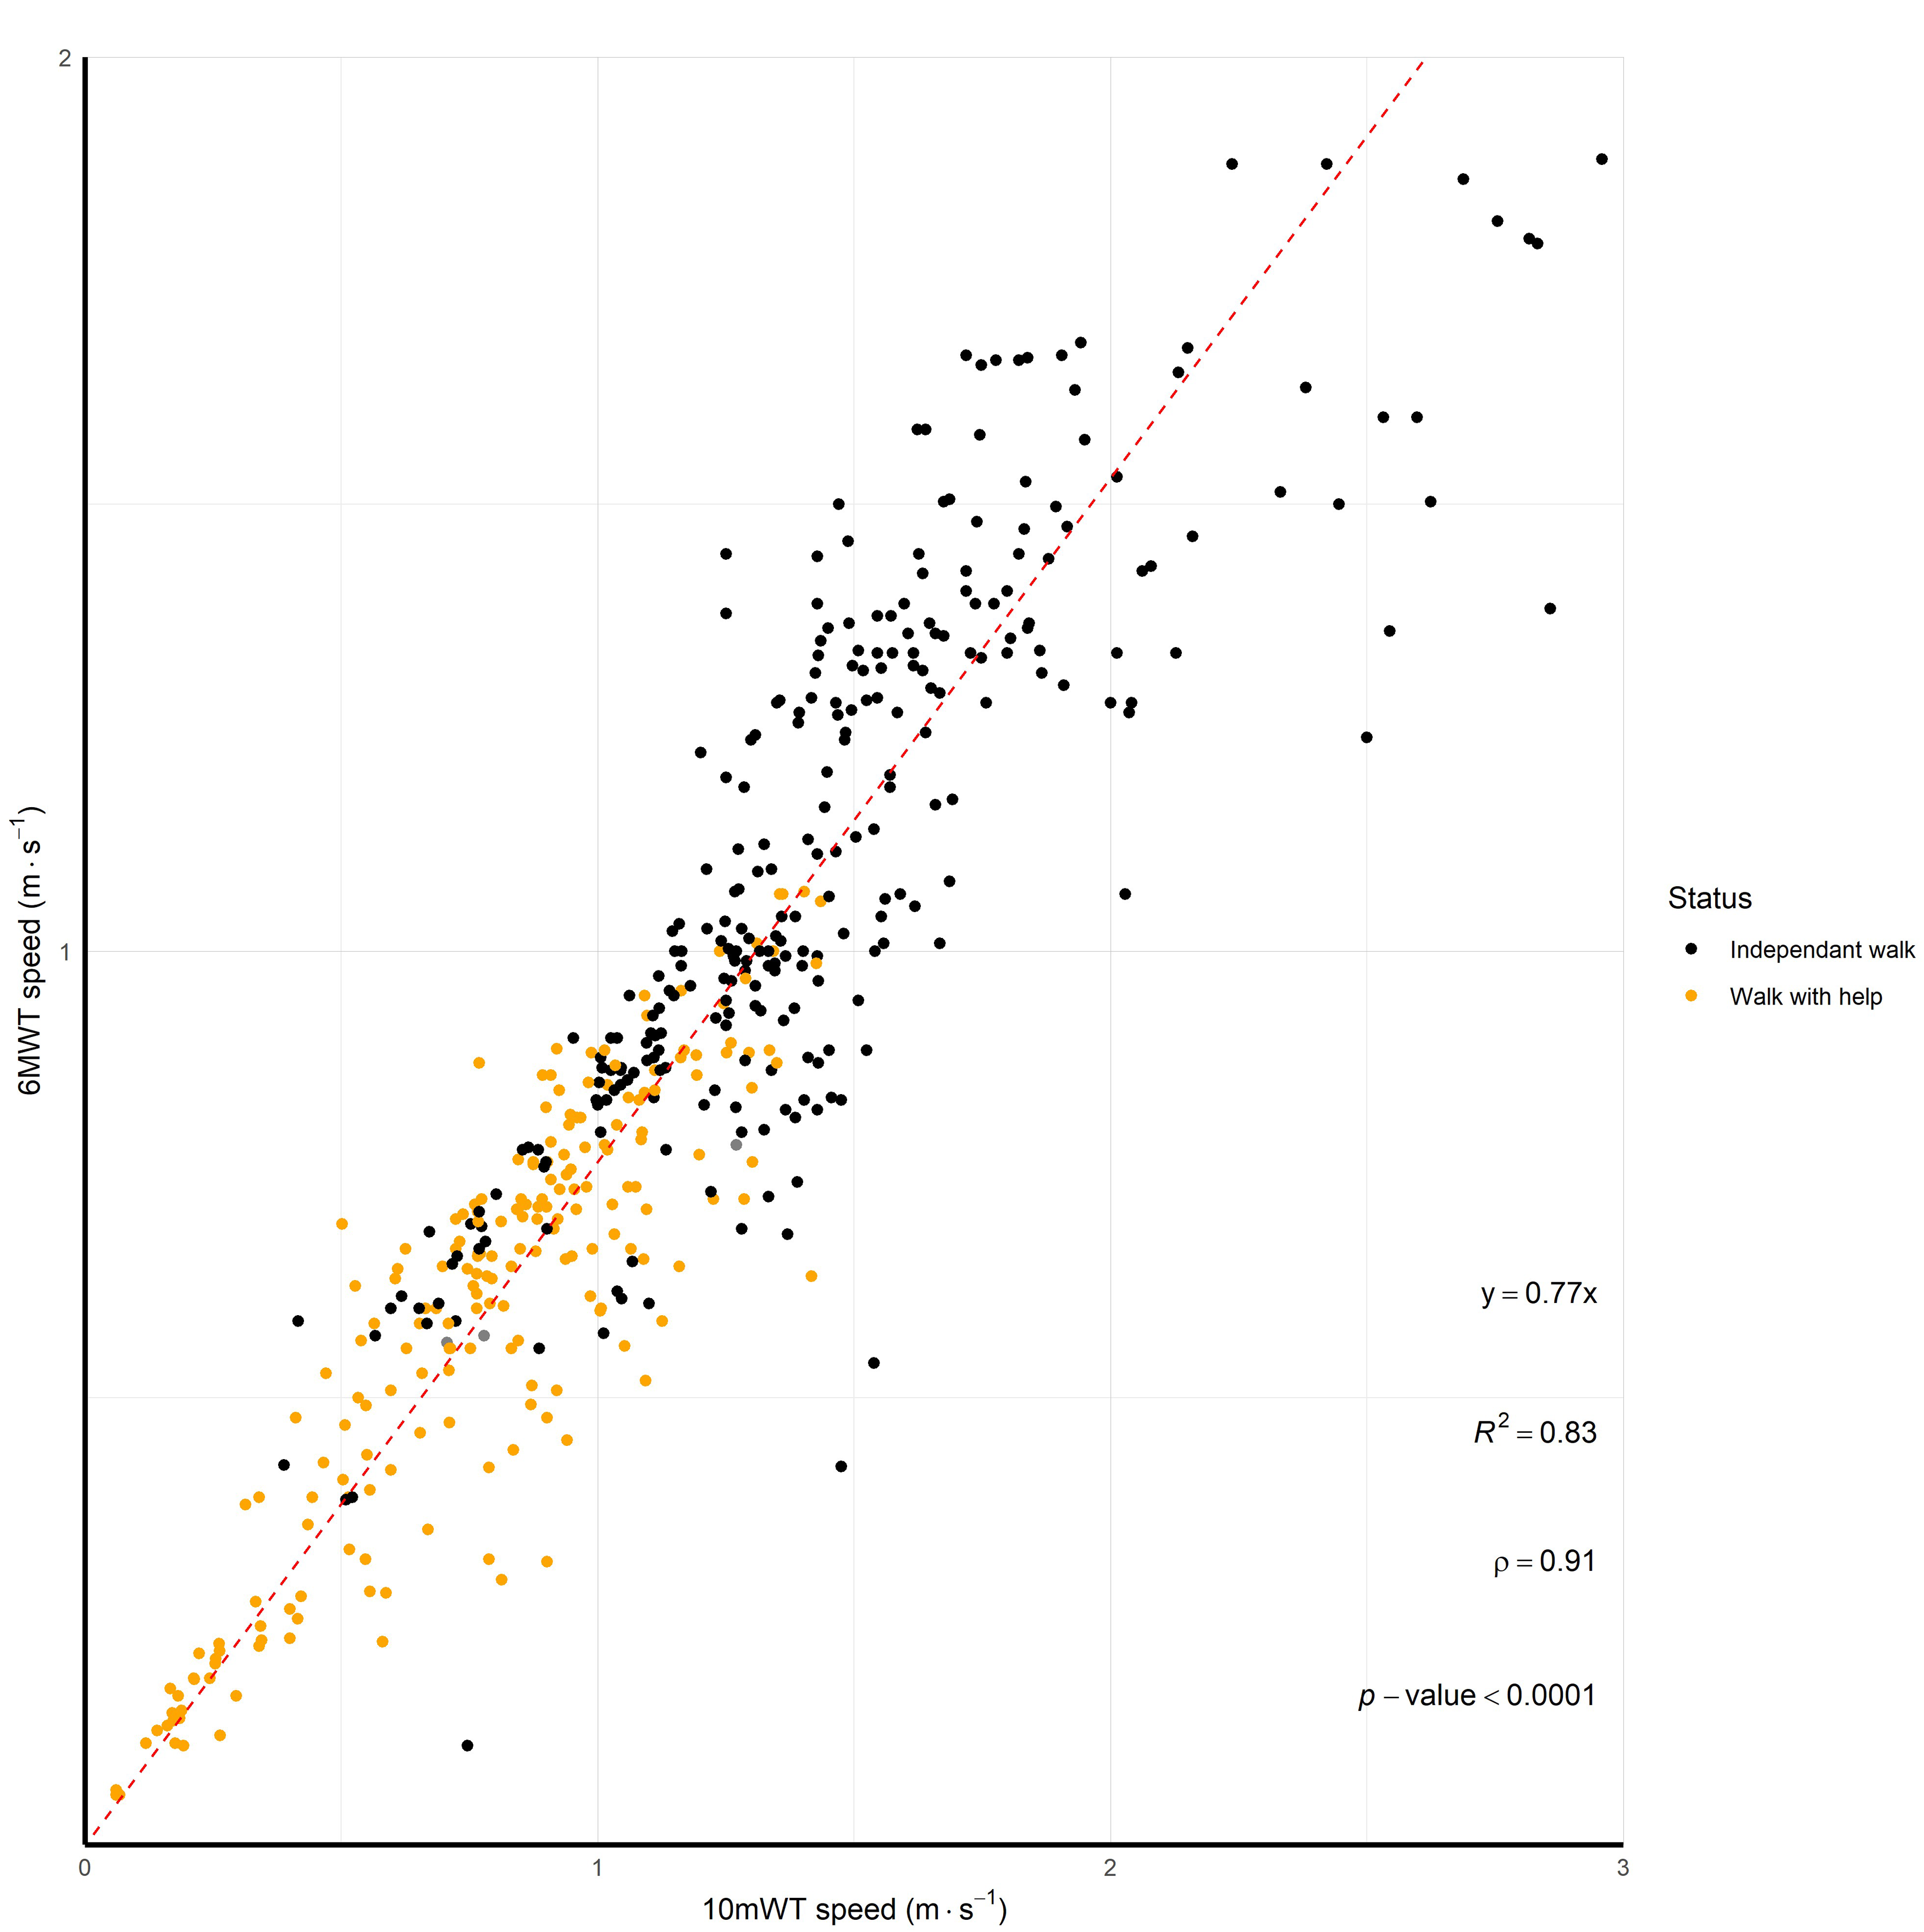
Correlation between 6MWT speed and 10mWT speed. Each point represents an individual's performance, color-coded based on their walking status (Independant walk, Walk with help). The red line represents the linear regression fit to the data, depicting the overall trend. The annotation includes the coefficient of determination (R2), Pearson correlation coefficient (ρ), and p-value, providing statistical insights into the strength and significance of the relationship. Furthermore, the equation of the regression line is annotated, indicating the estimated relationship between 6MWT and 10mWT.
The color-coded points indicate varying walking statuses, with individuals who require assistance or walk for less than 6 min exhibiting lower speeds on both tests. The R2 value of 0.83 suggests that approximately 83% of the variance in 6MWT can be explained by 10mWT, indicating a high level of association between the two variables. To simplify the model, the intercept was forced to 0, resulting in the following equation:
Furthermore, for a clinical context and using the same principle, considering the 6MWT distance (6MWD, in meters) and the time for the 10mWT (10mWT, in seconds), the model can be expressed as: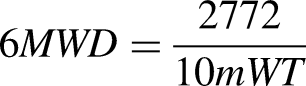
Performance of the single parameter (10mWT speed) model
We evaluated the performance of the single parameter model using the 10mWT speed to predict the 6MWT speed.
Figure 3 illustrates the predictive accuracy of the 6MWT speed using estimates derived from the 10mWT speed.
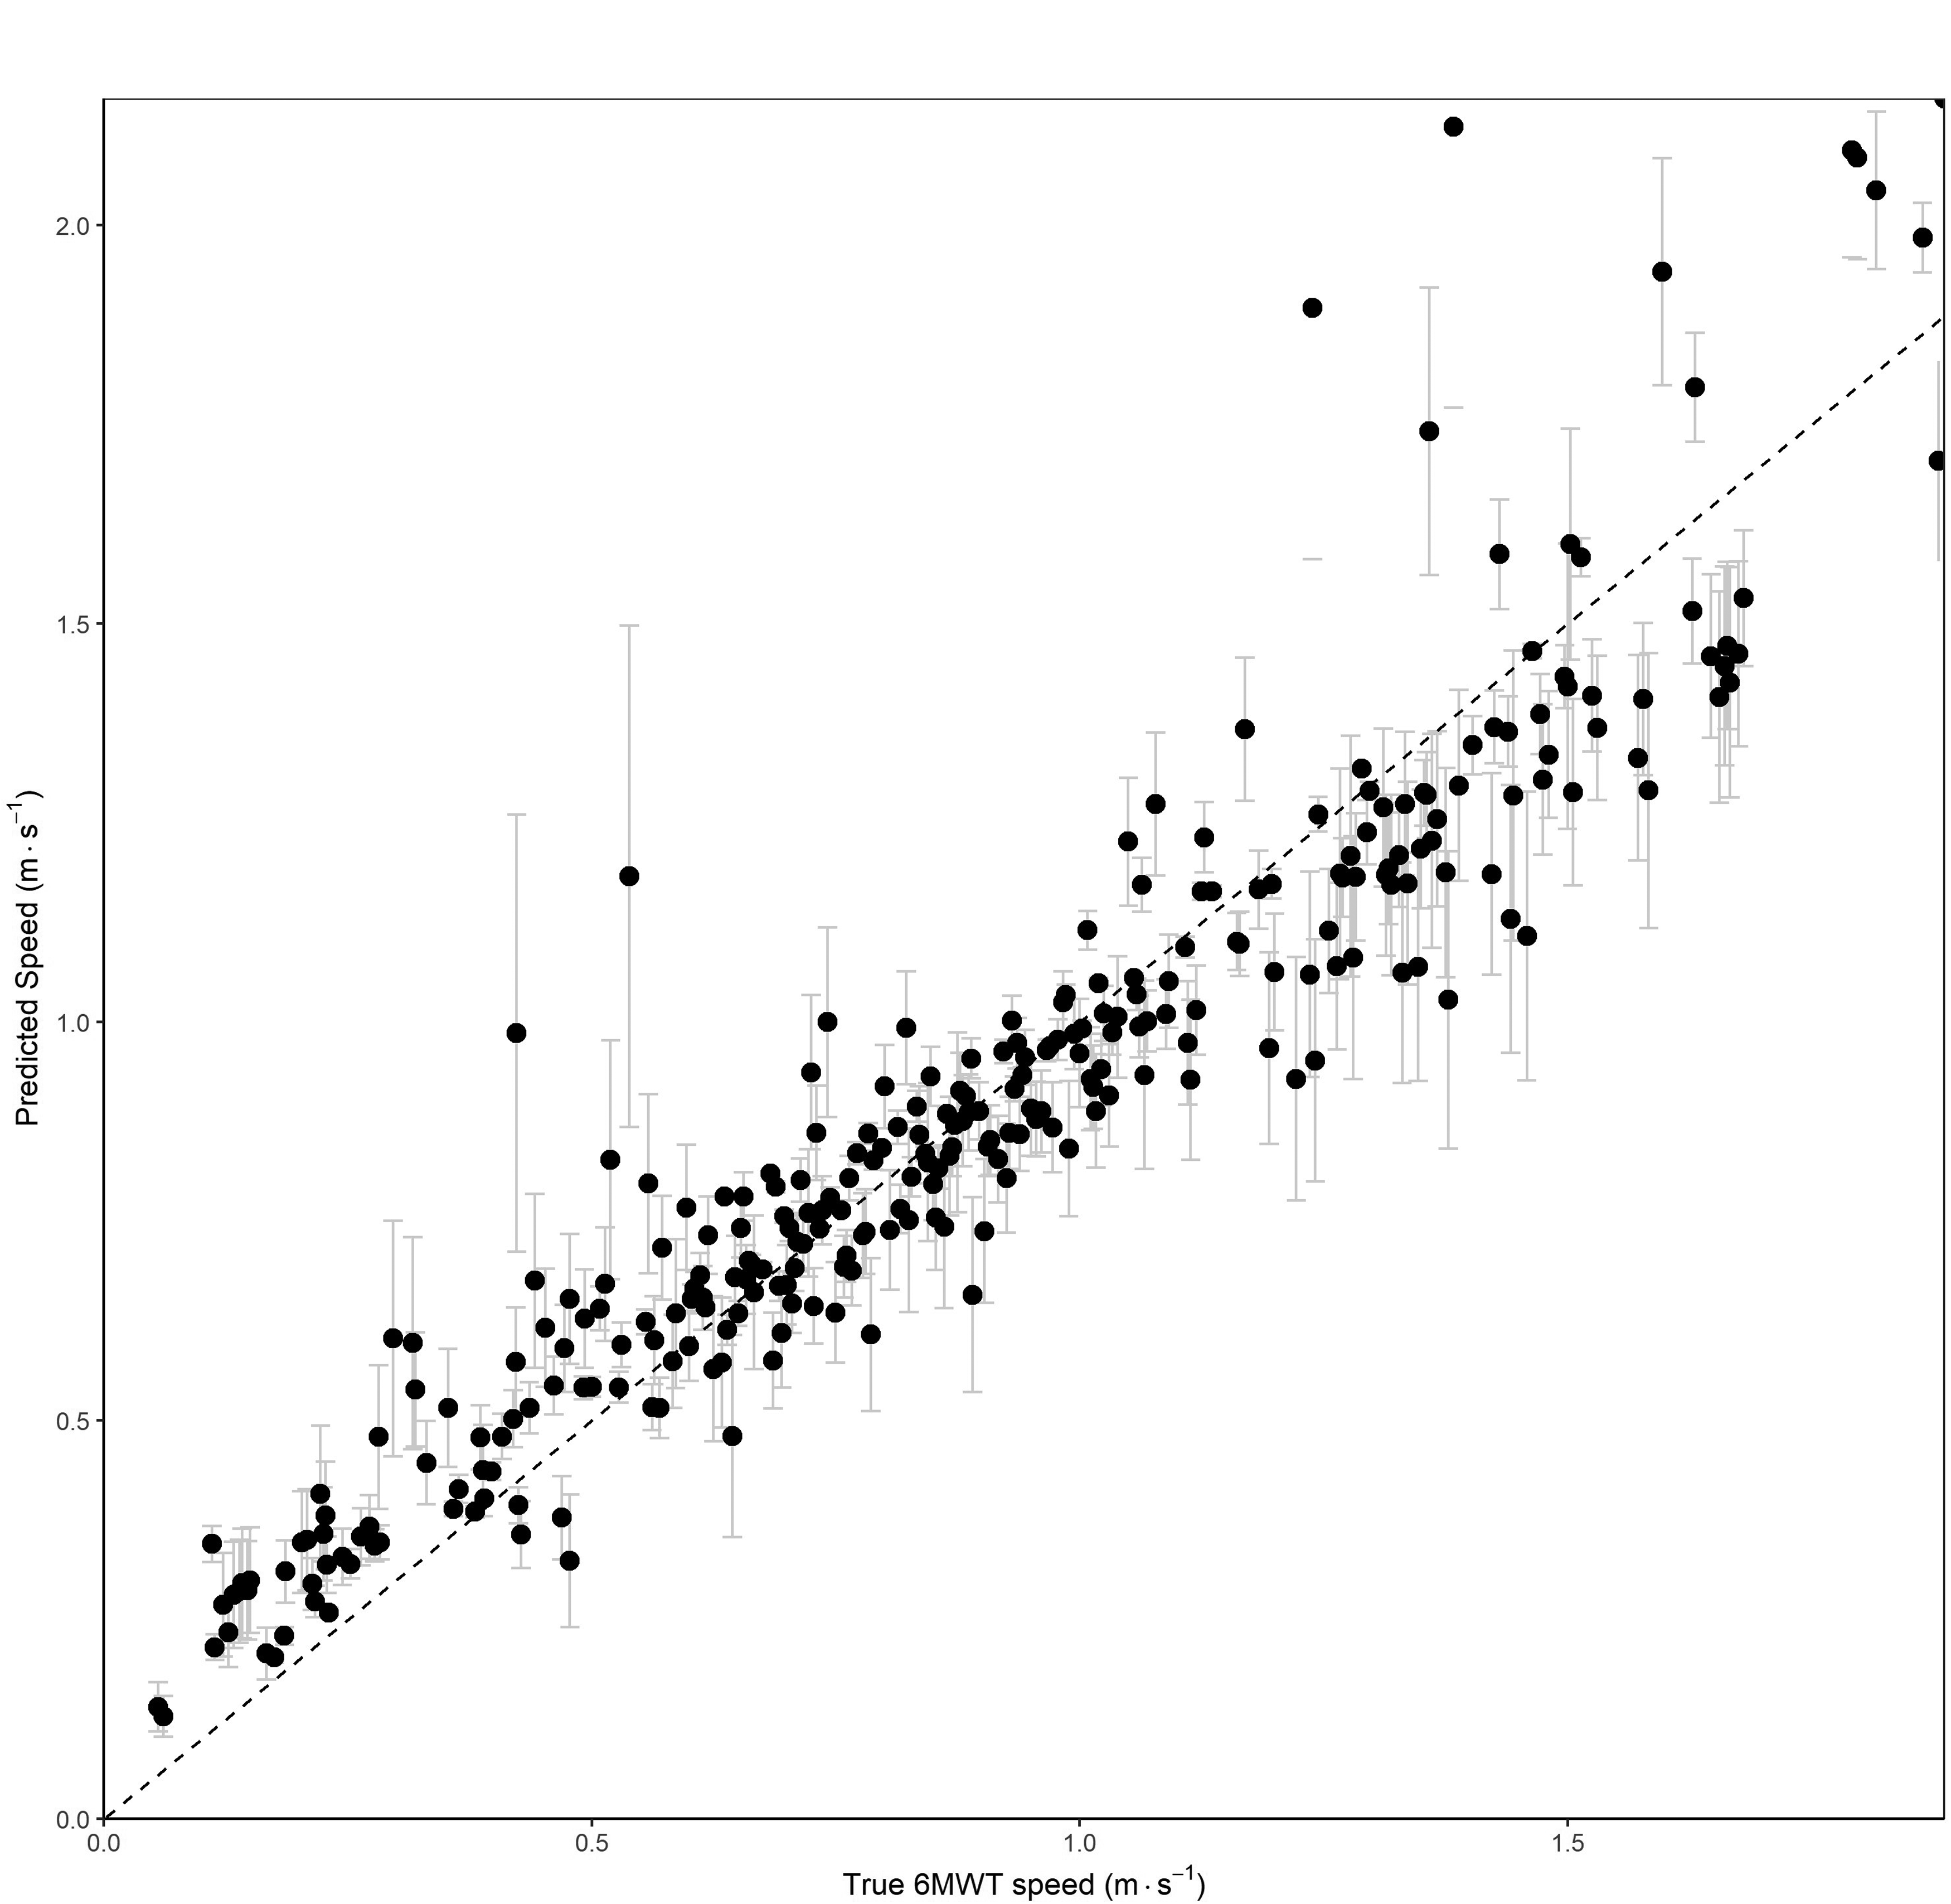
Predicting 6MWT speed. The scatter plot demonstrates a robust linear relationship between the true 6MWT speeds and the predicted speeds based on the 10mWT, with a high degree of concordance as evidenced by the proximity of the data points to the dashed line representing perfect agreement (slope = 1). Error bars represents the 95% empirical interval.
The error bars, representing 95% empirical prediction intervals, highlight the variability in predictions, showing that the majority of predicted values fall within a narrow range around the true values. The tight clustering of points along the identity line and the relatively small error bars indicate that the 10mWT speed serves as a reliable surrogate for estimating 6MWT speed performance. This empirical validation underscores the effectiveness of the model using 10mWT speed in providing accurate predictions of 6MWT speeds, suggesting its potential utility in clinical settings where the 6MWT may be impractical due to patient fatigue or severe mobility limitations.
Discussion
Walking tests are widely utilized as fundamental outcome measures for the assessment and monitoring of functional capacity in ambulatory patients across a wide range of conditions. Their clinical utility extends across numerous disorders, and establishing standardized, evidence-based protocols for evaluating gait parameters remains a critical priority. This is especially true for neuromuscular diseases, where premature fatigability and progressive muscle weakness are hallmark features that influence both mobility and quality of life.
In the context of Pompe disease, the 6MWT is used as a gold standard for evaluating functional capacity, since the first clinical trial assessing the benefit or ERT in Late Onset Pompe disease. 16 However, its practical application is limited in patients with severe mobility impairments, many of whom are unable to perform the test due to profound muscle weakness or fatigue. The findings of this study address this gap by demonstrating a predictive model for the 6MWT based on the 10mWT. This model, supported by strong correlations with the MFM-32 scale and knee muscles strength, offers a practical and clinically relevant alternative for assessing functional capacity in severely affected individuals.
From a statistical perspective, the eight-parameter model demonstrated the highest adjusted R2 of 0.89, explaining 89% of the variance in 6MWT speed. However, despite the inclusion of variables such as maximal knee extension strength, MFM-32 and the 1-min sit-to-stand test, its increased complexity yielded only a marginal improvement in predictive accuracy compared to the five-parameter model (adjusted R2 = 0.86). The latter, incorporating 10mWT speed, weight, height, age, and sex, offers a more pragmatic balance between predictive performance and clinical feasibility, requiring fewer assessments while maintaining robust accuracy. The selection of these five parameters aligns with established physiological determinants of walking capacity, as 10mWT speed is well-documented to correlate with 6MWT performance, and normative values for the 6MWT are typically derived from anthropometric and demographic variables, including age, sex, height, and weight. Although the five-parameter model provides only a limited gain in precision over the single-parameter model (adjusted R2 = 0.83), it remains advantageous by integrating easily measurable variables that enhance its applicability in diverse clinical settings.
Despite the strong correlation observed between the 10mWT and 6MWT speeds, it is important to recognize that these tests evaluate distinct aspects of functional capacity. The 10mWT primarily assesses maximum walking speed, offering a direct measure of gait performance and lower limb muscle strength. In contrast, the 6MWT captures endurance and exercise capacity over a prolonged duration, integrating additional factors such as cardiopulmonary function, metabolic demand, and patient motivation. While the 6MWT is sensitive to detecting clinical deterioration in neuromuscular diseases.17,18 it does not allow for a clear distinction between limitations due to respiratory dysfunction and those primarily related to muscle weakness. This confounding factor complicates the interpretation of results, especially in Pompe disease, where both skeletal and respiratory muscles are progressively affected. The 10mWT, by focusing on short-distance walking at maximum effort, provides a more specific evaluation of lower limb function and neuromuscular impairment, minimizing the influence of respiratory limitations.
The correlation between 6MWT speed and 10mWT maximal speed has been examined with varying results across studies but, in our knowledge, no study has developed a predictive equation for estimating 6MWT performance from 10mWT results in non-affected individuals. While Roush et al. reported a very strong correlation (N = 73, R = 0.95, p < 0.05), Dalgas et al. found a more moderate association (N = 46, R = 0.69, p < 0.05).19,20 These discrepancies may reflect differences in study populations, gait characteristics, or methodological approaches. Importantly, despite these investigations, and in our knowledge, no predictive equation for estimating 6MWT performance from 10mWT has been identified in non-affected individuals.
The relationship between 6MWT and 10mWT has been extensively studied in various neurological conditions, consistently demonstrating strong correlations. In multiple sclerosis, correlation coefficients range from R = 0.88 to 0.95,19,21 while in stroke populations, they range from R = 0.82 to 0.95.19,22–24 In people with Parkinson's disease, Duncan et al. (2017) found a correlation of R = 0.79 (p < 0.001) and an equation (Y = 0.65X + 0.12), closely aligning with our results. 25 For with people spinal cord injuries, Forrest et al. (2014) reported a strong correlation (R = 0.94, p < 0.001) and developed a predictive equation (Y = 0.74X + 0.05), which is similar to our model in Pompe disease (Y = 0.693X + 0.078). 26 In incomplete spinal cord injury, Van Hedel et al. (2007) also found a strong correlation (R = 0.93, R2 = 0.86) but a different predictive model (Y = 0.91X + 0.11), characterized by a steeper slope and higher intercept. This suggests distinct gait efficiency profiles in this population, where endurance performance may be more influenced by compensatory mechanisms related to central nervous system plasticity rather than primary muscle weakness. However, it is important to note that most of these studies involve neurocentral disorders, where motor control and coordination deficits play a significant role, rather than neuromuscular conditions characterized by progressive muscle weakness.
Beyond its predictive capacity, the 10mWT offers significant practical advantages in clinical settings. Its shorter duration reduces the physical burden on patients, mitigating fatigue and associated negative psychological effects such as diminished confidence or self-esteem. In contrast, the longer and more demanding nature of the 6MWT can exacerbate patient fatigue, potentially undermining their morale and engagement with care protocols. By offering a less physically taxing assessment, the 10mWT enhances patient adherence to monitoring schedules and provides a more supportive evaluation experience. These considerations are particularly relevant in progressive neuromuscular diseases, where maintaining patient cooperation and well-being is paramount. Additionally, the 10mWT could be easier to perform at home, allowing for more frequent assessments without requiring a clinical visit. This facilitates closer monitoring, enables patients to track their functional status over time, and helps attenuate the impact of day-to-day variability. Moreover, the test is quicker to administer than the 6MWT, reducing the burden on medical teams, whose resources are often constrained. Unlike the 6MWT, it also requires a shorter corridor, further increasing its feasibility across various clinical and home settings.
Neuromuscular diseases encompass a heterogeneous group of disorders, each with distinct anatomical, physiological, and functional characteristics. For example, conditions such as Duchenne muscular dystrophy, myotonic dystrophy, or spinal muscular atrophy involve varying degrees of proximal versus distal muscle involvement, disease progression rates, and associated complications, all of which could influence the performance on walking tests. The relationship between short-duration tests, like the 10mWT, and longer endurance-based measures, such as the 6MWT, may differ significantly across these disorders, given their diverse underlying pathophysiology.
To extend the applicability of these findings beyond Pompe disease, future research should systematically evaluate the relationship between walking tests in other neuromuscular conditions. Comparative studies involving diverse patient populations are necessary to determine whether the strong correlation observed between the 10mWT and the 6MWT in Pompe disease can be replicated in disorders with distinct clinical presentations. Until such studies are conducted, the models and conclusions presented here should be interpreted as specific to Pompe disease, offering valuable insights for this population but not yet generalizable to the broader spectrum of neuromuscular disorders.
Conclusion
This study highlights the utility of the 10mWT as a reliable surrogate for the 6MWT in Pompe disease, with a strong correlation between 10mWT speed and 6MWT performance. The five-parameter model, incorporating 10mWT speed and basic demographic variables offers a practical and accurate alternative to more complex models.
The 10mWT provides significant advantages in clinical practice, particularly for patients with severe mobility impairments, by reducing physical burden and fatigue while maintaining high predictive accuracy. Its simplicity and efficiency make it a valuable tool for routine monitoring and resource-limited settings.
Future research should explore the applicability of the 10mWT in broader neuromuscular populations and investigate its integration into standardized functional assessment frameworks.
Footnotes
Acknowledgements
Authors give a special thanks to Aurélie Canal and Gwenn Ollivier for their expertise and their essential role in performing the clinical evaluations for this study. The authors also extend their gratitude to Pierre Henry for his invaluable contribution in creating the website enabling the prediction of the 6MWT distance.
Credit author statement
Predict the 6MWT website
We developed an online tool to facilitate the prediction of the 6MWT distance based on the selected clinical variables, including 10mWT speed, age, sex, height, and weight: https://6mwd-predictor.myodata.org/. The website provides users with a straightforward interface to input these variables and instantly obtain the predicted 6MWT distance, along with a 95% confidence interval for the prediction for each model.
Funding
The authors received no financial support for the research, authorship, and/or publication of this article.
Competing interest
Authors declare that they have no known competing financial interests or personal relationships that could have appeared to influence the work reported in this paper.
Conflicting interests
The authors declared no potential conflicts of interest with respect to the research, authorship, and/or publication of this article.
Generative AI and AI-assisted technologies in the writing process
During the preparation of this work, the authors used ChatGPT to assist with text refinement, linguistic editing, and the synthesis of certain sections of the manuscript. After using this tool, the authors reviewed and edited the content as needed and take full responsibility for the content of the publication.