
Abstract
In Duchenne muscular dystrophy (DMD), age at symptom onset and rate of decline thereafter vary considerably. This study contrasted disease progression over time using the North Star Ambulatory Assessment (NSAA) in an overall sample of patients with DMD (mean age 7.1 years; baseline total NSAA score 22.2) with that of a centrally representative subgroup (mean age 6.9 years; NSAA score 24.0) defined according to median age at loss of ambulation. The average disease trajectory in the overall sample understated the more rapid rates of decline experienced by patients in the centrally representative subgroup.
Keywords
Background
Duchenne muscular dystrophy (DMD) is a progressive X-linked neuromuscular disease mainly affecting young boys, with an estimated annual incidence of one in 5000 live male births1,2 and a point prevalence in the United States, United Kingdom, and Canada of 1.9–6.1 in 100,000 males. 3
Early manifestations of DMD, including frequent falls and difficulty running and climbing stairs, 4 occur after the first few years of life and usually progress to loss of ambulation by early teens. 4 Progressive loss of upper limb function occurs alongside declines in cardiac and pulmonary function, contributing to early mortality typically in the thirties.4,5 Phenotypic variability in the age at onset of marked functional deficits, and in the subsequent timing of functional declines, can complicate understanding of disease progression and prognosis. For example, while median age at loss of ambulation is 12 years,3,6 boys with DMD may lose ambulation as early as 6 years or not until their late teens. 7
This communication aims to advance understanding of the natural course of DMD by characterizing a typical pattern of disease progression amid heterogeneity using a series of visualizations based on the North Star Ambulatory Assessment (NSAA). The NSAA is a validated clinical assessment of ambulatory motor performance in DMD recommended in guidelines 8 and is increasingly used for clinical trial endpoints.9–13 We studied patterns of change in the NSAA total score and each of the 17 item scores for patients with a “centrally representative” pattern of disease progression relative to a broader overall population.
Methods
Patients and assessments
The North Star Clinical Network database contains data for patients with DMD collected during regular clinical and physiotherapy assessments from 24 pediatric specialist neuromuscular care centers in the United Kingdom. 14 Physiotherapists are trained to conduct the NSAA and other functional assessments. Each of the 17 items of the NSAA are scored from 0 (less able) to 2 (more able); the total NSAA score range is 0–34. This study included patients with at least two complete NSAA assessments between ages 4 and 16. The first visit was the baseline visit.
Caldicott Guardian regulations were followed. Information was entered in the database after obtaining written informed consent from patients’ parents. Only anonymous, de-identified data were analyzed. All clinical investigations were conducted according to the principles in the Declaration of Helsinki.
Analysis
A subgroup of patients with a centrally representative disease trajectory was defined as patients with: (1) an NSAA total score below 10 between ages 11 and 13 (consistent with loss of ambulation around age 12, the DMD population median3,6); and (2) an NSAA total score above 20 during at least one prior visit. This centrally representative subgroup was selected to reflect a common disease trajectory, characterized by a rapid decline in ambulatory function around the median age of loss of ambulation, which may not be fully captured in the overall population average. This approach was intended to highlight the contrast between typical and broader population patterns, rather than to represent all possible trajectories in DMD.
While the NSAA is an ordinal scale, total NSAA score was analyzed as a continuous variable given the high number of categories in the scale. This approach is commonly used in similar contexts to facilitate visualization and analysis of progression rates.11,15 Mean NSAA total scores were modeled using mixed-effects linear regressions, including both linear and quadratic terms for age and random intercepts. Average performance by NSAA item was described using heatmaps for visits grouped by age.
Results
The overall sample included 376 patients with DMD; at baseline, mean age was 7.1 years and mean NSAA total score was 22.2 (Table 1). An average of 5.1 NSAA assessments were available per patient. Approximately 78% (294/376) of patients had an NSAA total score above 16 at baseline, indicating a low likelihood of loss of ambulation within two years. 16 Across all NSAA assessments in the overall sample, approximately 70% (1365/1917) had an NSAA total score above 16.
Baseline characteristics.
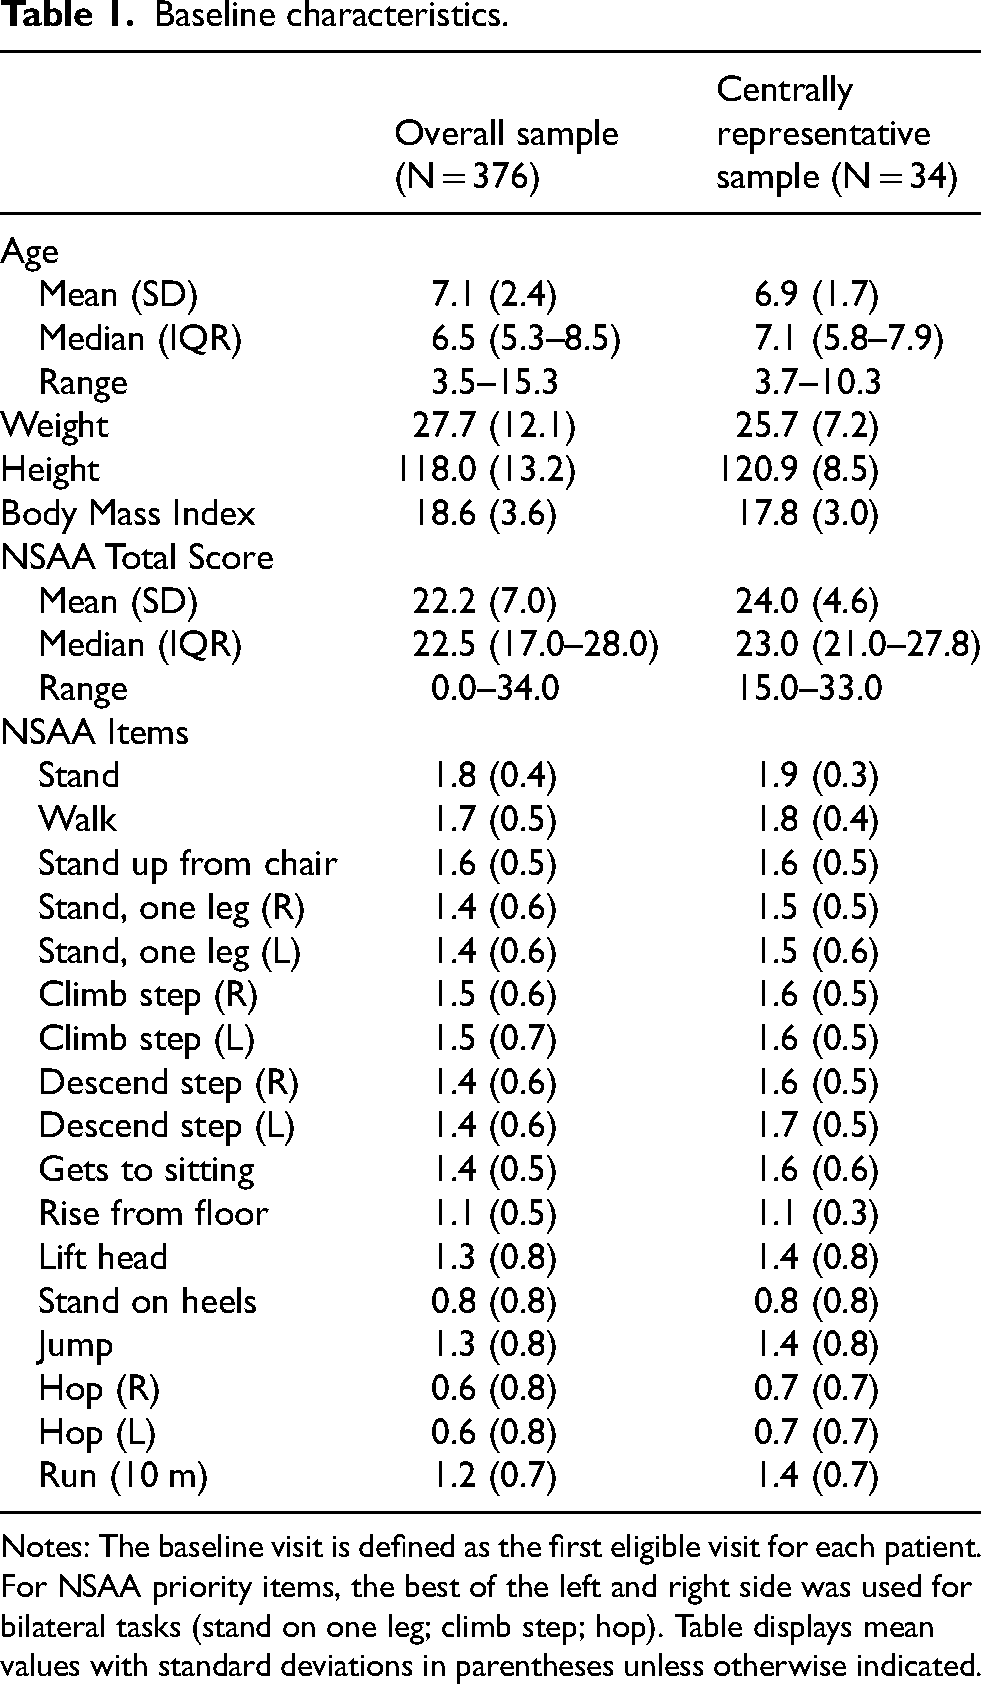
Notes: The baseline visit is defined as the first eligible visit for each patient. For NSAA priority items, the best of the left and right side was used for bilateral tasks (stand on one leg; climb step; hop). Table displays mean values with standard deviations in parentheses unless otherwise indicated.
The centrally representative sample included 34 patients with a mean age of 6.9 years and mean NSAA total score of 24.0 at baseline (Table 1). In both samples, baseline item scores were highest for stand and walk (1.7–1.9 on average) and lowest for stand on heels and hop (0.6–0.8 on average).
There was significant heterogeneity in disease progression in the overall sample (Figure 1(a)), with more similar trajectories observed, by design, in the centrally representative sample (Figure 1(b)). The average trajectory of the NSAA total score over time in the centrally representative subgroup followed an arc pattern, exhibiting development in functional capacity between ages 4 and 7 (mean NSAA total score increased from 21.4 to 27.8), with a subsequent loss of improvement and abrupt decline, reaching a score of zero just before age 13 (Figure 1(b)). Notably, the trajectory in Figure 1(b) resembles one constructed using the 50th centile of data drawn from the same database. 17
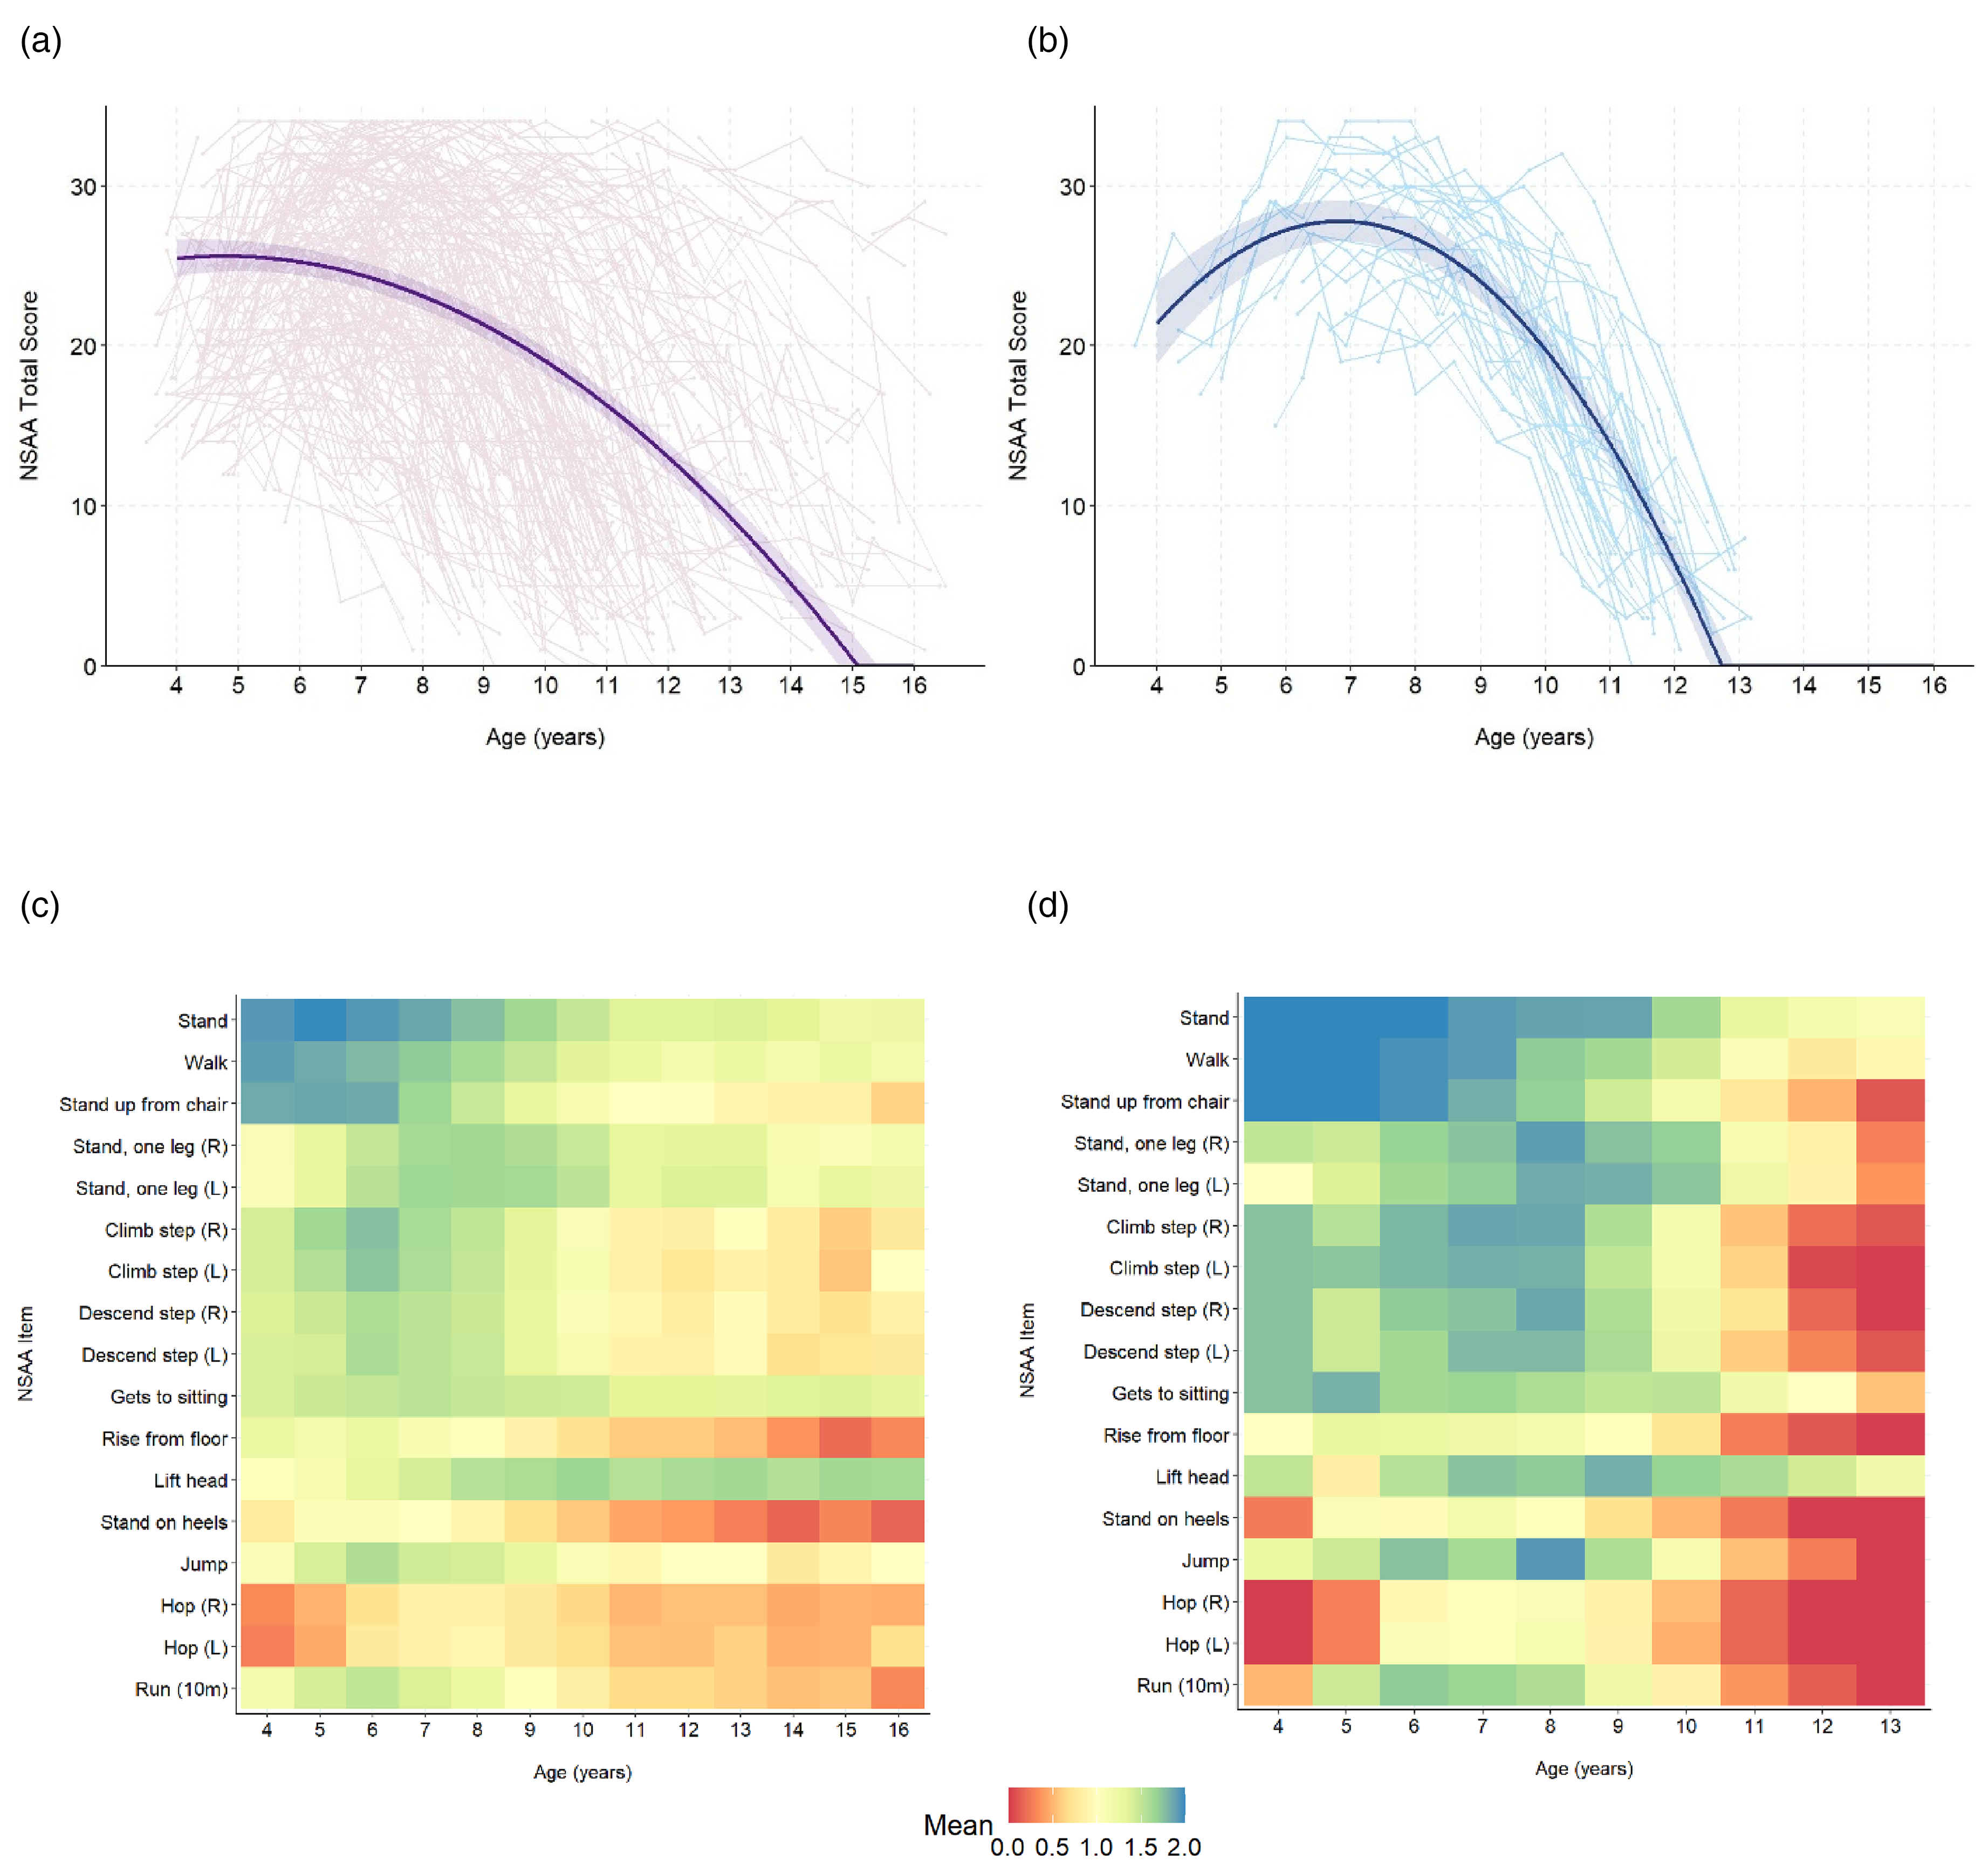
NSAA total score trajectories and mean NSAA item scores by age. (a) Trajectory (overall sample) (b) Trajectory (centrally representative sample) (c) Item scores (overall sample) (d) Item scores (centrally representative sample). Notes: Panels a and b show average NSAA total scores by age in the overall and centrally representative samples, respectively. In each panel, the solid line represents the fitted mean score, while the shaded region represents the 95% confidence interval. Lighter lines in the background represent NSAA total score trajectories for individual patients in each sample. The model explains a substantial portion of the variance in NSAA total score (conditional R² values of 0.81 and 0.82 in overall and representative samples, respectively), suggesting that the model structure, including both fixed and random effects, effectively captures important sources of variability in the data. Panels c and d show mean NSAA item scores by age in the overall and centrally representative samples, respectively.
The estimated rate of decline in the NSAA total score in the centrally representative sample ranged from −5.4 to −8.6 units/year in the 3 years before reaching zero and was visually consistent with rates of decline in the underlying individual patient trajectories. In contrast, the overall sample average exhibited a shallower decline in the NSAA total score, ranging from −3.8 to −4.7 units/year in the last 3 years, which is noticeably shallower than that of most underlying individual trajectories. Additionally, the early phase of functional improvement was not evident in the overall sample average, starting from a mean total NSAA score of 25.5, exhibiting a plateau from ages 4 to 6, followed by the shallower decline and reaching zero at a later age (approximately 15) (Figure 1(a)).
Different NSAA items exhibited different patterns of performance over time, which were most pronounced in the centrally representative sample (Figure 1(c) and (d)). Improvement of average performance is most evident in the centrally representative sample for abilities to stand on one leg, lift the head, jump and run (ages 4–8), and for abilities to stand on the heels and hop on one foot (ages 4–5) (Figure 1(d)). Other items, including the ability to stand, walk, rise from a chair, climb and descend stairs, and rise from the floor exhibited declines with older ages. Similar patterns were observed in the overall sample (Figure 1(c)), but with smaller-magnitude changes over time and averages closer to a score of 1. A subset of six NSAA items that have been shown to accurately proxy for the NSAA total score 18 (“priority items”) represented the range of item score patterns in both the overall (Figure S1(a)) and centrally representative (Figure S1(b)) samples.
Discussion
Rates of DMD progression are heterogeneous. The visualizations presented here describe the rapid declines in ambulatory performance among patients who lose ambulation at the median age for DMD. This study highlights that rates of functional decline in DMD can be understated (and for some patients, overstated) when looking at population averages. Average rates of functional decline, as measured by the NSAA total score, were notably slower in the overall population, obscuring the more rapid decline experienced by centrally representative patients. Rates of decline for individual items were also steeper among centrally representative patients relative to population averages.
The shallower rates of decline in the population average NSAA total score by age compared to the “centrally representative” subgroup indicate that different patients experience different rates of declines at different ages. Averaging NSAA total scores washes out the steepness of individual declines. Our previous studies have classified DMD progression trajectories using longitudinal approaches, such as latent class analysis of NSAA total scores. 11 Approaches to modeling and visualizing DMD progression using the NSAA scale are increasingly important given the rising use of NSAA scores in clinical practice and trials.9–13 We urge caution in using visualizations based on population averages to inform prognosis or to contextualize clinical trials in DMD. For any patient or clinical trial population, many factors besides age and current NSAA score, especially timed function tests, have been shown to improve the accuracy of prognosis.13,19 DMD progression and outcomes may also vary with frequency of corticosteroid treatment, 20 duration of treatment,7,21 and genotype,19,22,23 among others parameters.
Individuals with DMD are not well-represented by averages. As the pace of progression can have profound impacts on patients, caregivers, and trial design, visualizations characterizing representative trajectories amid population heterogeneity are important for understanding the true burden of DMD and developing promising therapies, and for counselling individual families. This short communication was intended to provide a broad perspective on the variability in disease progression among patients with DMD and to highlight the potential pitfalls of using population averages in visualizations. While we acknowledge the need for more refined strategies in clinical trial design (e.g., enhanced stratification or adaptive trial methodologies), addressing these in depth was beyond the scope of this article. Future research should focus on developing and validating these approaches to better accommodate the heterogeneity in DMD progression.
Supplemental Material
sj-docx-1-jnd-10.1177_22143602241313116 - Supplemental material for Visualizing ambulatory performance by age and rates of decline among patients with Duchenne muscular dystrophy
Supplemental material, sj-docx-1-jnd-10.1177_22143602241313116 for Visualizing ambulatory performance by age and rates of decline among patients with Duchenne muscular dystrophy by Anna G Mayhew, James Signorovitch, Michaela Johnson, Molly Frean, Susan J Ward, Nate Posner, Valeria Merla, Matthias Mahn, Georgia Stimpson, Michela Guglieri, Volker Straub, Robert Muni-Lofra, Adnan Manzur, Giovanni Baranello, Francesco Muntoni and the North Star Clinical Network in Journal of Neuromuscular Diseases
Footnotes
Acknowledgements
The authors are grateful to the UK NorthStar Network Study Group, the patients and their families, Certus Technology Associates Limited for hosting the database and Muscular Dystrophy UK (MDUK) for funding this Network. We thank the patients and their families for their permission to participate in research. We are grateful to patient advocacy organisations including Cure Duchenne and Parent Project Muscular Dystrophy for their encouragement and support in establishing the Collaborative Trajectory Analysis Project. AM, VS, MG, and RML are supported by the NIHR Newcastle Biomedical Research Centre.
Author contributions
All authors have made substantial contributions to (i) the conception and design of the study; (ii) the acquisition, analysis, or interpretation of data; and/or (iii) drafting the manuscript and revising it critically for important intellectual content. All authors have reviewed and provided final approval of this version to be published and agree to be accountable for all aspects of the work.
Funding
The authors disclosed receipt of the following financial support for the research, authorship, and/or publication of this article: This study was conducted by the collaborative Trajectory Analysis Project (cTAP)—a precompetitive coalition of academic clinicians, drug developers, and patient foundations formed in 2015 to overcome the challenges of high variability in DMD clinical trials—with funding from Pfizer Inc. The study sponsor was involved in several aspects of the research, including the study design, interpretation of data, writing of the manuscript, and decision to submit the manuscript for publication. cTAP has received sponsorship from Astellas (Mitobridge), Avidity Biosciences, BioMarin Pharmaceutical, Bristol Meyers Squibb, Catabasis, Daiichi Sankyo, Edgewise Therapeutics, Entrada Therapeutics, FibroGen, Italfarmaco SpA, Marathon Pharmaceuticals, NS Pharma, Pfizer, PTC Therapeutics, Roche, Sarepta Therapeutics, Shire, Solid Biosciences, Summit Therapeutics, Ultragenyx, Vertex Pharmaceuticals, Parent Project Muscular Dystrophy, Charley's Fund, and CureDuchenne, a founding patient advocacy partner that provided initial seed funding to cTAP.
Declaration of conflicting interests
The authors declared the following potential conflicts of interest with respect to the research, authorship, and/or publication of this article: AGM has served on medical/scientific advisory boards for Regenxbio, Sarepta, Biogen and Roche; and has received fees for consulting and training services for Biogen, Roche, Novartis, Biohaven, PTC, Sarepta, Italfarmaco, Dyne, Pfizer, Summit, Catabasis, Capricor, Santhera, Vision, Lysogene, Modis, Amicus, Taysha, Antisense, Analysis Group, MDUK and DUK. JS, MJ, and MF are employees of Analysis Group, Inc., a consulting company that has provided paid consulting services to Pfizer Inc., which funded this study. SJW has received consultancy fees from CureDuchenne, PPMD, Charley's Fund and Analysis Group. NP and VM are employees of Pfizer Inc. and own stock/stock options. MM was an employee of Pfizer Inc. at the time this study was conducted and held stock/stock options. GS has no conflicts of interest to disclose. MG has served on medical/scientific advisory boards for Pfizer, Dyne, NS Pharma, Antisense; has received research grants from PTC Therapeutics, Sarepta, Edgewise and was on the speaker's bureau for Italfarmaco, Sarepta, Pfizer, Novartis, Roche. VS is an Editorial Board Member of this journal, but was not involved in the peer-review process nor had access to any information regarding its peer-review. In addition, VS has received research grants from Sarepta Therapeutics and Sanofi, consultancy fees from Astellas Gene Therapies, Biogen, Edgewise Therapeutics, Ipsen, Kate Therapeutics, ML Bio Solutions, Novartis Gene Therapies, PepGen, Roche, Sanofi, Sarepta Therapeutics, Vertex Pharmaceuticals, and Wave Therapeutics, and was on the speaker's bureau for Pfizer, Roche, Sanofi, and Sarepta Therapeutics. RML has received research grants from Roche, consultancy fees from Roche, Biogen and Novartis, and was on the speaker's bureau for Biogen and Roche. AM has no conflicts of interest to disclose. GB is a principal investigator of clinical trials sponsored by Roche, Novartis, Sarepta, Pfizer, NS Pharma, Reveragen, Scholar Rock, and has received speaker and/or consulting fees from Sarepta, PTC Therapeutics, Pfizer, Biogen, Novartis Gene Therapies, Inc. (AveXis), and Roche, and grants from Sarepta, Roche and Novartis Gene Therapies. FM reports consultancy fees from Sarepta, Pfizer, Dyne Therapeutics, Kate Therapeutics, PTC Therapeutics and Roche, and research grants from Sarepta Therapeutics. FM has also participated in educational symposia organised by Roche, Sarepta and PTC Therapeutics.
Data availability
All relevant data are within the paper and its Supporting Information files. Individual data are available via data use agreement with The NorthStar Clinical Network database. Please contact Matthew Brooke at m.brooke@ucl.ac.uk. The authors did not receive special access privileges to the data.
Previous presentations
The material in this manuscript was presented at the 2023 Annual Meeting of the International Society for Pharmaceutical and Outcomes Research held May 7–10, 2023 in Boston, Massachusetts as a poster presentation.
Supplemental material
Supplemental material for this article is available online.
References
Supplementary Material
Please find the following supplemental material available below.
For Open Access articles published under a Creative Commons License, all supplemental material carries the same license as the article it is associated with.
For non-Open Access articles published, all supplemental material carries a non-exclusive license, and permission requests for re-use of supplemental material or any part of supplemental material shall be sent directly to the copyright owner as specified in the copyright notice associated with the article.