
Abstract
Background:
Oculopharyngeal muscular dystrophy (OPMD) is a rare, late-onset, slowly progressive neuromuscular disorder characterized by ptosis, dysphagia, and proximal limb weakness. Emerging clinical trials require rapidly accessible and sensitive biomarkers to evaluate OPMD disease progression and potential response to future treatments.
Objective:
This cross-sectional study was designed to identify candidate circulating protein and imaging biomarkers of OPMD severity for future use in clinical trials.
Methods:
Twenty-five individuals with OPMD (age 63.3 ± 10.5 years; GCN copy number of 13 in PABPN1) were assessed using the 7k SOMAScan assay to profile the plasma proteome, and MRI to quantify replacement of muscle by fat. OPMD severity was first categorized using the clinical presence/absence of limb weakness, and protein signals were considered distinguishing if they differed by more than 30% between subgroups and had statistically significant P-values after correcting for multiple comparisons. Distinguishing proteins were contrasted with age-matched controls (n = 10). OPMD severity was also treated as a continuous variable using fat fraction of the soleus muscle, and proteins were considered distinguishing if the slope of relationship between protein signal and soleus fat fraction differed significantly from zero after correcting for multiple comparisons. Pathway analyses were conducted using Metascape and the Database for Annotation, Visualization, and Integrated Discovery webtools.
Results:
Eighteen plasma proteins distinguished OPMD on both indicators of severity. Pathway analyses identified skeletal muscle tissue, phagocytosis/engulfment, and extracellular matrix organization as enriched ontology clusters in OPMD with limb weakness. The most distinguishing plasma protein signals (ACTN2, MYOM2, CA3, APOBEC2, MYL3, and PDLIM3) were over 200% higher in OPMD with limb weakness than OPMD without limb weakness as well as controls, and correlated strongly with percent of fatty replacement of soleus (r = 0.89 ± 0.04).
Conclusions:
The candidate biomarkers identified contribute to the ongoing search for sensitive and accessible biomarkers of OPMD progression, prognosis, and monitoring.
Introduction
Oculopharyngeal muscular dystrophy (OPMD) is a rare, late-onset disorder causing eyelid ptosis, dysphagia, and proximal muscle weakness and diminished quality of life in later years.1,2 OPMD is most frequently caused by a trinucleotide GCN repeat leading to a polyalanine expansion in poly(A)-binding protein nuclear 1 (PABPN1), 3 and more rarely due to point mutations. 4 Although recessive cases have been reported, autosomal dominant inheritance is typical. 2 Symptomatic interventions include levator palpebrae tendon resection or sling surgeries for ptosis5,6 and cricopharyngeal dilatation and surgical myotomy for dysphagia. 7 However, the relief offered by these treatments often diminishes with time as the disease progresses.5–7
Given the slowly progressive course of OPMD, highly sensitive biomarkers are required to effectively monitor disease progression as well as treatment response in clinical trials. 1 Existing biomarkers for OPMD, while useful, have limitations which must be considered. Genotype (i.e., PABPN1 GCN copy number) provides invaluable diagnostic information for OPMD, 3 and may have prognostic value in estimating an age of symptom onset. 8 However, age of symptom onset and rate of symptom progression vary considerably among carriers of the same size GCN expansion and within families.8–10 Scales assessing the severity of specific symptoms are important for clinical monitoring but may not provide the needed sensitivity at all disease stages. For example, symptoms of proximal muscle weakness may not be detectable early in the disease, and many functional strength tests require patients to be ambulatory, an ability which can be lost late in the disease course. 11 Additionally, symptom severity does not necessarily correlate with disease progression, as ptosis and dysphagia symptoms can be improved after intervention.7,12,13 Alonso-Jimenez et al. 14 suggested a comprehensive 5-stage clinical severity score to stratify patients with OPMD as i) asymptomatic, ii) isolated ptosis (treated or untreated) or isolated untreated dysphagia, iii) ptosis and untreated dysphagia, iv) surgical or botulinum toxin treated dysphagia, and v) limb muscle weakness. While useful, this scale was not intended to be a sensitive indicator of disease progression, particularly after proximal weakness is present.
Muscle fat infiltration may be a valuable indicator of clinical severity of OPMD, with soleus, adductor magnus, lumbar paraspinals, serratus anterior, and tongue identified as specifically affected using MRI.14,15 However, there has been limited research on the variability of muscle fat fraction (FF) between patients with OPMD or at different stages of the disease course. While muscle MRI provides a highly sensitive and objective measure of muscle fat infiltration, not all patients are able to undergo MRI due to incompatible implants, claustrophobia, or positional exacerbation of dysphagia symptoms.16–18 Additional techniques are needed to assess disease severity and monitor progression in OPMD and identify underlying disease processes which may have prognostic and therapeutic value.
Although knowledge regarding OPMD pathophysiology has been obtained from the study of muscle biopsies, widespread availability of genetic testing for OPMD makes muscle biopsies clinically unnecessary for most patients with OPMD. Also, the cost and invasiveness of muscle biopsies pose challenges to the use of muscle samples in clinical trials on OPMD. In contrast, blood samples can be obtained rapidly, less invasively, and at lower cost than muscle biopsies in clinical settings. Although blood-based biomarkers for OPMD progression and symptom severity have yet to be identified, blood proteome profiling has identified candidate biomarkers in other myopathies.19–22 Aptamer-based blood proteomics assays have emerged as highly sensitive, high throughput multiplexed assays for biomarker discovery in the diagnosis and longitudinal monitoring of muscle disease.19,21
This study was designed to identify candidate plasma protein biomarkers indicative of clinical progression and/or severity in patients with OPMD. We hypothesized that specific plasma proteins could distinguish participants with OPMD exhibiting proximal limb weakness (a sign of advanced OPMD) from participants with OPMD not exhibiting proximal limb weakness. We also hypothesized that the content of specific plasma proteins could correlate with clinical features expected to be indicative of disease severity in a progressive neuromuscular disease, including age, time since symptom onset, and muscle fat fraction in MRI. This work is needed to inform longitudinal studies assessing the natural progression of OPMD, and clinical trials assessing responses to novel therapies.
Materials and methods
Participant recruitment
All protocols and procedures were approved by the Ottawa Health Science Network Research Ethics Board (OHSN-REB). Informed consent was obtained from all participants. Participants with OPMD were recruited from the NeuroMuscular Center at The Ottawa Hospital (OHSN-REB Protocol #20190056-01T). Two separate Control groups were used to help distinguish effects of aging from effects of OPMD. Control participants for proteomics analysis were unrelated companions or spouses accompanying individuals with OPMD to their clinical visits (OHSN-REB Protocol #20220595-01H). Control MRIs were obtained from an unrelated group of individuals with no neuromuscular disorder undergoing MRI as part of their routine care in the NeuroMuscular Center (OHSN-REB Protocol #20190056-01T). Inclusion criteria for participants with OPMD were being ≥18 years of age and having genetically confirmed OPMD with a GCN copy number of 13 in PAPBN1. Exclusion criteria included pregnancy or any contra-indication for MRI. Inclusion criteria for the MRI Control group were age ≥18 years. Exclusion criteria for the Control group were pregnancy and having any neuromuscular disorder.
Subclassification of participants with OPMD
Participants with OPMD underwent an assessment of medical history, muscle strength testing, 23 and whole-body muscle MRI. Age and years since onset of first OPMD symptom are shown in Table 1. All participants reported that their initial symptoms were ptosis and/or dysphagia, indicating that proximal weakness is indeed a sign of a more advanced stage of disease in our patient population. A previous study on individuals with OPMD also found that symptoms of dysphagia and ptosis preceded manifestation of lower limb weakness. 11 To aid the identification of proteins which might distinguish early and advanced stages of OPMD, participants were classified based on the presence versus absence of limb weakness on clinical assessment by a neuromuscular neurologist with >10 years of clinical experience. Limb weakness was defined to be present if any muscle power rating in the hips (flexion, extension, abduction, adduction) was below 5/5 on the expanded Medical Research Council scale 23 during manual muscle testing.
Participant characteristics.
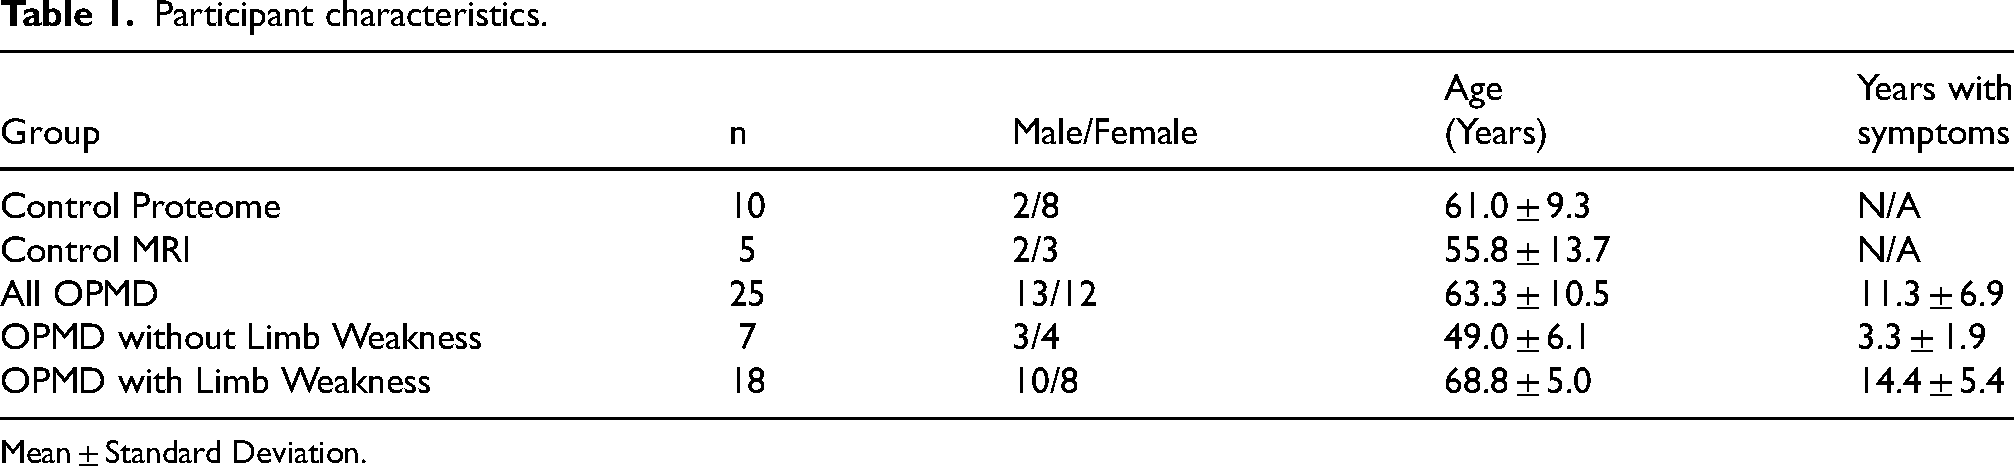
Mean ± Standard Deviation.
Blood collection and processing
Blood was obtained using a blood collection set (REF 367344/367342; BD Vacutainer, USA) and K2 EDTA collection tubes (REF 367863; BD Vacutainer, USA). Tubes were centrifuged at 2300 g for 15 min at 22°C (Model 5702; Eppendorf, USA). Plasma without signs of hemolysis was aliquoted, frozen, and stored at −80°C for later analysis.
MRI and muscle fat fractions
MRI was performed at 3 Tesla (Magnetom Trio, Siemens Healthineers, Erlangen, Germany) (n = 14) or at 1.5 Tesla (Magnetom Aera, Siemens Healthineers, Erlangen, Germany) (n = 11). A head coil, two body matrix coils, a peripheral leg coil and the table built-in spine coil were used for signal detection. Participants were examined in head-first, supine position using a three-plane localizer sequence followed by a quantitative fat/water 2-point 3D-Dixon sequence in axial orientation covering proximal from at least the nose level at head to the distal aspect of the soleus. Total scan time for each protocol was 40 min. From the 2-point Dixon sequence, the in-phase (water and fat), out-of-phase (water minus fat), water-only and fat-only images were reconstructed, and fat-fraction maps were generated by dividing the fat-only dataset by the sum of the fat-only and water-only dataset. Additional muscle MRI parameters are in the Supplemental Text.
Based on previous MRI assessment of muscle fat fraction in OPMD,14,15 the five most frequently affected muscles were chosen for analysis on the axial in-phase Dixon images. Specific anatomical levels of these five muscles were pre-determined for assessment: 1) tongue (largest section without susceptibility artifacts), 2) serratus anterior (5 cm below the inferior aspect of the scapula), 3) internal paraspinal muscle (multifidus) at the level of L3, 4) adductor magnus (10 cm below the ischial tuberosity) and 5) soleus (at the level of the distal myotendinous junction of the medial head of the gastrocnemius) (Figure 1(a)). Given the relative symmetry observed in muscle FF obtained from MRI, and well-established symmetry of muscle involvement in OPMD, 24 muscle FF of left and right sides were averaged together. The region of interest on each image was drawn using ITK-SNAP (Version 3.6.0). 25
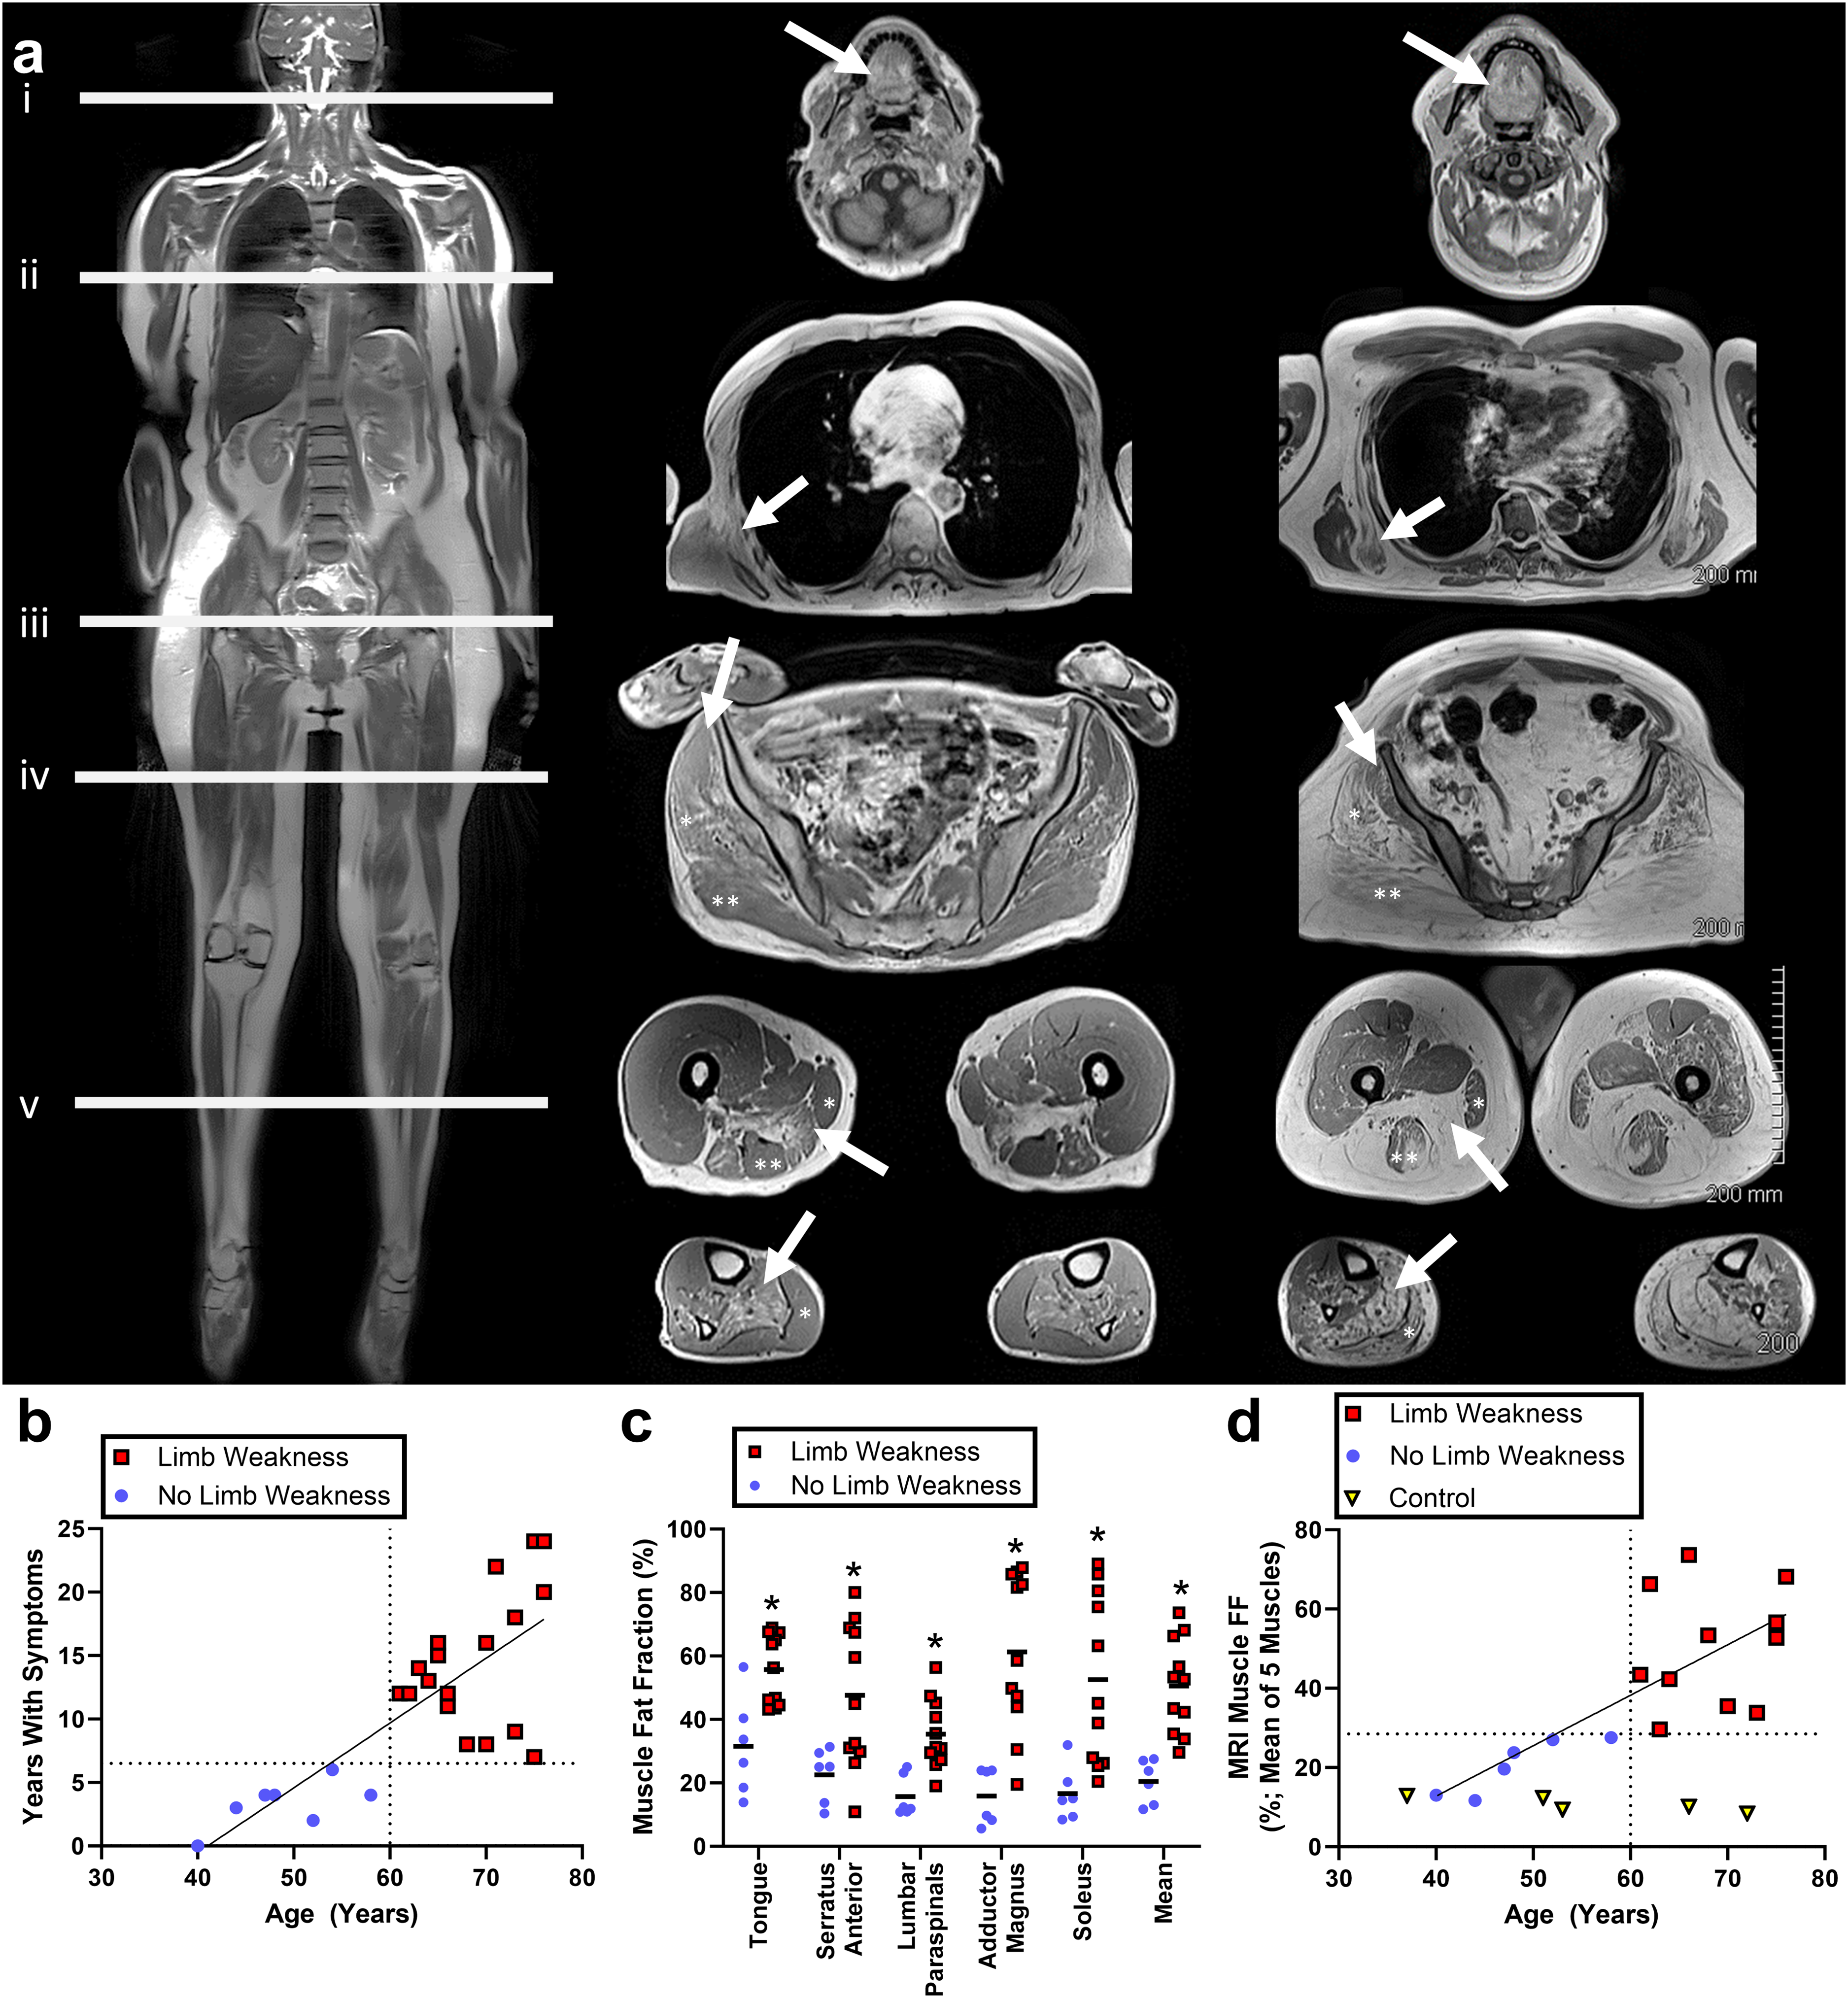
Demographic and clinical subdivisions in the OPMD cohort and in relation to muscle MRI fat fraction.
Plasma proteome profiling with SOMAScan technology
Aliquots of plasma were shipped on dry ice to the SomaLogic Facility (Boulder CO, USA) for analysis using the validated 7k SOMAScan assay, as described previously.19–21,26 Briefly, plasma samples were treated with a panel of slow off-rate modified DNA aptamers (SOMAmers) that bind to protein targets with high affinity and specificity. The panel used for this study consisted of 7289 SOMAmers identifying 6402 unique human proteins. 26 Each SOMAmer is tagged with a short DNA sequence to facilitate high-throughput detection in a custom microarray. Protein quantities are reported in relative fluorescence units that are directly proportional to the amount of target protein present in the initial sample. Data normalization and quality control assessment were performed by the manufacturer using methods which have been published elsewhere. 26 Raw and normalized proteome datasets are included as supplemental files, along with corresponding clinical data. For each protein, values > 3 standard deviations from the median were rejected as extreme values. Plasma protein levels were compared between OPMD subgroups with and without limb weakness using unpaired 2-tailed Student's t-tests followed by correction for multiple comparisons using the Benjamini-Hochberg procedure with false discovery rate (q) set to 0.20. 27 Protein signals differing by more than 30% between groups (i.e., Limb Weakness/No Limb Weakness > 1.3 or < 0.769) and statistically significant P-values after correction for multiple comparisons were considered distinguishing. Comparisons of distinguishing proteins between OPMD subsets and the Control group were performed using one-way analysis of variance, followed by Fisher's least significant differences post-hoc testing when significant differences (α=0.05) were found. Comparisons of protein signals were performed within the OPMD cohort prior to comparisons with controls to enhance detection of proteins that differ between subsets of patients that differ based on limb weakness, and not necessarily from controls. For example, salivary microRNAs miR-485, miR-146b, and miR-200c have been found to be elevated in aged but not younger patients with OPMD in relation to controls. 28
Pathway and enriched ontology cluster analyses
Distinguishing proteins were examined for enriched pathways and gene ontology terms (GOTERMs) using two complementary online tools, the Metascape gene annotation and analysis online resource 29 (https://metascape.org/gp/index.html#/main/step1; accessed Jan 10, 2024), and the Database for Annotation, Visualization and Integrated Discovery (DAVID) bioinformatics resource (https://david.ncifcrf.gov/tools.jsp; accessed Jan 10, 2024). 30 The list of proteins was assessed using the express analysis option in Metascape, with only the default gene ontology terms selected. For DAVID, assessed functional annotations included UniProt Keywords (UP_KW) and GOTERMs for biological process, cellular component, and molecular function, as well as UniProt Tissue. Both Metascape and DAVID analyses were performed using homo sapiens as the background (a less conservative analysis) and again using the complete list of SOMAmer targets as the background (a more conservative analysis). Significantly (P < 0.05) enriched pathways and clusters are reported.
Correlational analyses between clinical, imaging, and proteomics
A subset of proteins that offered a high level of distinction between OPMD with limb weakness from OPMD without limb weakness and from Controls were selected for correlation analysis. Relationships between protein signal intensity and participant age, time with symptoms, and muscle FF were assessed using linear regression techniques. Pearson's r values were categorized as very strong (0.8 ≤ r ≤ 1.0), strong (0.6 ≤ r < 0.8), moderate (0.4 ≤ r < 0.6), weak (0.2 ≤ r < 0.4) and very weak (0 ≤ r < 0.2).
Results
Participant cohort
Twenty-five individuals with OPMD were recruited in this study (13 females and 12 males, mean age 63 ± 10.5 years, age range 40-76 years). All participants with OPMD had 13 GCN repeats in PABPN1, which is the most common variant in Canada. 2 All 25 participants with OPMD had blood drawn and assessed using plasma proteomics, and 17 had whole body quantitative MRI scans. The 10 Controls (8 females, 2 males) for proteome analysis had a mean age of 61.0 ± 9.3 years, ranging from 48-79 years old. The 5 Controls (3 females, 2 males) for MRI had a mean age of 55.8 ± 9.3 years, ranging from 37-72 years old.
Classifications of OPMD severity
Categorization of individuals with OPMD based on the presence versus absence of limb weakness also stratified participants based on their age and time with symptoms (Figure 1(b)). Those with limb weakness were >60 years of age and experienced their first symptoms of OPMD > 7 years earlier. Those without limb weakness were < 60 years of age and experienced their first symptoms of OPMD < 7 years earlier. Additionally, muscle MRI, available for 17 of the 25 participants, revealed significantly (P < 0.05) higher muscle fat fractions in those with limb weakness compared to those without limb weakness (Figure 1(c)). Participants with versus without limb weakness had non-overlapping ranges of the aggregate mean FF of soleus, adductor magnus, lumbar paraspinals, serratus anterior, and tongue (Figure 1(c)-(d); 11.7-27.6% fat without limb weakness versus 29.6-73.7% fat with limb weakness).
Proteome analysis
Plasma proteins were compared between participants with OPMD with and without limb weakness (Figure 2). Differences between subgroups based on P-value and fold change in signal are shown in Figure 2(a). After applying P-value (control for multiple comparisons using the Benjamini-Hochberg procedure with q = 0.2) and fold change (>30% difference in mean signal) cutoffs, 38 SOMAmers representing 36 unique proteins (listed in Figure 2(c)) were found to distinguish between subgroups. Two of the identified proteins (KLH41 and TG) were flagged by the manufacturer as having interpolated calibration factors outside the acceptable criteria (QC Ratio of 0.8−1.2), but in accordance with manufacturer recommendations, were not excluded from analysis. Additional quality control measures are listed in the Supplemental Text.
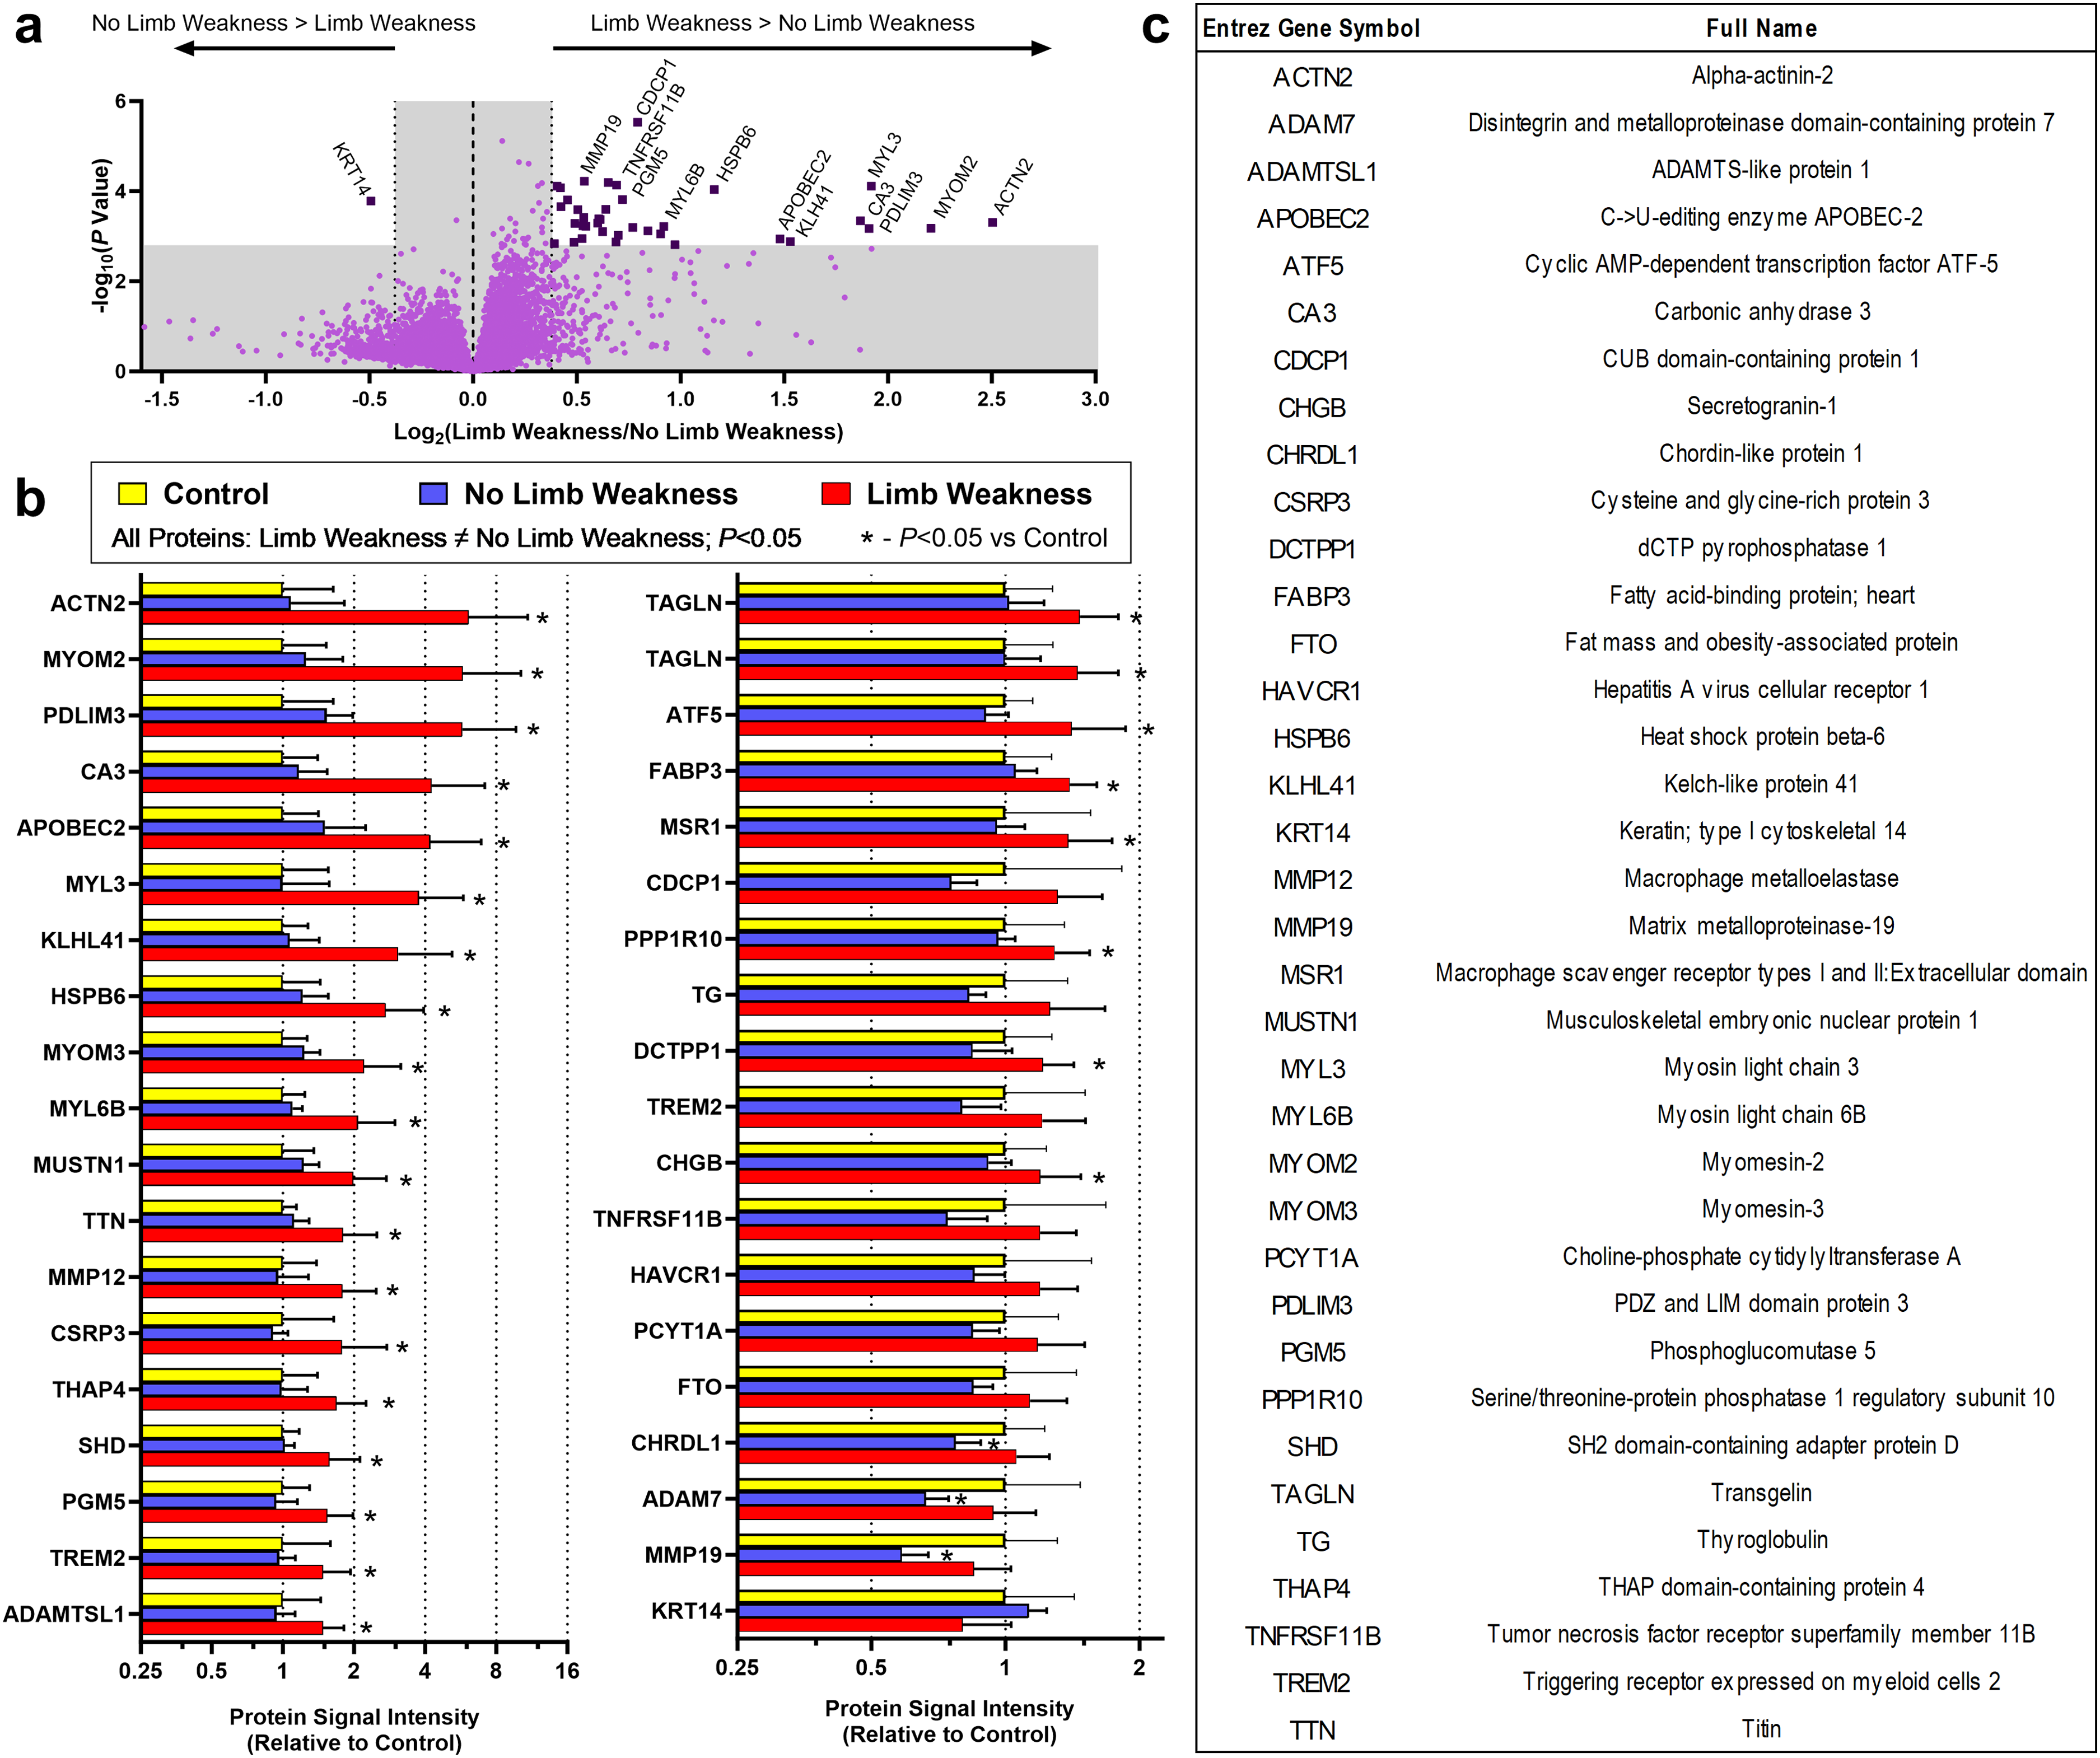
Plasma proteome analysis in participants with OPMD with versus without limb weakness.
Levels of distinguishing proteins detected in the SOMAScan assay were normalized to the mean of the proteome Control group, and then compared between OPMD subsets and the proteome Control group (Figure 2(b)). Considering only the 38 SOMAmer signals that distinguished participants with limb weakness from participants without limb weakness: (i) 27 SOMAmer signals (25 unique proteins) were significantly higher in participants with limb weakness than Controls; (ii) 11 SOMAmer signals (11 unique proteins) were not significantly different between participants with limb weakness and Controls; (iii) 3 SOMAmer signals (ADAM7, CHRDL1, and MMP19) were significantly lower in participants without limb weakness than Controls; (iv) 35 SOMAmer signals (33 unique proteins) were not significantly different between participants without limb weakness and Controls; (v) the Control group did not significantly differ from both OPMD subgroups simultaneously on any SOMAmer signal.
Functional enrichment analysis using the DAVID Bioinformatics webtool (Figure 3(a)) indicated that the GOTERMs best distinguishing OPMD with limb weakness from OPMD without limb weakness were associated with muscle proteins in plasma. Specifically, skeletal muscle, structural constituent of muscle, sarcomere organization, M band, muscle contraction, Z-disc, and muscle protein were significantly enriched when using homo sapiens as the background and when using the full list of SOMAmer targets as the background. Extracellular region and actin filament binding were significantly enriched on the homo sapiens background only.
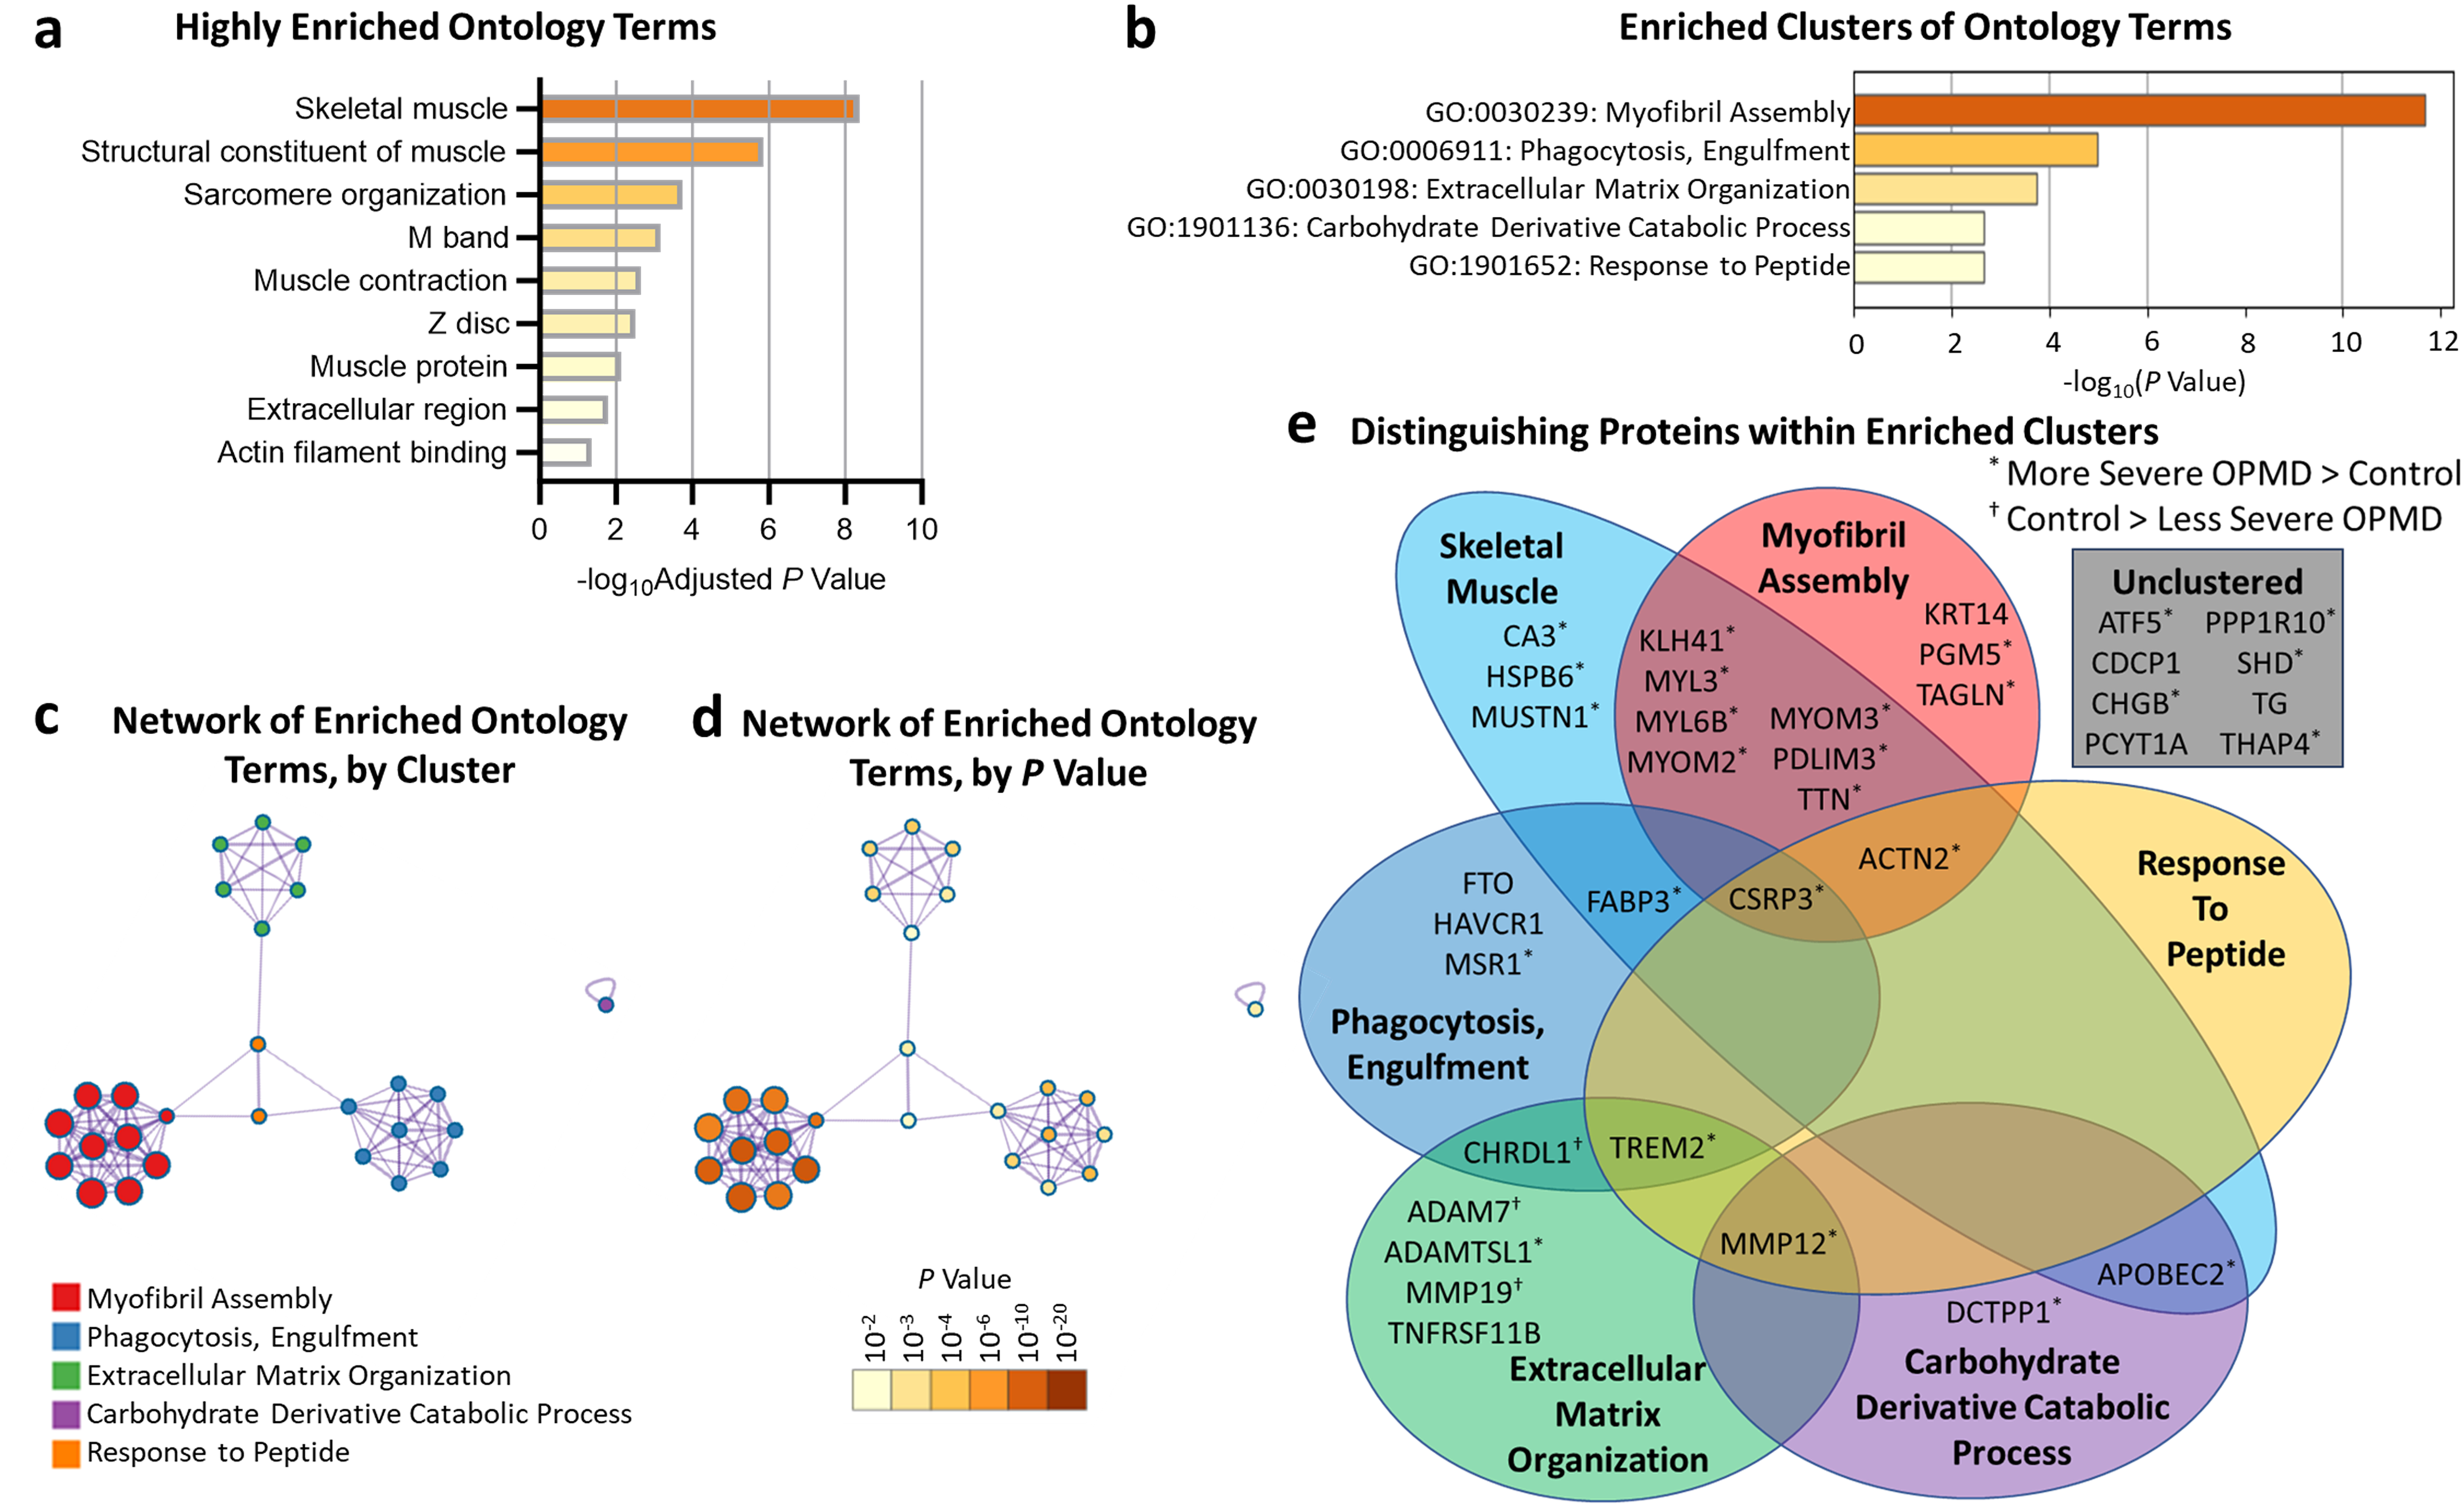
Pathway and gene ontology cluster enrichment analyses.
Metascape analysis of the 36 distinguishing proteins revealed five significantly enriched clusters of ontology terms: (i) Myofibril Assembly, (ii) Phagocytosis, Engulfment, (iii) Extracellular Matrix Organization, (iv) Carbohydrate Derivative Catabolic Process, and (v) Response to Peptide (Figure 3(b); i-iii were enriched on both backgrounds assessed, iv-v were enriched on the homo sapiens background only). Network diagrams depicting relationships between ontology terms within and between clusters, and corresponding P-values for enrichment are shown are shown in Figure 3(c)-(d) (note a truncation of the Myofibril Assembly cluster from 34 down to 10 enriched terms). The Venn diagram shown in Figure 3(e) depicts the membership of distinguishing proteins within each enriched cluster and identifies proteins with a UniProt_Tissue tag of skeletal muscle. Notably, the three proteins (ADAM7, MMP19, and CHRDL1) which were less abundant in participants without limb weakness than Controls all belonged to the Extracellular Matrix Organization ontology cluster.
Proteins with multiple SOMAmer probes
Eight of the 36 proteins distinguishing OPMD with limb weakness from OPMD without limb weakness were targeted by multiple SOMAmers. Three proteins had comparable results from different SOMAmers: TAGLN had 2 SOMAmers that yielded statistically significant differences; MYL6B had 2 SOMAmers, one was not statistically significant at raw P = 0.0006; TREM2 had 3 SOMAmers, 1 was not statistically significant at raw P = 0.0004. Five proteins had divergent results from different SOMAmers: ATF5 had 2 SOMAmers, one was not statistically significant at raw P = 0.84; MSR1 had 3 SOMAmers, 2 were not statistically significant at raw P = 0.94 and 0.46; FABP3 had 2 SOMAmers, one was not statistically significant at raw P = 0.64; ADAMTSL1 had 2 SOMAmers, one was not statistically significant at raw P = 0.65; CDCP1 had 3 SOMAmers, 2 were not statistically significant at raw P = 0.58 and 0.15. It is unclear why different SOMAmers targeting the same protein yielded different results in this study. In general, divergence between SOMAmers could reflect altered availability of protein epitopes via post-translational modification or competitive interference, single nucleotide polymorphisms, protein fragmentation, or statistical chance alone. With q = 0.2, the number of distinguishing proteins selected by chance alone should be no higher than seven out of 36 in this study.
Protein signal versus age, time with symptoms, and FF on muscle MRI
To explore the possibility that age could account for differences in distinguishing proteins, scatterplots of protein signal versus age were generated for 6 highly distinguishing proteins (ACTN2, MYOM2, CA3, APOBEC2, MYL3, and PDLIM3) using data from participants with OPMD and from the Control group (Figure 4). These 6 proteins were selected as they offered the greatest distinction between participants with/without limb weakness, and between participants with limb weakness and Controls. Though increases in distinguishing protein signal intensity were age-related in OPMD, corresponding increases were not observed in the proteome Control group. Higher variability in protein signal intensity was noted in the older participants with OPMD. Plots of protein signal versus muscle FF provide insight into the nature of this variability (Figure 5). Importantly, the relationships between protein signal and muscle MRI FF (for the full cohort of participants with OPMD) were stronger than those between protein signal and participant age and between protein signal and time with symptoms (Table 2), suggesting that the differences in distinguishing protein signal reflected differences in OPMD severity rather than participant age. Specifically, correlating protein signal with either participant age or time with symptoms yielded Pearson's r values which ranged from moderate to strong (range of 0.48-0.69) (Table 2). In contrast, correlating protein signals with muscle MRI FF yielded Pearson's r values that were moderate to very strong (range of 0.69–0.80) when considering the average of the 5 muscles, strong (range of 0.67–0.76) for the adductor magnus alone and very strong (0.82–0.93) for the soleus alone (Table 2, Figure 5). Lower Pearson's r values were observed when correlating protein signals with the individual FFs of tongue, lumbar paraspinals, and serratus anterior muscles (listed in Table 2). Age-related increases in muscle fat fraction were not observed in the MRI Control group (Figure 1(d)). Retrospectively converting MRI FF to 4-point Mercuri ratings (1 = 0 - < 12%, 2 = 12 - < 30%, 3 = 30 - < 60%, 4 = 60–100%), soleus and adductor magnus muscles retained their correlational strength ratings with ACTN2, MYOM2, CA3, APOBEC2, MYL3, and PDLIM3.
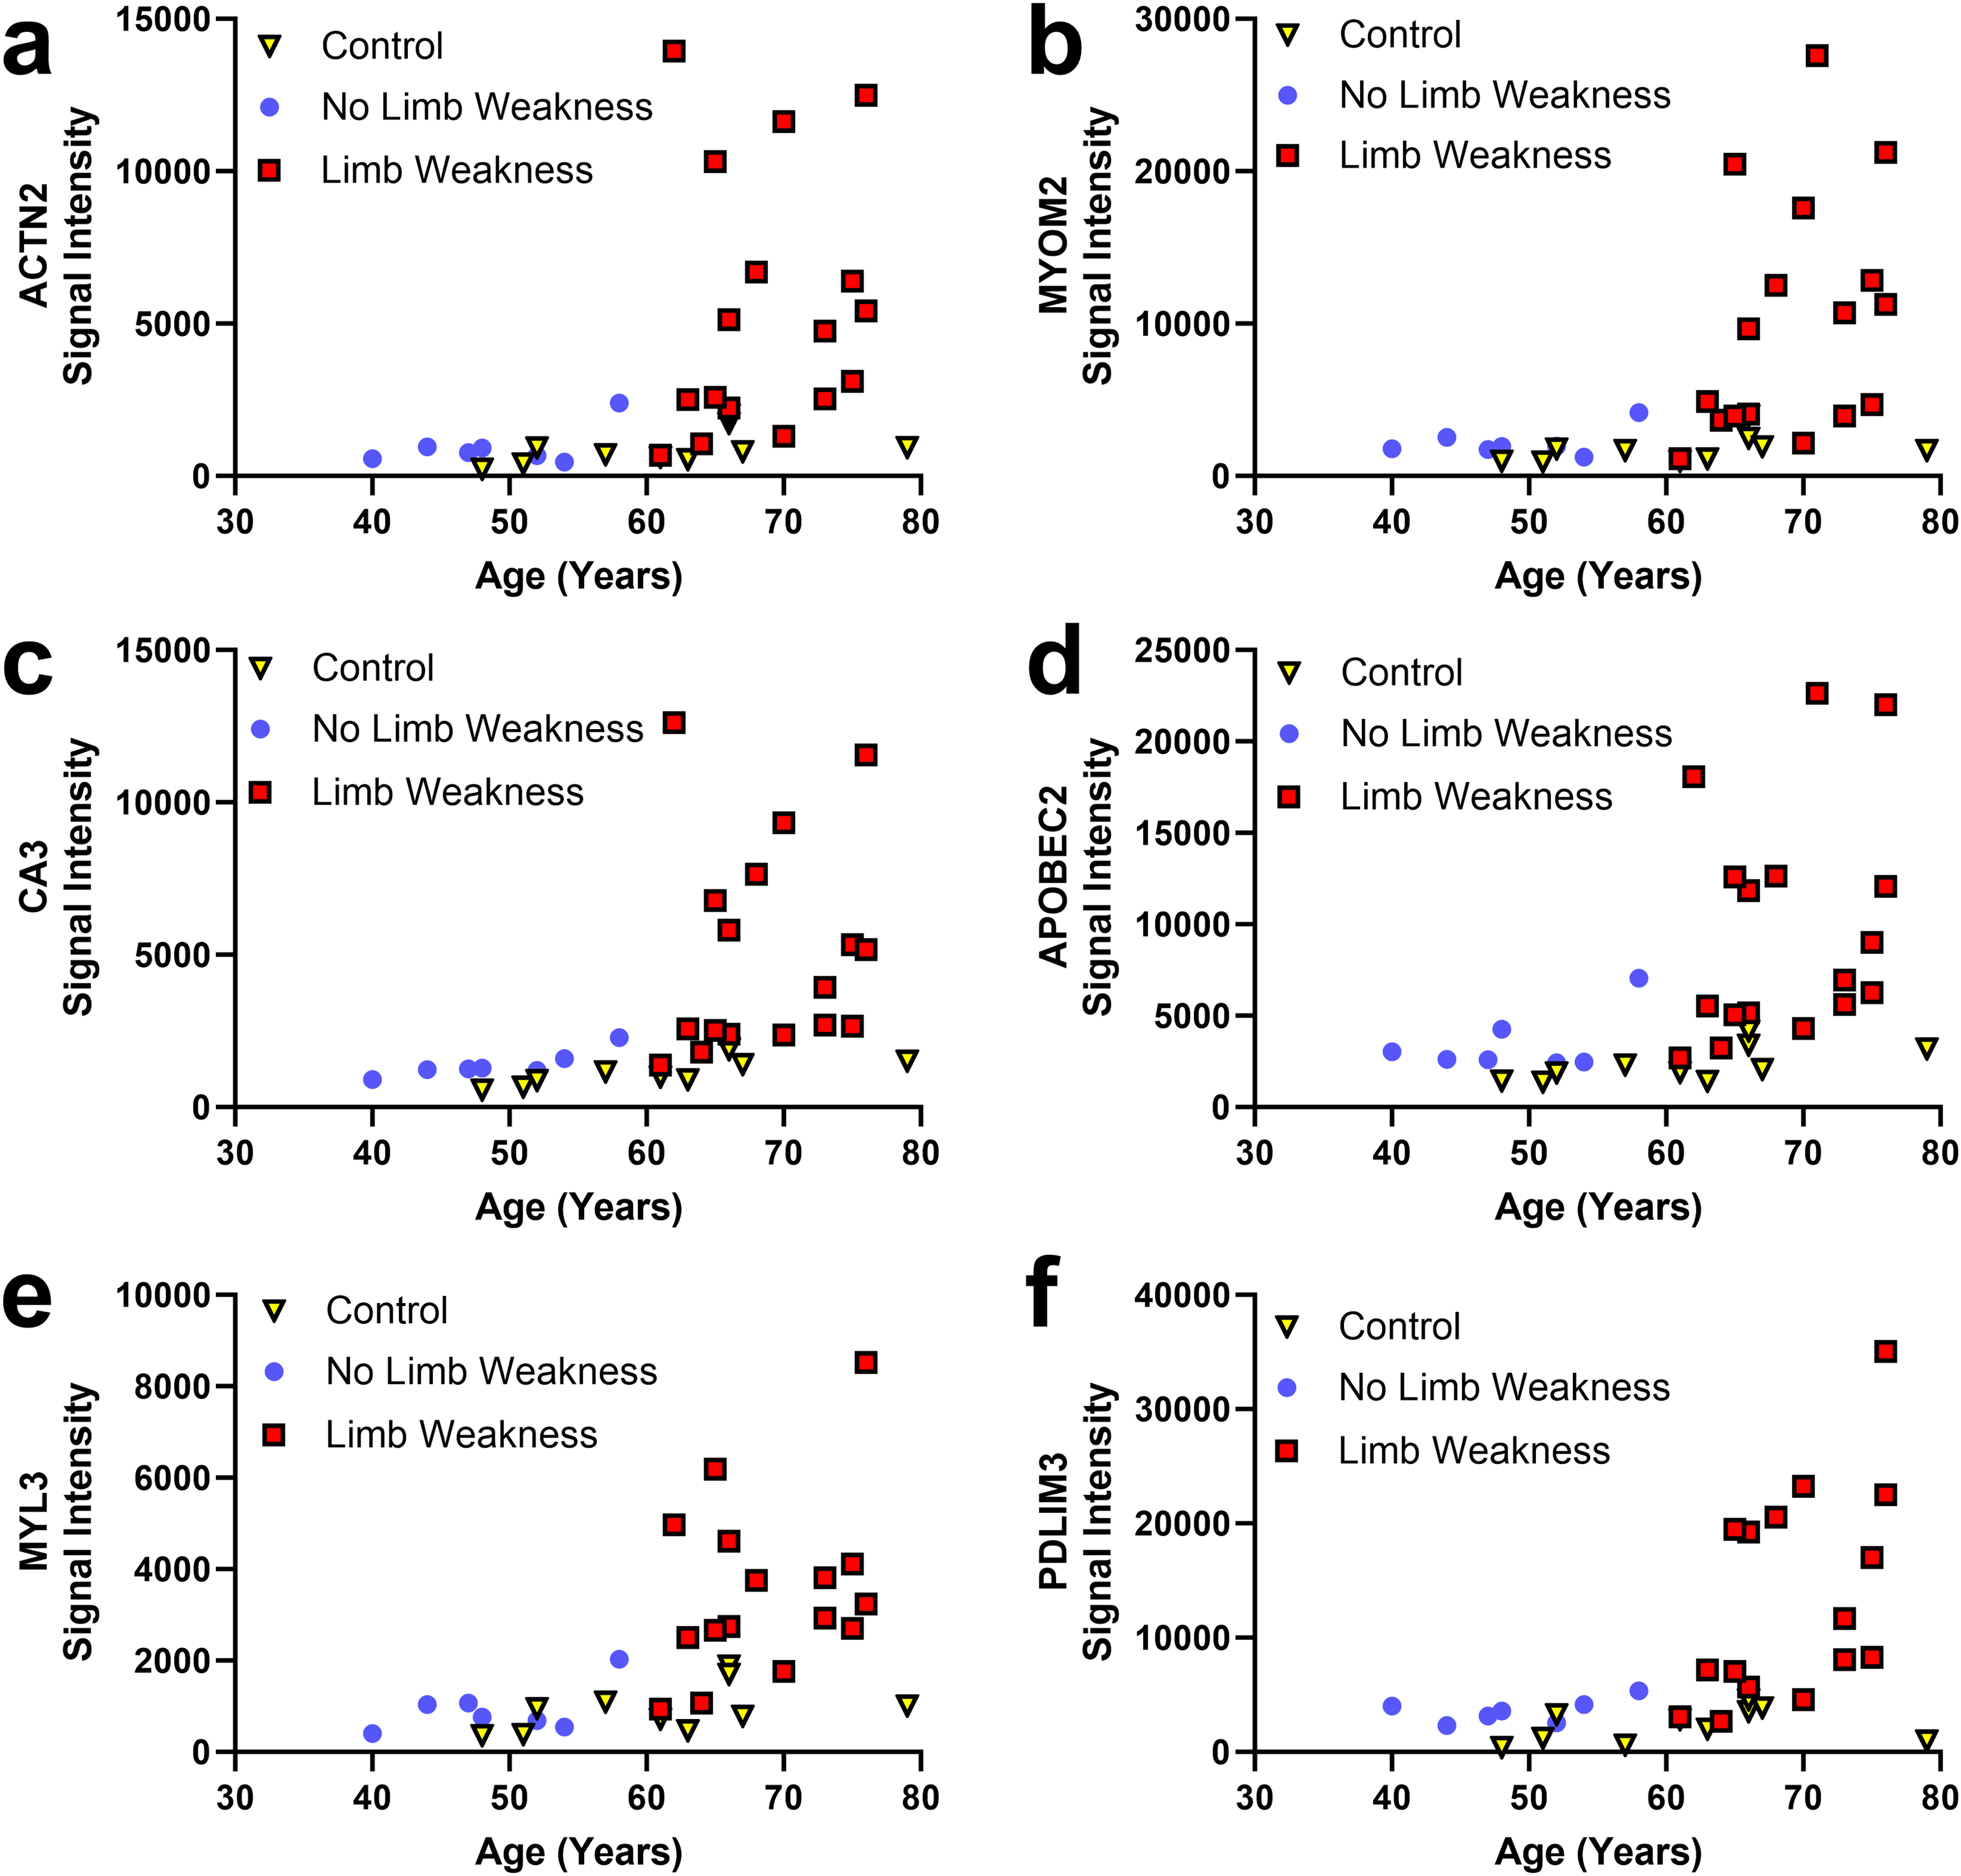
Scatterplots of protein signal intensity for highly distinguishing proteins versus age of participants with OPMD (with and without limb weakness) and of controls.
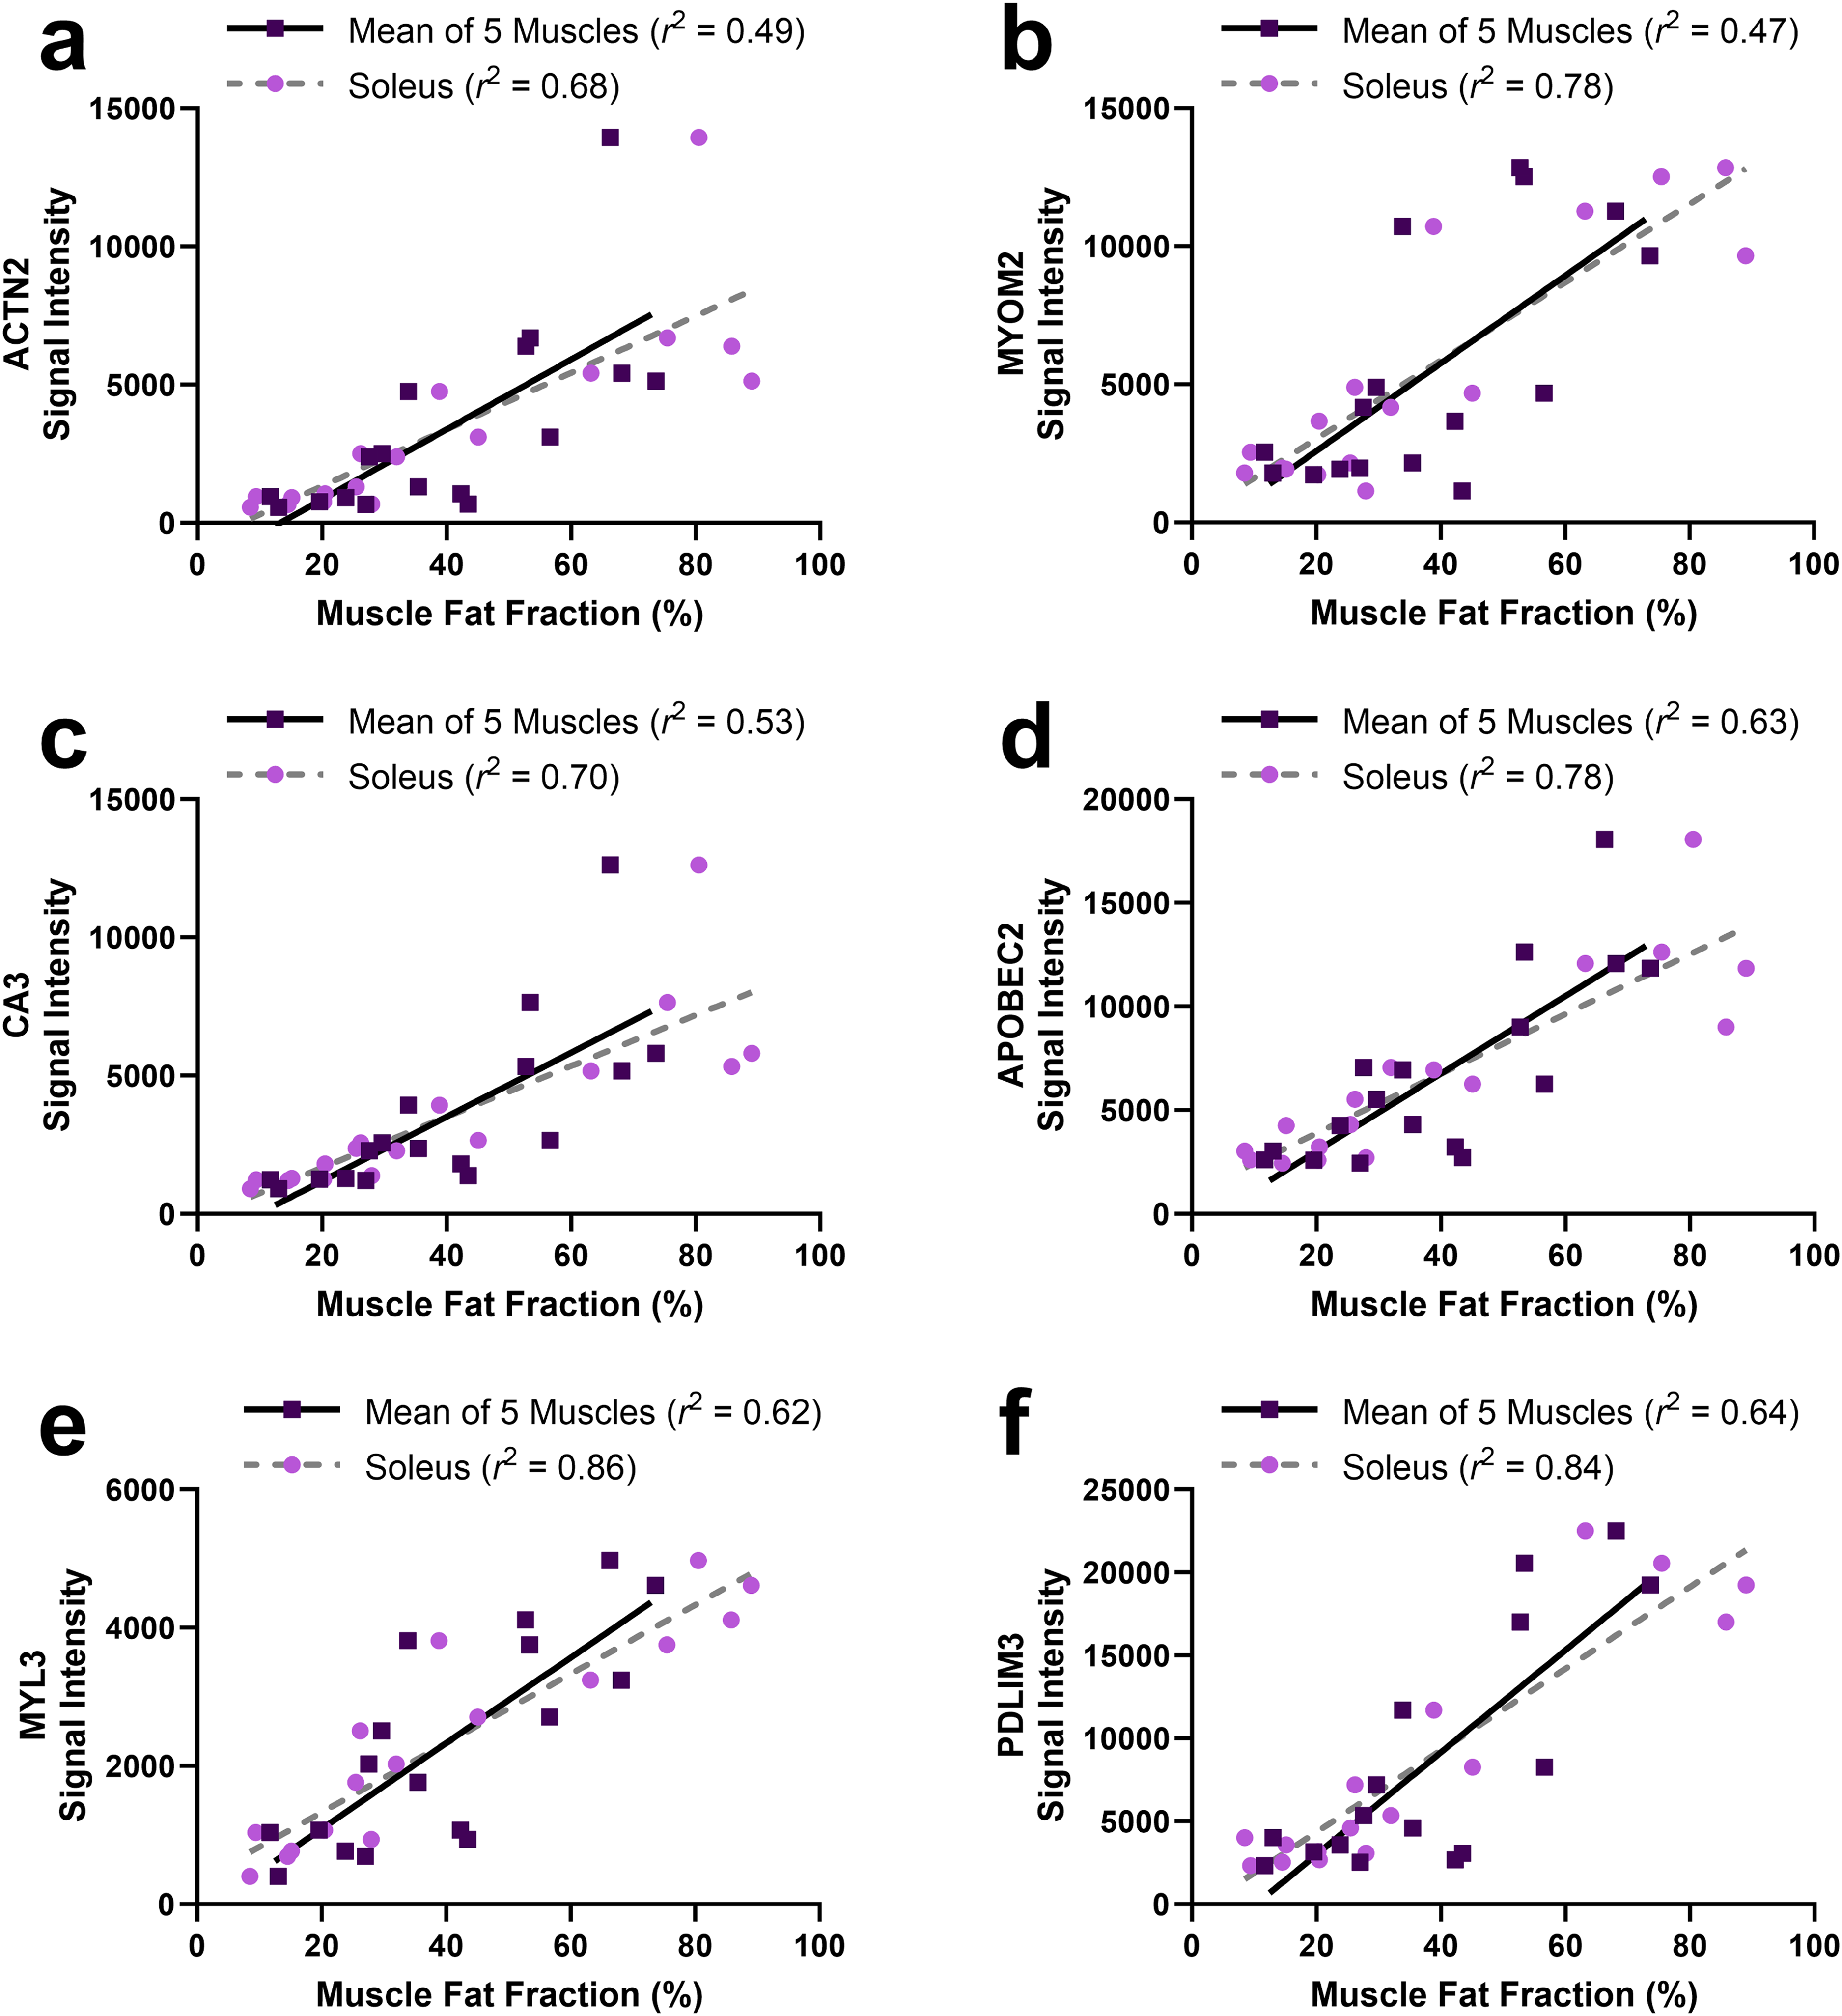
Scatterplots of protein signal intensity for highly distinguishing proteins versus muscle fat fraction in participants with OPMD. Muscle MRI FF values are shown for soleus alone, and for the mean of tongue, serratus anterior, lumbar paraspinals, adductor magnus, and soleus. Fits by linear regression are shown.
Correlations (Pearson's r) between plasma protein signal intensity and characteristics of participants with OPMD.
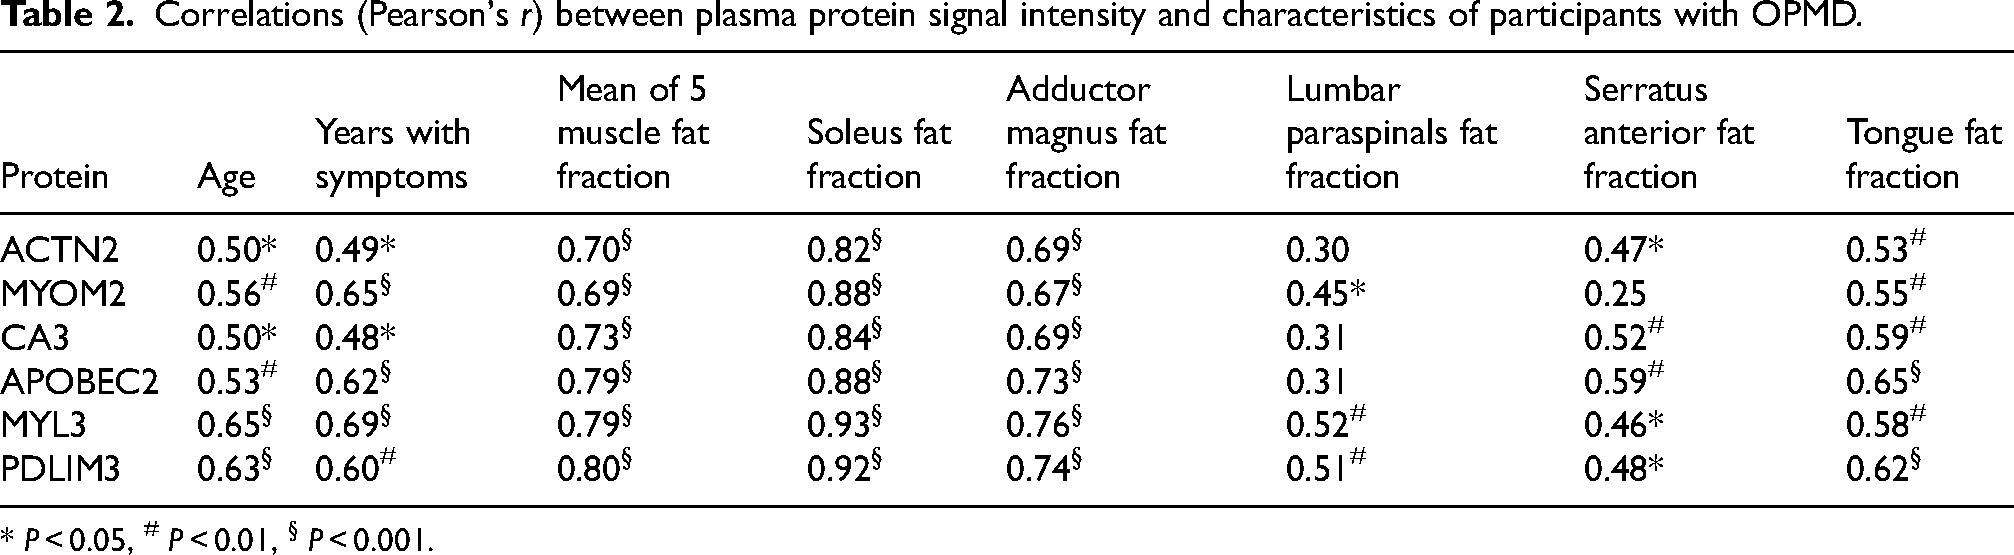
* P < 0.05, # P < 0.01, § P < 0.001.
Screening the proteome using soleus FF in MRI
At initiation of this study, it was unclear how, or if, muscle FF from MRI might track with overall disease severity in OPMD. The exceptionally high correlations observed between soleus FF and signal intensity for the highly distinguishing proteins provided us with sufficient guidance and justification to explore muscle FF as a continuous screening tool for circulating biomarkers using this dataset. Muscle FFs were correlated (Pearson's r) with each of the 7289 SOMAmer signals. After correction for multiple comparisons (Benjamini-Hochberg procedure with q = 0.2), the soleus FF was found to be significantly correlated with 46 SOMAmer protein signals (Figure 6(a)). All 46 significant correlations had a positive Pearson's r value. In contrast, few proteins were significantly correlated with the FF of other muscles assessed (8 with the mean FF of 5 muscles, 2 with the adductor magnus FF, 1 with the lumbar paraspinals FF, 1 with the serratus anterior FF, and 0 with the tongue FF). Eighteen out of 46 proteins identified using soleus FF as the proteome screening variable were also identified when limb weakness was used as the screening variable (Figure 6(b)-(c)). The list of distinguishing proteins identified using soleus FF were entered into Metascape using homo sapiens as the background. Significantly enriched ontology clusters included Myofibril Assembly (P = 10−17), Striated Muscle Contraction (P = 10−15), Muscle Contraction (P = 10−12), Carbohydrate Biosynthetic Process (P = 10−4), Response to Calcium Ion (P = 10−4), and Organophosphate Biosynthetic Process (P = 10−2). Results were comparable when the Metascape analysis was re-run using the list of SOMAmer targets as the background.
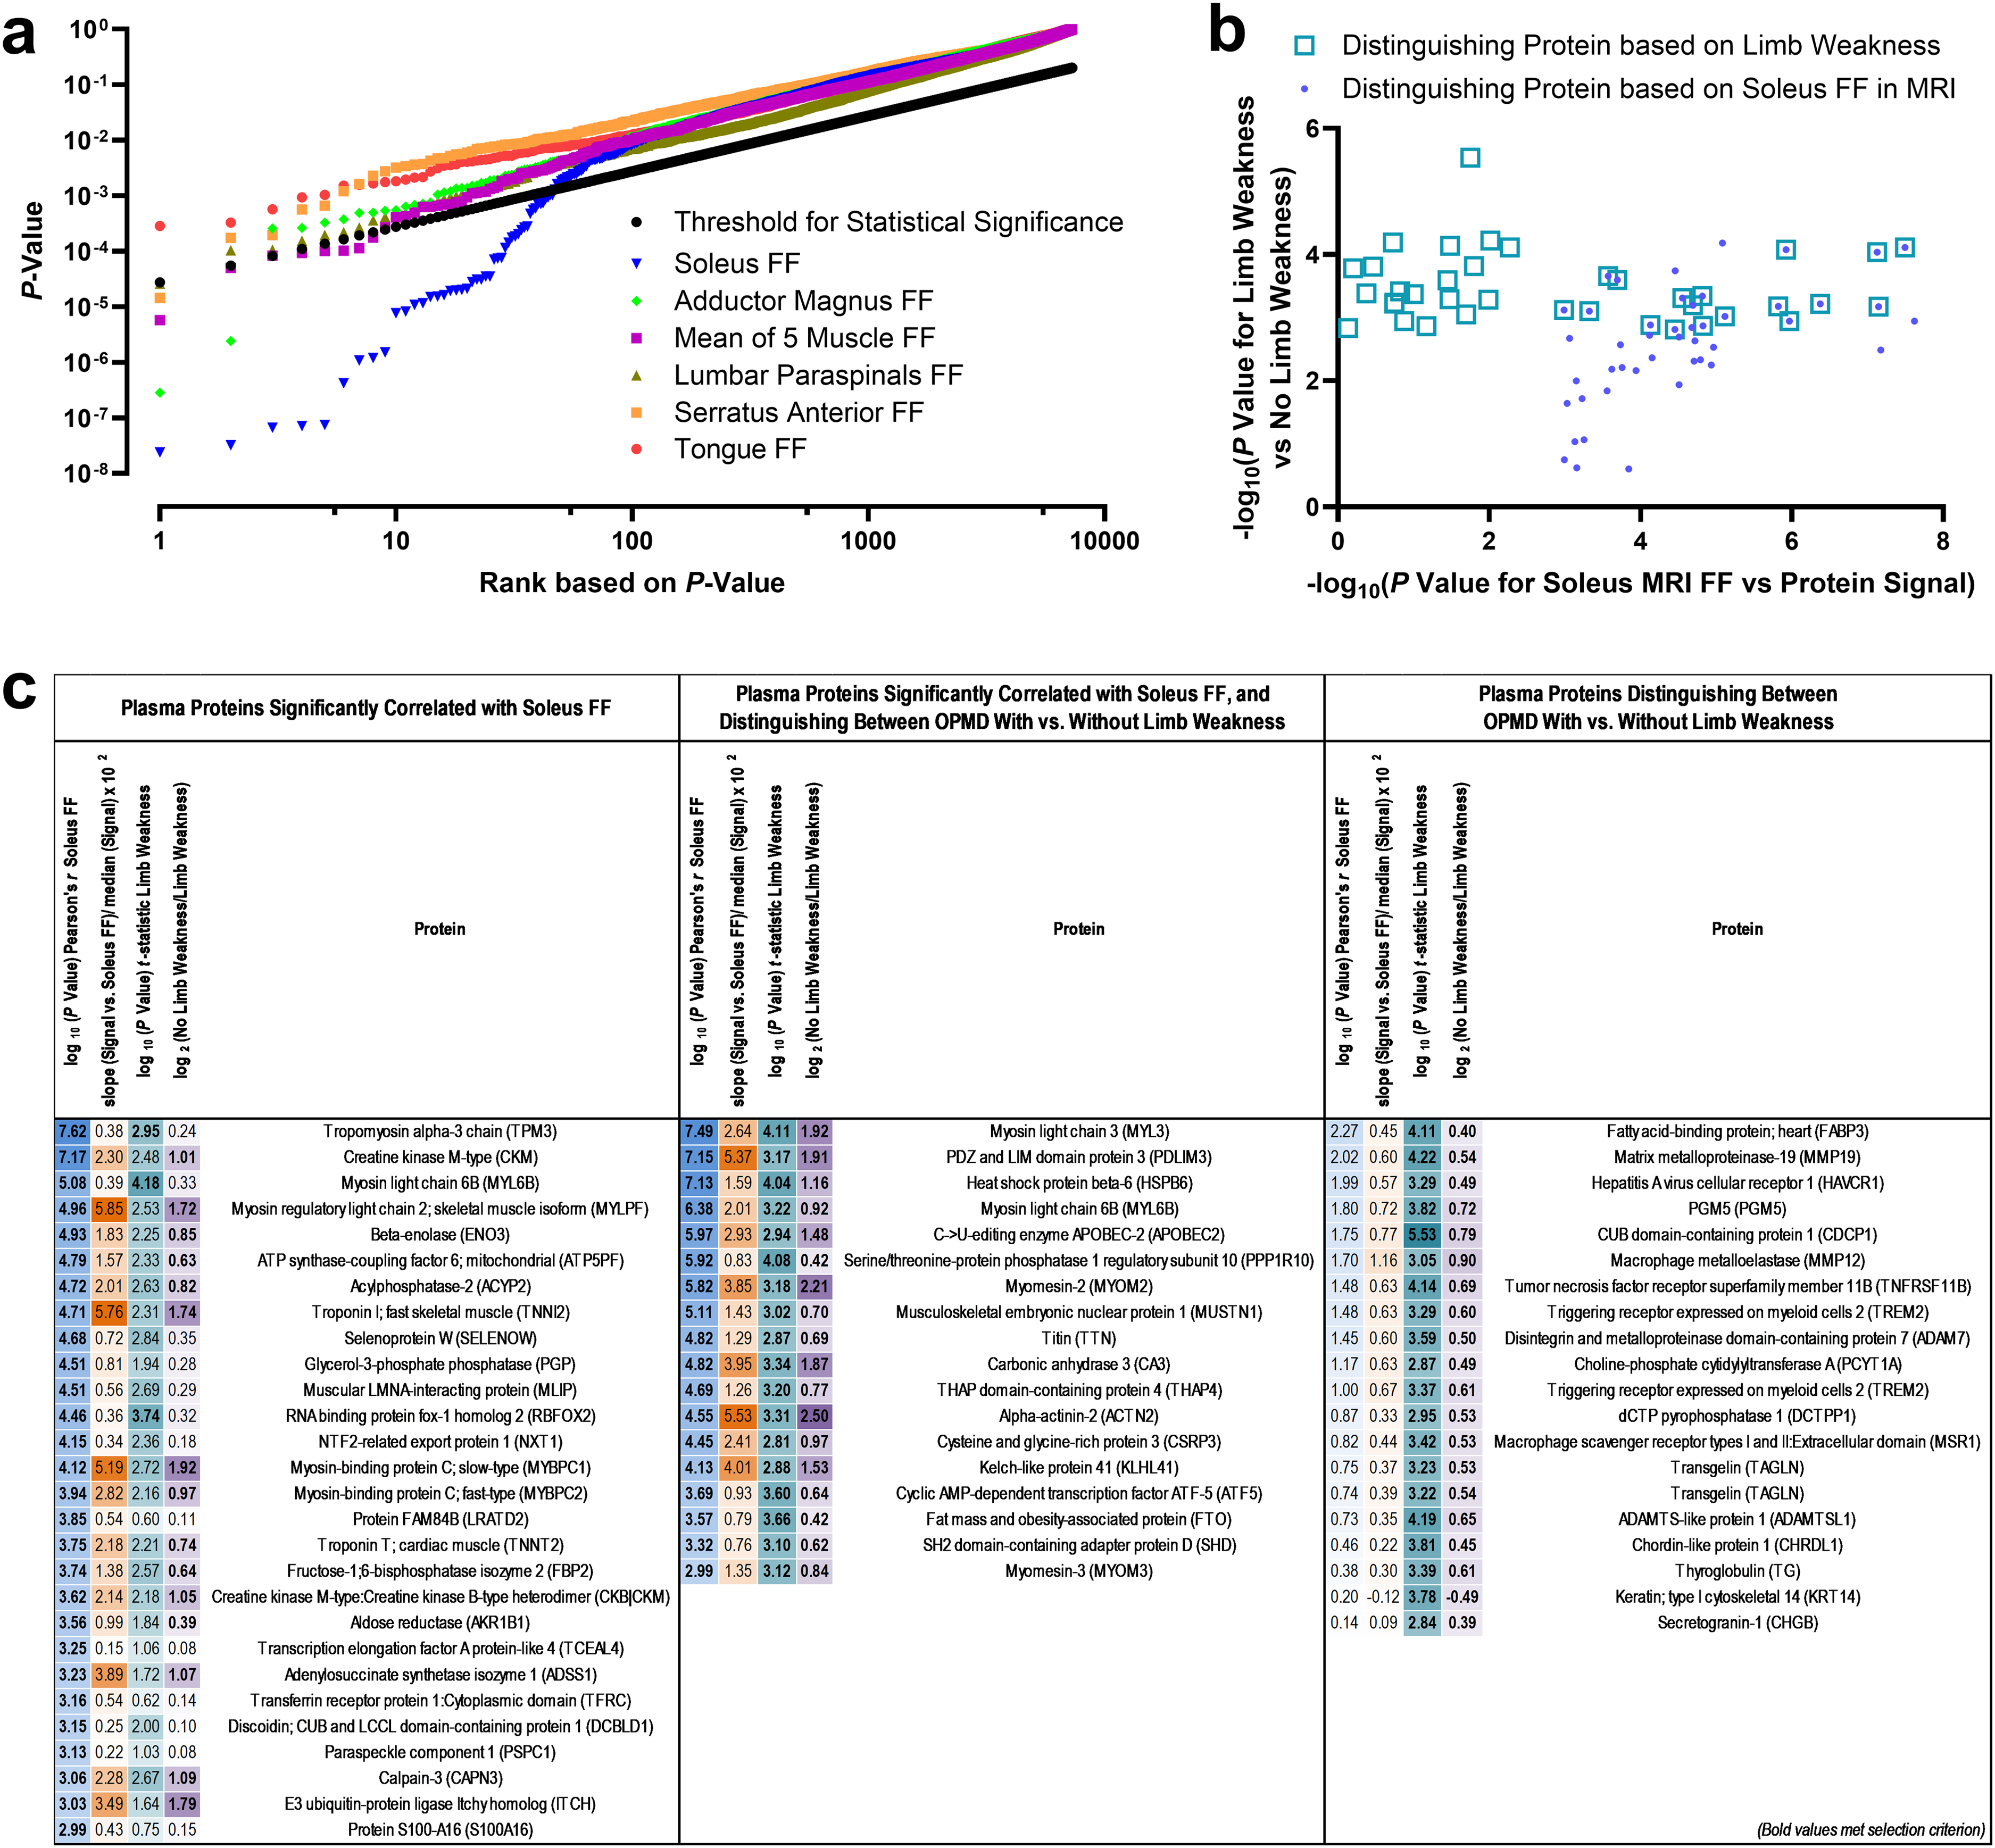
Plasma proteome data from the SOMAScan assay screened using muscle fat fraction (FF) in MRI as the indicator of OPMD severity.
Discussion
For many slowly progressive neuromuscular disorders, there is a need for easily accessible, reliable, and non-invasive biomarkers. This study identified 6 skeletal muscle proteins in plasma that (i) distinguish participants exhibiting more versus less advanced signs of OPMD (i.e., presence versus absence of proximal limb weakness) and (ii) correlate strongly with muscle fat fraction in MRI, particularly the soleus muscle. Even with a small sample size, these results support a longitudinal study to assess circulating biomarkers for OPMD progression, and advocate for the use of muscle MRI in monitoring progression and severity of OPMD.
Since OPMD is a progressive disorder, symptom severity is inextricably linked to increasing participant age and time with symptoms. Several attempts were made to accommodate the limitation posed by differences in age and time with symptoms. First, protein probes were filtered using a categorical variable of limb weakness. The 6 proteins (ACTN2, MYOM2, CA3, APOBEC2, MYL3, and PDLIM3) identified as most distinguishing were plotted in relation to the continuous variables of participant age (with a Control group), time with OPMD symptoms, and FF in muscle MRI. Importantly, age-related increases in protein signal were not observed in the Control group, and distinguishing proteins had stronger correlations with muscle FF (soleus and adductor magnus in particular) than with participant age or time with symptoms of OPMD. As such, identified differences in plasma protein signals likely reflect underlying disease processes rather than the demographic characteristics of the cohort. The established impact of PABPN1 GCN copy number on age of symptom onset and rate of symptom progression in OPMD1,8 was controlled in this study by including only participants with GCN copy number of 13. Due to the rarity of OPMD, multicenter collaboration is needed to provide sufficient participant numbers for a longitudinal study aiming to identify factors influencing the rate of OPMD progression in individuals with the same alanine expansion in PABPN1.
The three plasma proteins (ADAM7, MMP-19, and CHRDL1) diminished in the less-affected OPMD subgroup compared to Controls and the more-affected OPMD subgroup were all components of the Extracellular Matrix Organization GO cluster. Alanine-expanded PABPN1 has been previously linked to dysregulation of extracellular matrix and collagen-encoding genes in the muscle transcriptome. 31 The potential for indicators of extracellular matrix dysregulation to serve as an indicators of disease processes in less-affected cases of OPMD should be pursued in future studies.
Blood biomarkers are valuable outcome measures as they are convenient to obtain and generally rapid to assess. Pathway analysis revealed that skeletal muscle proteins in the blood were predominant in distinguishing individuals based on severity of OPMD. Elevated concentrations of skeletal muscle proteins are frequently observed in myopathies,20,32 and may reflect enhanced rates of myodegeneration, enrichment of select proteins within the muscle, or enhanced release of cellular components, such as in response to metabolic disturbance.20,33 Involvement of both fast and slow muscle fibres is implicated by the elevated signals of MYL3, MYL6B, PGM5, and MYOM3 (associated with myosin heavy chain 1 34 ), ENO3, APOBEC2, CKM, FBP2, MYLPF2, TNNI2, and MYBPC2 (associated with myosin heavy chains 2a and 2x 34 ), and CSRP3 and HSPBP6 (associated with myosin heavy chains 1 and 2a 34 ) in participants with severe presentations of OPMD. Although some mitochondrial abnormalities35–37 and dysregulation of the ubiquitin proteasome38,39 have identified importance in OPMD, these features were not revealed by plasma proteomics to distinguish between OPMD subgroups defined by limb muscle weakness. The present results are not necessarily in conflict with previous reports. As we did not select proteins based on differences between Control and OPMD, stable features of the OPMD proteome would not have been identified. Examples of stable indicators for OPMD include the alanine expansion number in PABPN1 and intranuclear inclusions in muscle cells. 40 Alternatively, changes to mitochondrial function and the ubiquitin proteasome may be tissue specific, comparable to the muscle specific reductions in PABPN1 content observed in OPMD. 41 The nature of the changes to mitochondrial function and the ubiquitin proteasome in OPMD warrant further investigation in a future study.
Six circulating skeletal muscle proteins (ACTN2, MYOM2, CA3, APOBEC2, MYL3, and PDLIM3) were identified as candidates for further exploration as potential biomarkers of OPMD severity, progression, prognosis, and response to future treatment. Previous work identified CA3 and MYOM2 as plasma biomarkers for Duchenne muscular dystrophy (DMD).20,42–44 Likewise, CA3 and MYL3 were identified as plasma biomarkers of clinical progression in DMD, however, unlike the present results, plasma CA3 and MYL3 declined with age in children and teens with DMD, corresponding to reduced ambulatory ability and/or reduced muscle mass.43,44 While an elevated presence of a particular skeletal muscle protein in blood is not necessarily indicative of altered expression levels within the muscle, it is notable that elevated PDLIM3 has been found in muscles from a porcine model of DMD, and ACTN2 and MYOM2 are overexpressed in muscle from individuals with Becker muscular dystrophy. 45 APOBEC2 has not been previously identified in biomarker discovery studies for muscular disease but is necessary for normal muscle development and muscle fiber type regulation and is a negative regulator of myoblast differentiation in regenerating muscle.46,47 Moreover, elevated APOBEC2 and CA3 levels have been implicated in muscle aging and senescence.48,49
From the 36 proteins distinguishing OPMD subgroups based on limb weakness, 26 distinguished between OPMD with limb weakness and Controls, and 3 distinguished between OPMD without limb weakness and controls. Discrepancy in the number of proteins that distinguish mild and severe OPMD presentations from controls is comparable to that seen when blood proteomes were examined in Becker muscular dystrophy (13 probes distinguished from controls) and Duchenne muscular dystrophy (285 probes distinguished from controls). 50 Several proteins (e.g., TNNI2, CA3, MYBPC1, CKM/CKB) distinguishing Duchenne from Becker muscular dystrophy 50 overlap with proteins distinguishing severe from mild presentations of OPMD in the present study. These findings highlight the importance of considering the level of clinical severity (including presymptomatic individuals) and rate of change in severity in the assessment of circulating biomarkers. Differences in detection sensitivity for plasma proteins may be related to differences in the total mass of muscle undergoing degenerative changes in mild OPMD compared to more severe presentations of OPMD. MRI observations offer indirect support for this speculation, as fatty infiltration is typically concentrated to small oropharyngeal muscles (e.g., tongue) in milder presentations of OPMD, whereas the list of muscles (e.g., soleus, adductor magnus, gluteus medius) exhibiting fatty infiltration is expanded in more severe presentations of OPMD. 14
Longitudinal assessment of muscle fat fraction using MRI has been established as a sensitive method of assessing progression of OPMD, 51 facioscapulohumeral muscular dystrophy, 52 and myotonic dystrophy. 53 Though whole-body MRI was used, this study assessed FF in five muscles previously shown to be highly involved in OPMD at one anatomic level.14,15 The FFs of these muscles were significantly correlated with signals of the 6 proteins best-distinguishing between more and less severe cases of OPMD. This observation suggests that full body MRI studies may not be necessary for monitoring of OPMD, and targeted protocols of specific regions may be more efficient, but this will require increased sample size, longer longitudinal follow up, and increased analytic power to assess and optimize. Consistent with previous work identifying the adductor magnus and soleus muscles as sensitive imaging indicators for OPMD,14,15,51 correlations between FF and plasma proteins were higher in adductor magnus and soleus than the other muscles assessed in the present study. There is value in identifying a sentinel muscle for OPMD in the lower limbs as it would enable feet-first MRI, which has a 90% lower rate of claustrophobia reactions compared to head-first MRI, 18 and allow the head and torso to be propped, thereby diminishing symptoms of positional dysphagia. 16 Why the soleus and adductor magnus had higher correlations with plasma levels of distinguishing proteins is not clear, but is consistent with reports that soleus and adductor magnus muscles feature high FF,15,51 high variability in FF, 51 and high correlations between semiquantitative and quantitative assessments of FF 15 in relation to other muscles in OPMD. We speculate that both technical (e.g., ease of segmentation) and biological factors (e.g., muscle size, intramuscular content/distribution of connective tissue, disease-specific processes of fatty infiltration) might contribute to a higher signal to noise ratio in these muscles.
While our study has several strengths, an important limitation is that this was a pilot-level study rather than a definitive analysis. Although the small number of individuals assessed in this study still permitted identification of the most highly distinguishing proteins, increasing the sample size would permit greater sensitivity to detect proteins and pathways involved in the disease process. At this stage of analysis, our results are largely descriptive and hypothesis generating rather than conclusively establishing links between specific proteome expression and underlying pathophysiology of OPMD. This is an important first step and larger cohorts will help identify optimal drug targets to definitively establish the mechanisms associated with underlying pathological development. OPMD does not have well-defined stages, and disease progression is slow and heterogeneous.8,10,54 The definitions of OPMD severity used in this study were related to markers of disease progression in limb muscle (e.g., increased fat fraction in the limb muscles, limb weakness), which typically manifest after issues with ptosis and dysphagia arise. As such, the proteins and pathways identified here may be characteristic of past/present muscle wasting in OPMD. Use of a different measure of OPMD severity may have yielded different protein results. As an example, subgroups of OPMD patients defined by severity of dysphagia symptoms may have plasma proteomes which reflect differences in nutritional status and/or caloric intake. The utility of omics data can be improved if it is assessed in association with layered clinical data that can help assign meaning to observed heterogeneities, thereby assisting in the identification of useful signatures of disease processes and symptoms which may be unique to OPMD and the underlying adenine expansion of PABPN1, or common to NMDs and/or muscle wasting conditions. The reliability and sensitivity to detect plasma protein alterations will need to be assessed as part of a longitudinal analysis aiming to identify proteins that can serve as a prognostic and therapeutic biomarker of OPMD progression and response to treatment. Finally, plasma-derived biomarkers identified using aptamers should be verified using additional methodologies (e.g., Western Blot) as a check against known limitations of the technique, such as cross-reactivity, sequence variations, non-specificity, protein complex formation, and batch effects. 55
In conclusion, individuals with OPMD who exhibit limb weakness have a proteomic signature that distinguishes them from individuals with OPMD who do not exhibit limb weakness and from age-matched Controls. These findings highlight the availability of circulating biomarkers for assessing OPMD severity, which may be leveraged in future biomarker discovery studies assessing OPMD progression, prognosis, and response to treatment. Further research is required with larger sample size and larger number of measured proteins to confirm and add additional mechanistic insights, including identification of proteome signatures of OPMD in general and of OPMD/NMD subgroups relatable by clinical or demographic characteristics. Whole body muscle MRI is recommended as a sensitive and objective indicator of OPMD severity to complement biomarker discovery studies.
Supplemental Material
sj-adat-1-jnd-10.1177_22143602241304990 - Supplemental material for Plasma-derived protein and imaging biomarkers distinguish disease severity in oculopharyngeal muscular dystrophy
Supplemental material, sj-adat-1-jnd-10.1177_22143602241304990 for Plasma-derived protein and imaging biomarkers distinguish disease severity in oculopharyngeal muscular dystrophy by Ian C Smith, Marcos L Sampaio, Gerd Melkus, Kaitlynn Meier-Ross, Shaoni Chakraborty, Cameron Stotts, Pierre R Bourque, Hanns Lochmuller, Bernard Brais, Othmane Ayoub, Theodore J Perkins, Mireille Khacho and Jodi Warman-Chardon in Journal of Neuromuscular Diseases
Supplemental Material
sj-adat-2-jnd-10.1177_22143602241304990 - Supplemental material for Plasma-derived protein and imaging biomarkers distinguish disease severity in oculopharyngeal muscular dystrophy
Supplemental material, sj-adat-2-jnd-10.1177_22143602241304990 for Plasma-derived protein and imaging biomarkers distinguish disease severity in oculopharyngeal muscular dystrophy by Ian C Smith, Marcos L Sampaio, Gerd Melkus, Kaitlynn Meier-Ross, Shaoni Chakraborty, Cameron Stotts, Pierre R Bourque, Hanns Lochmuller, Bernard Brais, Othmane Ayoub, Theodore J Perkins, Mireille Khacho and Jodi Warman-Chardon in Journal of Neuromuscular Diseases
Supplemental Material
sj-xlsx-3-jnd-10.1177_22143602241304990 - Supplemental material for Plasma-derived protein and imaging biomarkers distinguish disease severity in oculopharyngeal muscular dystrophy
Supplemental material, sj-xlsx-3-jnd-10.1177_22143602241304990 for Plasma-derived protein and imaging biomarkers distinguish disease severity in oculopharyngeal muscular dystrophy by Ian C Smith, Marcos L Sampaio, Gerd Melkus, Kaitlynn Meier-Ross, Shaoni Chakraborty, Cameron Stotts, Pierre R Bourque, Hanns Lochmuller, Bernard Brais, Othmane Ayoub, Theodore J Perkins, Mireille Khacho and Jodi Warman-Chardon in Journal of Neuromuscular Diseases
Footnotes
Abbreviations
Acknowledgements
We would sincerely like to thank all of the individuals living with OPMD who participated in this study and for Muscular Dystrophy Canada for supporting this research (outlined below). We would also like to thank Dr Robin J. Parks of the Ottawa Hospital Research Institute for his helpful comments on this manuscript.
Ethics statement
All protocols and procedures were approved by the Ottawa Health Science Network Research Ethics Board.
Authors’ contributions
Initial study design: ICS, JWC, MK, and TJP.
Imaging segmentation and verification of underlying data: MS, GM, KMR, CS, JWC.
Collection of clinical data: JWC, SC, and ICS.
Data integration and analyses: ICS and OA.
Guidance/review of proteome and integrated analyses: MK, TJP, and JWC.
Initial manuscript drafting: ICS and JWC.
Final study design, data interpretation, editing manuscript for scientific content: All co-authors.
Review and approval of the final version of the manuscript: All co-authors.
Funding
The authors disclosed receipt of the following financial support for the research, authorship, and/or publication of this article: ICS is supported by the Eric Poulin ALS Translational Research Fund. MLS is supported by the University of Ottawa Department of Radiology by a research protected time award. KMR is supported by the University of Ottawa Medical Student Summer Research Program. HL receives support from the Canadian Institutes of Health Research (CIHR) for Foundation Grant FDN-167281 (Precision Health for Neuromuscular Diseases), Transnational Team Grant ERT-174211 (ProDGNE) and Network Grant OR2-189333 (NMD4C), from the Canada Foundation for Innovation (CFI-JELF 38412), the Canada Research Chairs program (Canada Research Chair in Neuromuscular Genomics and Health, 950-232279), the European Commission (Grant # 101080249) and the Canada Research Coordinating Committee New Frontiers in Research Fund (NFRFG-2022-00033) for SIMPATHIC, and from the Government of Canada Canada First Research Excellence Fund (CFREF) for the Brain-Heart Interconnectome (CFREF-2022-00007). TJP is supported by a grant from the Natural Sciences and Engineering Research Council of Canada (RGPIN/06604-2019). MK is supported by funds from Canadian Institutes of Health Research Project Grant, and Canada Research Chair Tier 2, as well as a Translation Research Grant from the uOttawa Faculty of Medicine awarded to both MK and JWC. JWC is supported by a Department of Medicine University of Ottawa Clinical Research Chair and by grants from the Canadian Institutes of Health Research (INS-464765), Physician Services Incorporated (19-28) and Muscular Dystrophy Canada (932196). The funders had no involvement in the study design, data collection, data analysis, data interpretation, writing of the report, or decision to submit the paper for publication.
Declaration of conflicting interests
Dr Hanns Lochmuller is an Editorial Board Member of this journal, but was not involved in the peer-review process nor had access to any information regarding its peer-review.
Availability of data and materials
All data generated or analysed during this study are included in this published article and its supplementary information files.
Supplemental material
Supplemental material for this article is available online.
References
Supplementary Material
Please find the following supplemental material available below.
For Open Access articles published under a Creative Commons License, all supplemental material carries the same license as the article it is associated with.
For non-Open Access articles published, all supplemental material carries a non-exclusive license, and permission requests for re-use of supplemental material or any part of supplemental material shall be sent directly to the copyright owner as specified in the copyright notice associated with the article.