



Abstract
Background:
Little is known about the longitudinal trajectories of novel neurodegenerative biomarkers including neurofilament light (NfL), tau, and glial fibrillary acidic protein (GFAP).
Objectives:
We aimed to investigate the short- and long-term natural history of these biomarkers measured longitudinally among healthy adults.
Methods:
In this cohort study from the Physicians’ Health Study (PHS), VITamin D and OmegA-3 TriaL (VITAL), and COcoa Supplement and Multivitamin Outcomes Study (COSMOS), we included 1299 adults with bloods collected 2 years (VITAL and COSMOS) or 14 years (PHS) apart and without diagnosed neurodegenerative diseases before baseline or during follow-up through two years after the final blood collection. Associations between baseline characteristics and changes in NfL, tau, and GFAP were evaluated.
Results:
Mean (SD) age at baseline was 49.8 (6.8), 67.5 (6.2), and 70.3 (5.7) in PHS, VITAL, and COSMOS, respectively. PHS enrolled only men while ∼50% of the VITAL and COSMOS populations in this study were men. Median percent changes (IQR) of NfL were 40.6% (2.4, 58.2) increase over 14 years (PHS) and 8.5% (−6.6, 28.6) over 2 years (VITAL and COSMOS); increases in tau were 101% (10.7, 285) over 14 years and 11.8% (−35.2, 106) over 2 years; and increases in GFAP were 25.1% (−1.7, 23.8) over 14 years and 5.6% (−12.8, 28.6) over 2 years. In multivariable models, age was most strongly and robustly associated with 14-year changes in NfL and GFAP (adjusted p<0.001), and increases in levels accelerated at older ages. No baseline variables were associated with changes in tau.
Conclusion:
Increases in NfL and GFAP accelerated with age, highlighting the need to improve our understanding of the clinical relevance of short- and long-term changes in these neurodegenerative biomarkers in large-scale, long-term cohorts.
Introduction
Neurofilament light (NfL), tau, and glial fibrillary acidic protein (GFAP) have emerged as promising biomarkers in the realm of neurodegenerative diseases. NfL is present in both serum and cerebrospinal fluid, has provided insights into the progression, severity, and early-detection of various neurodegenerative conditions,1,2 and may have clinical utility for some neurodegenerative diseases. 3 A recent meta-analysis suggested that NfL may be a global diagnostic biomarker, but clinical symptoms and other auxiliary examinations would be needed for diagnosis or differential diagnosis. 4 In addition, NfL has been shown to be a reliable and easily measured biomarker that may be useful in monitoring disease progression and treatment response for some neurologic disease conditions (such as Alzheimer's disease [AD] or multiple sclerosis) and also has utility as a surrogate outcome in clinical trials.5–7 Tau, particularly in its phosphorylated form, has been extensively studied as a potential biomarker for AD, 8 and may differentiate AD from other neurodegenerative diseases.9–11 GFAP is an astrocytic damage marker, for which its elevation predicts the longitudinal progression to AD.12,13 Moreover, the associations between NfL, tau, and GFAP could provide a comprehensive understanding of AD progression, particularly among those with mild cognitive impairment. 14
While several studies have examined these biomarkers in relation to various neurodegenerative outcomes, little is known about the natural history or trajectory of NfL, tau, and GFAP among healthy middle-aged and older adults. Age-dependent increases in NfL have been documented in cross-sectional studies,15,16 whereas benchmarks for normal rates of changes in adults are needed to clinically interpret measurements over time for risk prediction and disease progression. We previously validated the measurements of plasma NfL using stored blood samples in the Physicians’ Health Study (PHS). 17 In the present study, we leveraged longitudinal biomarker assessments from the PHS, the VITamin D and OmegA-3 TriaL (VITAL), and the COcoa Supplement and Multivitamin Outcomes Study (COSMOS) to rigorously investigate the short- and long-term natural history of plasma NfL, tau, and GFAP in healthy middle-aged and older adults.
Materials and methods
Studies and blood sampling
PHS consisted of two long-term trials of 29,071 men aged ≥40 years.18,19 PHS participants completed annual questionnaires from study enrollment in 1982 through 2012 including assessment of various neurological disorders. In addition, 9520 PHS participants were sent blood collection kits and provided blood samples in both 1982 and 1996 allowing the examination of 14-year changes in biomarkers. Samples were sent with chill packs by overnight courier and immediately centrifuged and separated for plasma, then stored at −82 °C initially and then stored at −170 °C. Stability in the long-term storage was validated previously. 17
VITAL was a 2 × 2 factorial trial of vitamin D3 and marine ω-3 fatty acids from 2010 through 2018 among men aged ≥50 years and women aged ≥55 years who were initially free of cancer and CVD.20,21 A total of 2742 VITAL participants provided a blood sample at baseline and after 2 years of follow-up. The blood samples were collected via mail-based kits, in-home visits, or phlebotomy centers. All samples were returned overnight to our biorepository where they were immediately processed and stored at −170 °C.
Finally, COSMOS was a 2 × 2 factorial trial testing cocoa extract and multivitamin supplements in 21,442 women aged ≥65 years and men aged ≥60 years who were free of myocardial infarction (MI), stroke, and recently diagnosed cancer.22,23 More than 2100 COSMOS participants returned baseline, year 1, and year 2 blood biospecimens following the same methodologies described for VITAL above.
Written informed consent was obtained from all participants and the study protocol was approved by the Institutional Review Board at Brigham and Women's Hospital (Boston, Massachusetts).
Study population
In this study, the participants were eligible if they provided two longitudinal blood samples and had no history of cardiovascular disease, cancer, stroke, transient ischemic attack, Parkinson's disease, multiple sclerosis, Alzheimer's disease, dementia, amyotrophic lateral sclerosis, or spinal muscular atrophy prior to either the initial blood draw and for two years after the final blood draw. From these participants, we randomly included 500 individuals from PHS, 400 from VITAL, and 400 from COSMOS to explore differing lengths of biomarker change (i.e., 14 years versus 2 years) across a broad age spectrum. In VITAL and COSMOS, we oversampled non-Whites and required an approximately equal distribution of men and women.
Biomarker measurement
NfL and GFAP were measured at Quanterix, (Billerica, MA, USA) using their Simoa® Neurology 2-Plex B kit (N2PB). The Simoa® Tau Advantage assay was used to quantitate plasma tau levels. These assays were run on the Simoa HD-X analyzer using Single Molecule Array (Simoa) technology. 24 All measurements were conducted on the automated HD-X analyzers (Quanterix, Billerica, MA, USA). Samples were diluted 4× and assayed in singlicate. For quality control, a serum pool was measured in duplicate per plate additionally to duplicates of the exogenous control samples included in the kits. The mean inter-assay coefficient of variation (CoV) was 14, 15, and 17 for NfL, GFAP, and Tau endogenous control pools, respectively. Lower limit of quantification value for NfL, GFAP, and Tau assay was 0.8 pg/mL, 16.6 pg/mL, and 0.25 pg/mL, respectively.
One PHS participant had no biomarker measurements available and was excluded. Additionally, we excluded one baseline NfL, one baseline Tau, and one baseline GFAP measurement due to for excessively high values that likely reflected unreliable measurements.
Assessment of covariates
In all three studies, the following self-reported baseline characteristics were ascertained from questionnaires: age, body mass index (BMI), sex, race and ethnicity, education, smoking status, alcohol use, and history of diabetes, hypertension, and high cholesterol. In VITAL and COSMOS, total physical activity (PA) was expressed as metabolic equivalent (MET) hours per week. Blood sample was obtained at baseline in every trial, stored at <−80°C, and serum creatinine levels were ascertained using the samples. Of note, PHS consists of male physicians and thus the participants were exclusively educated in graduate school.
Statistical analysis
We conducted complete case analyses given that the availability of biomarker levels varied by studies and timing of the blood collection. Covariates had minimal missing data (<1%) except for history of high cholesterol (23%). Biomarker values were summarized as mean (standard deviation) at baseline and follow-up, as well as the changes between two timepoints, separately for each study. When evaluating 2-years changes in each biomarker, VITAL and COSMOS were combined. Spearman correlation coefficients were calculated between age, biomarkers at baseline, and the changes in each biomarker. Associations between sex and baseline biomarkers were evaluated using standardized mean difference (SMD). Next, baseline characteristics were compared across quartiles of 2-year (VITAL, COSMOS) and 14-year (PHS) changes in each biomarker using SMD. Multivariable linear regression models were fit to evaluate the independent associations between baseline characteristics and changes in each biomarker. The covariates included age (years), BMI (kg/m2), race (White/non-White), hypertension (yes/no), high cholesterol (yes/no), smoking status (past/current/never), alcohol (1–3 times per month/1–6 times per week/at least daily/rarely or never), and log-transformed creatinine level (μmol/L) in models based on PHS only; additionally for sex (men/women) and education (college/post-college/other) in models based on three studies combined; and additionally for total PA (MET-hour per week) in models based on VITAL and COSMOS. Finally, yearly changes of the biomarkers were visualized per age groups in three studies combined, with or without stratification by sex. Bonferroni-adjusted two-sided p-value < 0.05 was considered statistically significant. All analyses were conducted by R 4.3.1.
Results
Mean (SD) age at baseline was 49.8 (6.8), 67.5 (6.2), and 70.3 (5.7) in PHS, VITAL, and COSMOS, respectively (Table 1). PHS consisted of predominantly non-Hispanic White men, while participants from VITAL were 76% White and 21% Black. The COSMOS sample consisted of 82% White, 7% Black, and 7% Hispanic. Approximately 50% of VITAL and COSMOS were women. Distributions of NfL, Tau, and GFAP in each study at baseline are illustrated in Supplemental Figures 1–3. Figure 1 describes the associations between age, sex, and baseline biomarker levels in all studies combined. Spearman correlation coefficients with age were 0.62 (adjusted p < 0.001), 0.12 (adjusted p < 0.001), 0.58 (adjusted p < 0.001) for baseline NfL, Tau, and GFAP, respectively. Female sex was associated with higher baseline biomarker levels (SMD: 0.62, 0.21, and 0.87 for baseline NfL, Tau, and GFAP, respectively).
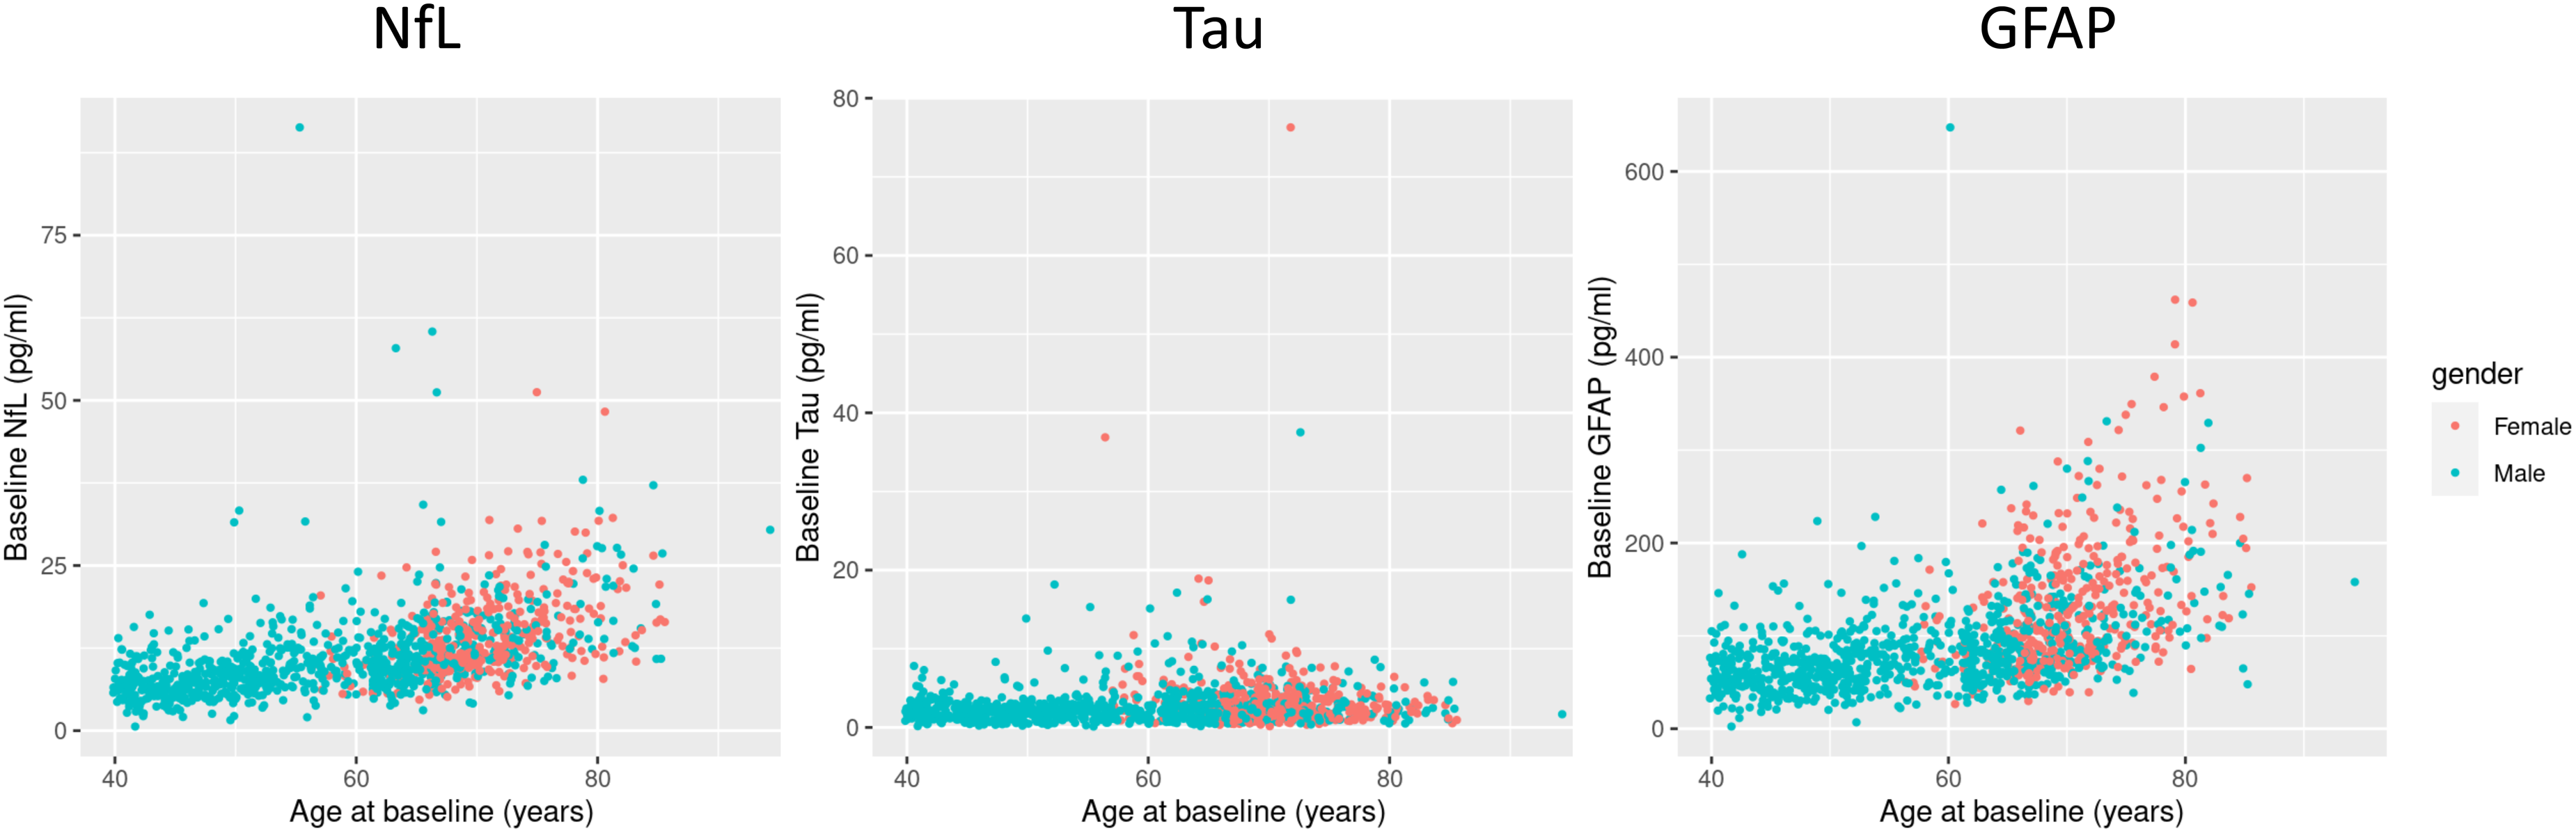
Association of baseline nfl, tau, and GFAP and age and sex in PHS, VITAL, and COSMOS combined.
Baseline characteristics of participants by study.

Numbers are mean (SD) or n (%).
Number may not add to 100% due to missing data.
Creatinine level was only available in COSMOS and PHS.
Changes of neurodegenerative biomarkers over time
Table 2 summarizes the longitudinal changes in NfL, Tau, and GFAP in each study. Each biomarker increased over both the short- and long-term with large between-person variation. Mean changes (SDs) of NfL were increases of 3.9 (7.7) in PHS, 1.1 (5.2) in VITAL, 2.0 (6.8) in COSMOS; increases in tau were 3.0 (5.3) in PHS, 1.1 (6.4) in VITAL, and 0.6 (3.7) in COSMOS; and increases in GFAP were 22.5 (47.9) in PHS, 6.1 (39.0) in VITAL, and 7.7 (40.3) in COSMOS. Median percent increases (IQR) of NfL were 40.6% (2.4, 58.2) over 14 years in PHS and 8.5% (−6.6, 28.6) over 2 years in VITAL and COSMOS; those in Tau were 101% (10.7, 285) over 14 years and 11.8% (−35.2, 106) over 2 years; and those in GFAP were 25.1% (−1.7, 61.4) over 14 years and 5.6% (−12.8, 28.6) over 2 years. Increases of biomarkers in PHS were greater, reflecting the longer follow-ups (14 years) compared with other studies (2 years).
Summary statistics for baseline, follow-up and changes over time in NfL, GFAP, and tau.

Numbers are mean (SD) of NfL, Tau, and GFAP levels at baseline, follow-up, and the changes in pg/ml and median (IQR) of the changes.
Blood samples were collected in 14-year apart in PHS and 2-year apart in VITAL and COSMOS.
N indicates the number of samples used for the calculation.
Characteristics associated with changes in NfL, tau, and GFAP
The changes in NfL and GFAP, but not for Tau, were each correlated with baseline age (Figure 2). Spearman correlation coefficients for 14-year changes in NfL, tau, GFAP with age were 0.30 (adjusted p < 0.001), 0.02 (adjusted p = 1), and 0.30 (adjusted p < 0.001). Spearman correlation coefficients between 2-year changes in biomarker and baseline age were less robust but had a similar overall pattern: 0.11 (adjusted p = 0.008) for NfL, 0.04 (p = 0.92) for Tau, and 0.07 (p = 0.18) for GFAP.

Correlations between 14- and 2-year changes in NfL, tau, and GFAP and age.
The associations between baseline characteristics and quartiles of change in each biomarker were summarized in Supplemental Tables 1–6. Greater increases in NfL over 14 years was strongly associated with older age and history of hypertension. Additionally, non-Whites were more likely to have greater NfL increases over 2 years. In contrast, 14-year increases in tau were not associated with age, and inversely associated with history of hypertension and never smoking. Increases in GFAP over 14 years was positively associated only with age. Finally, 2-year changes in tau and GFAP were not significantly associated with any baseline characteristics.
Independent predictors of biomarker levels at baseline and the changes
Table 3 shows results from multivariable linear regression models fitted for neurogenerative biomarkers at baseline in three studies combined. Older age and lower BMI were significantly associated with higher NfL and GFAP (adjusted p < 0.001), while women and daily alcohol drinkers had higher GFAP (adjusted p < 0.001 and p = 0.032, respectively). In addition, higher creatinine was robustly associated with higher NfL (adjusted p < 0.001). No baseline characteristics were associated with baseline tau level.
Independent predictors for NfL, tau, and GFAP at baseline.

Complete case analyses were conducted in N = 908 for NfL, N = 939 for Tau, and N = 909 for GFAP in three studies combined.
A total of 13 covariates were included in the linear regression with each biomarker level at baseline (pg/ml) as the independent variable.
Bonferroni-method was used to adjust p-values.
Tables 4 and 5 show results from multivariable linear regression models fitted for changes in the neurogenerative biomarkers. Age was robustly associated with 14-year change in NfL and GFAP (adjusted p < 0.001) but not with that in tau. Age was also associated with 2-year changes of NfL (adjusted p < 0.001) and GFAP (adjusted p = 0.038). Current smoking status was inversely associated with 14-year change in NfL, while positively correlated with the 2-year change (adjusted p = 0.012 for both). Creatinine was positively associated with 2-year changes in NfL but not 14-year changes (adjusted p = 0.016 and 1, respectively).
Independent predictors for 14-year changes in NfL, tau, and GFAP in PHS.

Complete case analyses were conducted in N = 400 for NfL, N = 419 for Tau, and N = 401 for GFAP in PHS.
A total of 10 covariates were included in the linear regression with 14-year changes of each biomarker level (pg/ml) as the independent variables.
Bonferroni-method was used to adjust p-values.
Independent predictors for 2-year changes in NfL, tau, and GFAP.

Complete case analyses were conducted in N = 481 for NfL, N = 501 for Tau, and N = 481 for GFAP in VITAL and COSMOS combined.
A total of 14 covariates were included in the linear regression with 2-year changes of each biomarker level (pg/ml) as the independent variables.
Bonferroni-method was used to adjust p-values.
Yearly changes of the neurodegenerative biomarkers
Figure 3 shows the yearly changes of NfL, tau and GFAP stratified by age in three studies combined. The annual increases of NfL and GFAP accelerated with age; means (SDs) of yearly changes of NfL were 0.2 (0.3) in 40 s, 0.4 (1.0) in 50 s, 0.5 (2.5) in 60 s, 1.1 (3.2) in 70 s, and 2.8 (5.7) in 80 s; those of GFAP were 1.2 (3.2) in 40 s, 2.5 (8.0) in 50 s, 2.2 (15.0) in 60 s, 4.3 (23.7) in 70 s, and 14.1 (28.3) in 80 s. No associations were observed between age and yearly changes in tau. Similar trends were observed when stratified by sex, but the confidence intervals got wider due to limited sample sizes (Supplemental Figure 4).

Yearly changes of NfL, tau, and GFAP by age group.
Discussion
In this study, we examined the natural history of longitudinal changes in plasma NfL, tau, and GFAP in healthy, middle-aged and older US adults. Older participants and women were more likely to have higher initial NfL and GFAP. Time-dependent changes were observed for each biomarker, with greater increases over 14 years compared with 2 years of follow-up. Only age was robustly predictive for changes in NfL and GFAP, and no variables were associated with changes in tau. The present observations support that these biomarkers – in participants free of major health conditions, including neurodegenerative diseases – increase over time, and more strongly with age. It will be important to determine if larger or smaller changes in NfL, tau, and GFAP over time may lead to clinically relevant changes in symptomology related to neurodegenerative diseases.
Other analyses of longitudinal changes in neurogenerative biomarkers among healthy adults remain very limited. In older adults without cognitive decline, short-term increases in NfL have been reported.25,26 Our current findings for PHS are consistent with our previous smaller pilot study in PHS for NfL among middle-aged and older men. 17 In this study, we expanded important insights to the natural history of three novel neurodegenerative biomarkers. Comparing findings for changes in these biomarkers over 2- versus 14-years of follow-up, baseline age was a key determinant of changes in NfL and GFAP, suggesting that these biomarkers consistently increase through middle and older adulthood in the absence of major morbidity and neurodegenerative diseases. Our finding of a positive correlation between creatinine level and NfL aligns with previous studies,27,28 with correlations found in analyses at baseline and for 2-year changes, but not for 14-year changes. We found it interesting that none of our included demographic, lifestyle, or clinical variables were associated with changes in tau. Larger studies with more comprehensive biomarker data that may be linked with NfL, tau, and GFAP are needed to further explore the determinants and modifiability of these neurodegenerative biomarkers.
A few reports highlight changes in neurodegenerative biomarkers in diseased populations. In individuals with preclinical Alzheimer's disease, NfL and GFAP increased over 4 years, with faster increase of NfL and GFAP in older individuals and in females, respectively. 29 NfL and GFAP were associated with Alzheimer's disease progression, but not based on longitudinal within-person changes over time. 30 In individuals with subjective memory complaints, older age significantly impacted 3-year increases in NfL, and women had significantly greater increases in tau over 3 years. 31 Importantly, our study indicates that NfL, tau, and GFAP also change in the pre-disease state among healthy adults, although the relatively small age-related absolute increases in NfL and GFAP may not be directly translated to diseases populations. The present results thus highlight the need for larger, longer studies that allow us to identify how changes over time may signal pre-clinical and clinical neurodegenerative outcomes.
Strengths of this study include the inclusion of middle-aged and older adults free from neurodegenerative or neuromuscular diseases, as well as other major morbidity, throughout follow-up with available stored biospecimens collected 2 or 14 years apart. However, there are several potential limitations to consider. Longer follow-up was only available for men (PHS), and potential sex differences over such periods could not be explored and should remain of interest for future studies. Next, the findings may not be fully generalizable, with 14-year changes based among predominantly non-Hispanic, White male physicians in PHS; on the other hand, we had reasonable diversity in VITAL and COSMOS for short-term changes. The contributions of demographic, lifestyle, and clinical factors toward longitudinal changes in these biomarkers warrants further investigation in larger studies over long-term follow-up in PHS, VITAL, and COSMOS; understanding whether particular subgroups of otherwise healthy participants are more or less likely to have greater changes in NfL, tau, and GFAP could have important clinical implications.
In conclusion, this study explored the natural history of plasma NfL, tau, and GFAP among healthy US adults in three cohorts with longitudinal bloods and long-term follow-up. Age was robustly associated with greater increase in NfL and GFAP, with increases in these biomarkers accelerating over time. To understand whether changes in NfL, tau, and GFAP over time are linked with changes in cognition, symptomatology, and other clinical outcomes, it is critically important for future research to leverage these and other large-scale, long-term cohorts.
Supplemental Material
sj-docx-1-jnd-10.1177_22143602241301636 - Supplemental material for Short- and long-term natural history of three neurodegenerative biomarkers among middle-aged and older adults
Supplemental material, sj-docx-1-jnd-10.1177_22143602241301636 for Short- and long-term natural history of three neurodegenerative biomarkers among middle-aged and older adults by Rikuta Hamaya, Pamela M Rist, Varant Kupelian, Anthony L Gotter, Jihee Sohn, Carrie E Rubel, J Michael Gaziano, JoAnn E Manson and Howard D Sesso in Journal of Neuromuscular Diseases
Footnotes
Acknowledgements
We are deeply indebted to our dedicated and longstanding research participants from the Physicians’ Health Study, VITamin D and OmegA-3 TriaL, and COcoa Supplement and Multivitamin Outcomes Study. We also greatly appreciate the scientific and logistical contributions from Drs. Wildon Farwell, Anthony Oppong-Gyebi, Marco Petrillo, and Christopher Whelan, all formerly at Biogen, which were instrumental to the successful completion of this research project.
Funding
The authors disclosed receipt of the following financial support for the research, authorship, and/or publication of this article: This study was supported by investigator-initiated grants from the Massachusetts Life Sciences Center, Biogen, Mars Edge, and grants CA 097193, CA 34944, CA 40360, HL 26490, HL 34595, CA 138962, and AT011729 from the National Institutes of Health.
Declaration of conflicting interests
VK, JS, ALG, CER: Past or current employees of and/or hold stock/stock options in Biogen. HDS: Received an investigator-initiated grant from Biogen. HDS and JEM: Received an investigator-initiated grant from Mars Edge.
Datasets/data availability statement
Data described in the manuscript, code book, and analytic code will be made available upon request pending application and approval.
Supplemental material
Supplemental material for this article is available online.
References
Supplementary Material
Please find the following supplemental material available below.
For Open Access articles published under a Creative Commons License, all supplemental material carries the same license as the article it is associated with.
For non-Open Access articles published, all supplemental material carries a non-exclusive license, and permission requests for re-use of supplemental material or any part of supplemental material shall be sent directly to the copyright owner as specified in the copyright notice associated with the article.
