
Abstract
Dysferlinopathy is a phenotypically heterogeneous, inherited, progressive muscular dystrophy caused by mutations in the DYSF gene. Dysferlinopathy is marked by elevated serum creatine kinase (CK) and can in some cases manifest as hyperCKemia in asymptomatic or low-symptom states. Here, we describe the clinical signs and symptoms and laboratory and imaging results with quantitative MRI analysis of eight pediatric patients at asymptomatic and oligosymptomatic states of dysferlinopathy (aged 3–14 years). Seven of them with a same homozygous mutation and one with a compound heterozygous mutation in the DYSF gene. Based on this case series, we propose two stages of dysferlinopathy disease progression. The first state is asymptomatic hyperCKemia laboratory syndrome of myocytolysis, which is marked by an increase in CK (>1.5 times the upper limit of normal (ULN)) and lactic dehydrogenase (LDH). Second state (oligosymptomatic): increasing CK (2.7–12.6 × ULN), LDH, alanine aminotransferase (ALT), and myoglobin; minimal or moderate signs of fatty muscle infiltration, displacement of the center of support to the back of the foot during plantography; slight afterload fatigue of the calf muscles; slight decrease in muscle strength (imperceptible to the patient) and decrease in Achilles reflexes. Taken together, isolated hyperCKemia (asymptomatic stage) and oligosymptomatic patients form a single continuum of pre-manifest cases.
Keywords
Introduction
Dysferlinopathy is a phenotypically variable, inherited, progressive muscular dystrophy caused by mutations in the DYSF gene.1,2 Mutations in the DYSF gene lead to a deficiency or dysfunction of the dysferlin protein involved in the repair of the muscle fiber membrane.3,4 Dysferlinopathy manifests more often in the second decade of life.1,5
The most common and thoroughly investigated phenotypes are Miyoshi myopathy (OMIM # 254130) and limb-girdle phenotype (OMIM # 253601). An intermediate variant is the proximal-distal phenotype, which combines the features of both. Among the rare forms of dysferlinopathy, there are congenital phenotype,6,7 distal myopathy with anterior tibial onset (DMAT, OMIM # 606768601), 8 pseudometabolic phenotype, 9 and asymptomatic hyperCKemia.9,10
Asymptomatic hyperCKemia, which constitutes 5–6.2% of patients (children and adults), precedes the development of manifest forms of dysferlinopathy, therefore it is not considered to be an independent phenotype.9–12 The rarity of detecting such cases and the variety of causative mutations in the DYSF gene limits the possibilities of forming ideas about the earliest signs and pathogenetic mechanisms of dysferlinopathy at the subclinical stage of the disease.9,10 However, a detailed study of subclinical cases is important to identify the mechanisms of transformation into clinically manifest forms of dysferlinopathy, as well as to search for therapeutic opportunities to delay or completely avoid the development of a detailed clinical picture.
Here, we present a case series of seven patients at asymptomatic and oligosymptomatic states of dysferlinopathy, who carry a homozygous mutation (c.TG573/574AT; p.Val67Asp) and one with a compound heterozygous mutation (c.1852G > A; p.Gly618Arg; с.6196G > A; p. Ala2066Thr) in the DYSF gene13–15 compared with a control group. We present the early clinical, laboratory, and instrumental characteristics of dysferlinopathy at pre-manifest stage.
Materials and methods
Ethics statement
All procedures were performed after the patients signed an informed consent form as required by the Declaration of Helsinki (2013) and the study protocol (#AC-3118-122021) approved by the local Ethics Committee of the Dagestan State Medical Academy (Russia). Adult subjects and the parents of subjects under 18 years received an explanation about the dramatic nature of the information they can receive from genetic tests. They were informed that they have a right to refuse both study participation and receipt of test results. All patients signed an informed consent form for publication their medical data and photographs.
Genetic research
DNA samples from venous blood were obtained from 780 residents of the mountain isolate during the screening of an endemic mutation in the DYSF gene (c.TG573 / 574AT; p.Val67Asp) for this region were analyzed by polymerase chain reaction testing. Another case of pre-manifest dysferlinopathy was identified in a family where a symptomatic sibling with a non-endemic mutation was diagnosed.
Examination of patients
Seven patients at the pre-manifest stage of dysferlinopathy from three Avar families of a mountain isolate of the Republic of Dagestan with a homozygous mutation in the DYSF gene (c.TG573 / 574AT; p.Val67Asp) identified during genetic screening and one case from a Russian family with a non-endemic compound heterozygous mutation were examined. The pedigree chart in Figure 1 depicts the relationship between Avar patients. In family A, patient IV:3 is a 3-year-old male, patient IV:2 is a 10-year-old male, and patient IV:1 is an 8-year-old female. In family B, patient IV:14 is a 10-year-old male and patient IV:15 is a 5-year-old male. In family C, patient IV:20 is a 6-year-old female. In family D, patient III:22 is a 12-year-old male. Genealogical analysis, and clinical and neurological examinations, were performed. The muscle strength assessment was performed according to Brooke et al. 1981. 16
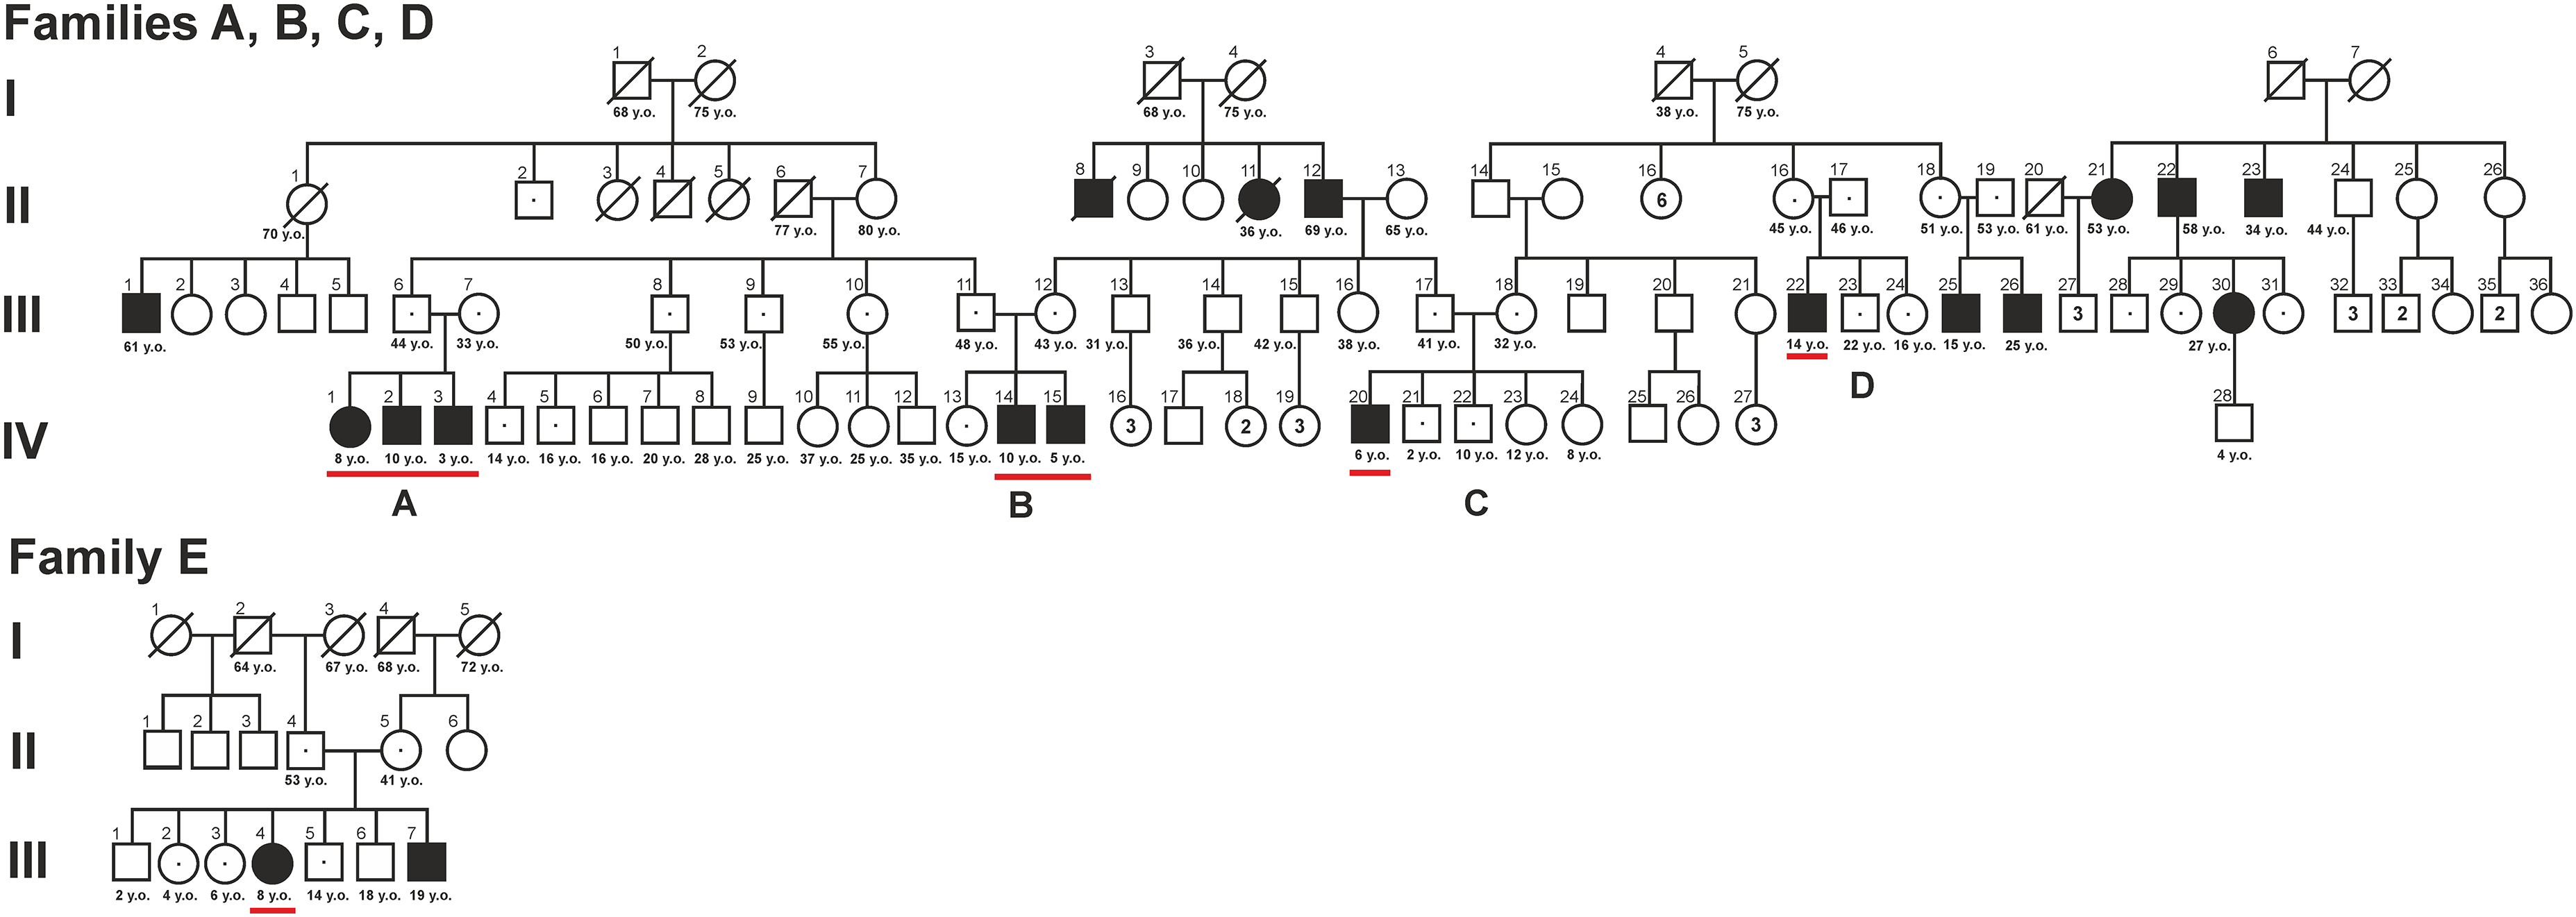
Pedigree of A, B, C, D families with LGMD R2, caused by a homozygous mutation in the DYSF c.TG573 / 574AT gene; p.Val67Asp in patients IV:1, IV:2, IV:3, IV:14, IV:15, IV:20, III:22 with no obvious signs of LGMD are underlined. Manifest cases of LGMD R2: II:8, II:11, II:12, II:21, II:22, II:23, III:1, III:25, III:26, III:30.
Assessments of each patient's clinical status was carried out using the Walton and Gardner-Medwin scale (W-GM) 17 and Muscular Dystrophy Score (MDS). 18
The control group included eight healthy volunteers (five male; three female), one control for each patient comparable in sex and age within a year.
Quantitative muscle MRI and plantar pressure distribution were compared between pre-manifest dysferlinopathy patients and healthy volunteers.
Laboratory and instrumental research
All patients underwent a clinical and biochemical blood test, needle electromyogram (EMG), electrocardiogram (ECG), echocardiogram (ECHO), magnetic resonance imaging (MRI) of muscles of the whole body, and plantography (plantar pressure distribution).19–21 Evaluation of plantar pressure distribution was completed using a hybrid pressure-posturology platform (Presscam V5, Sidas, France). The active surface of the sensors - 400 mm × 400 mm. Sampling frequency is 100 Hz in real time. The study protocol lasted 30 s and included measurements of surface area, forefoot and hindfoot axial load.19,22 The forefoot to hindfoot surface area ratio was also assessed. During the measurements, the subjects were standing in a relaxed position, not move, their feet parallel, the upper limbs hanging along the body.
Whole body MRI scanning was performed on an Ingenia 1.5T tomograph (Philips Healthcare, Eindhoven, Netherlands) using a body surface receiver coil. The protocol included T2-multi-slice multi-echo (T2 MSME), T1 weighted (T1w), T2 weighted (T2w) and Short Tau Inversion Recovery T2 weighted (STIR T2w) pulse sequences. A quantitative assessment was carried out using a three-exponential calculation method with a per voxel deconvolution into water and fat signals as described earlier23,24 and muscle water T2 maps and fat fractions maps were generated (MYOWEB, C.R.I.S, Tournai, Belgium). Individual muscles were segmented manually using ITKsnap and water T2 and fat fraction (FF) were analyzed muscle by muscle.
Statistical analysis
The quantitative results of this study are presented as mean (M) or median (Me) values with 95% confidence intervals (calculated via the Klopper-Pearson and bootstrap methods); statistical significance was evaluated using the Mann–Whitney signed-rank test and Student's t-test (p < 0.05) depending on whether the data were normally distributed.
Results
Genetic analysis
There are three cases of dysferlinopathy in family A (IV:1, IV:2, and IV:3), two in family B (IV:14 and IV:15), and one each in families C and D (IV:20 and III:22, respectively). Fathers of families 1 (III:6) and 2 (III:11) are siblings. The mother of the patients from the second family (III:12) and the father (III:17) of the third family are siblings. All parents of the described patients are heterozygous carriers of the endemic mutation in the DYSF gene and have no clinical or laboratory abnormalities. Among the members of the studied families, there are 10 manifest cases of symptomatic dysferlinopathy, at ages 15–61 years, who are homozygous for an endemic mutation (Figure 1). The average age of disease manifestation in those was 17 (15; 19) years. Among five siblings in the Russian non-consanguineous family E one has a pre-manifest status (III:4) and one symptomatic (III:7) caused by a compound heterozygous mutation (c.1852G > A; p.Gly618Arg; с.6196G > A; p. Ala2066Thr) in DYSF.
Description of clinical cases
Patients at the pre-manifest stage of dysferlinopathy (IV:3, IV:15, IV:20, IV:1, IV:2, III:22, IV:14, and E III:4) were born at 38–40 weeks of gestation from clinically healthy parents. Patients all had normal reported APGAR scores and normal body weight and length at birth. Psychomotor development was normal.
Seven of them were classified as oligosymptomatic patients (IV:15, IV:20, IV:1, IV:2, III:22, IV:14, and E III:4) and one as asymptomatic (IV:3).
It was noted that patients IV:1, IV:2, IV:14, III:22, and E III:4 displayed slight fatigue of their calf muscles for 1–2 years prior to the current examination. In addition, patients IV:2 and EIII:4 noted the onset of increasing swelling feeling and pain in the leg muscles after exercise. Patients IV:15 and IV:20 did not report any muscular symptoms. Thus, five of the eight patients subjectively noted the first signs of the disease.
On neurological examination, most patients demonstrated full strength against some resistance (score 5–) or full resistance (score 5) for neck flexion, finger extension, and knee flexion (Table 1). No contractures of the Achilles tendon were noted. The functional status on the W-GM scale was 0 grade and the MDS was 40 points in all patients.
Clinical signs and symptoms in patients with dysferlinopathy at the pre-manifest stage.
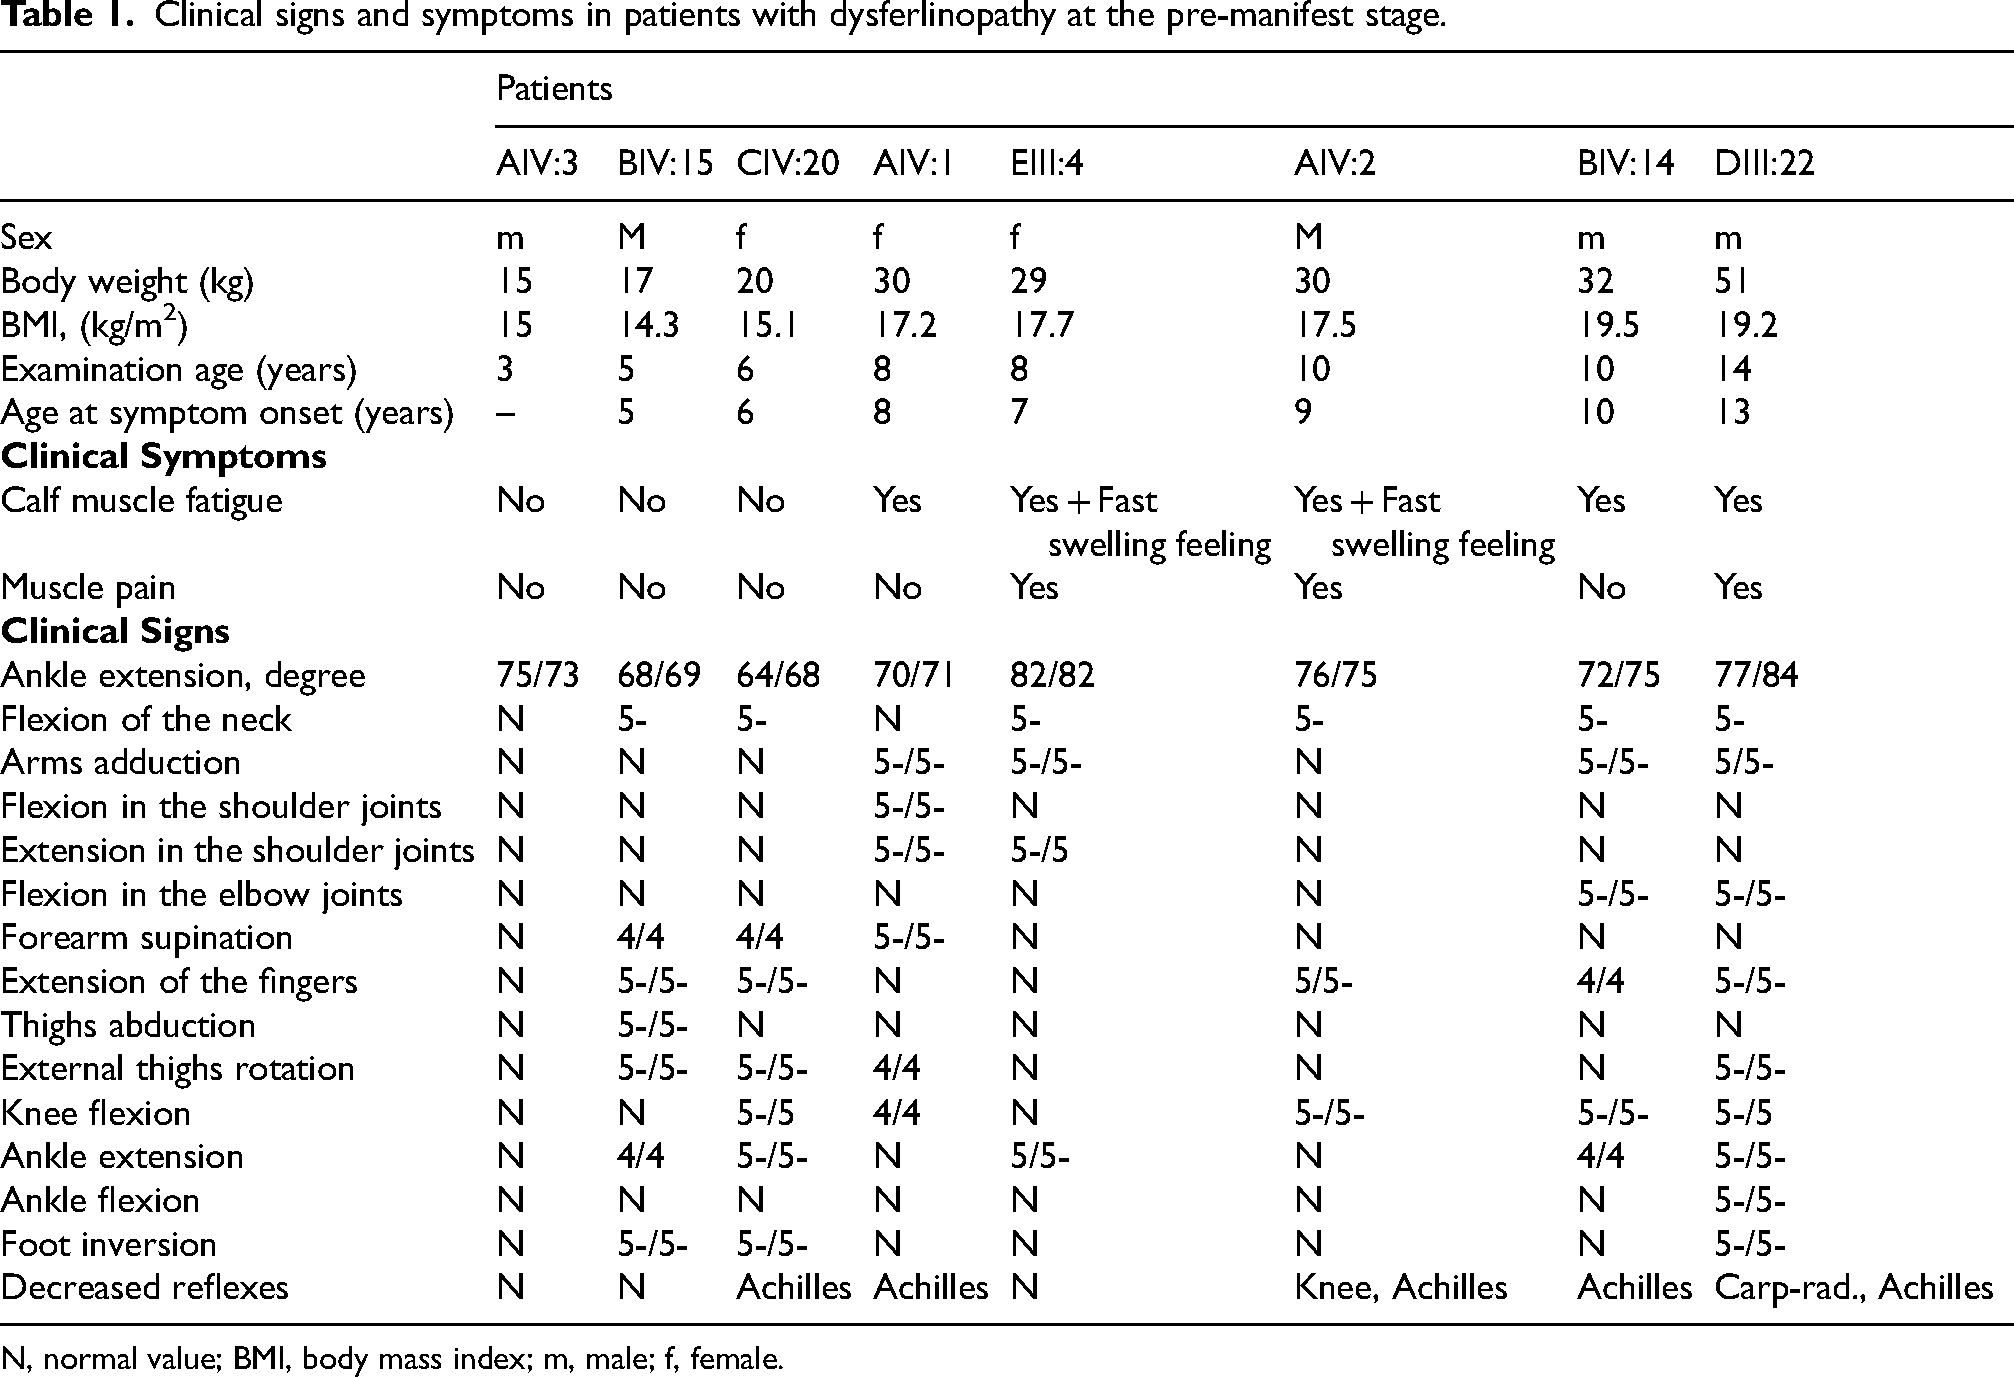
N, normal value; BMI, body mass index; m, male; f, female.
Atrophy of the posterior muscle group of the legs was not noted on physical exam for any of the patients except for patient III:22 with barely noticeable hypotrophy of medial part of gastrocnemius. However, all of them had planovalgus deformity of the feet (Figure 2).
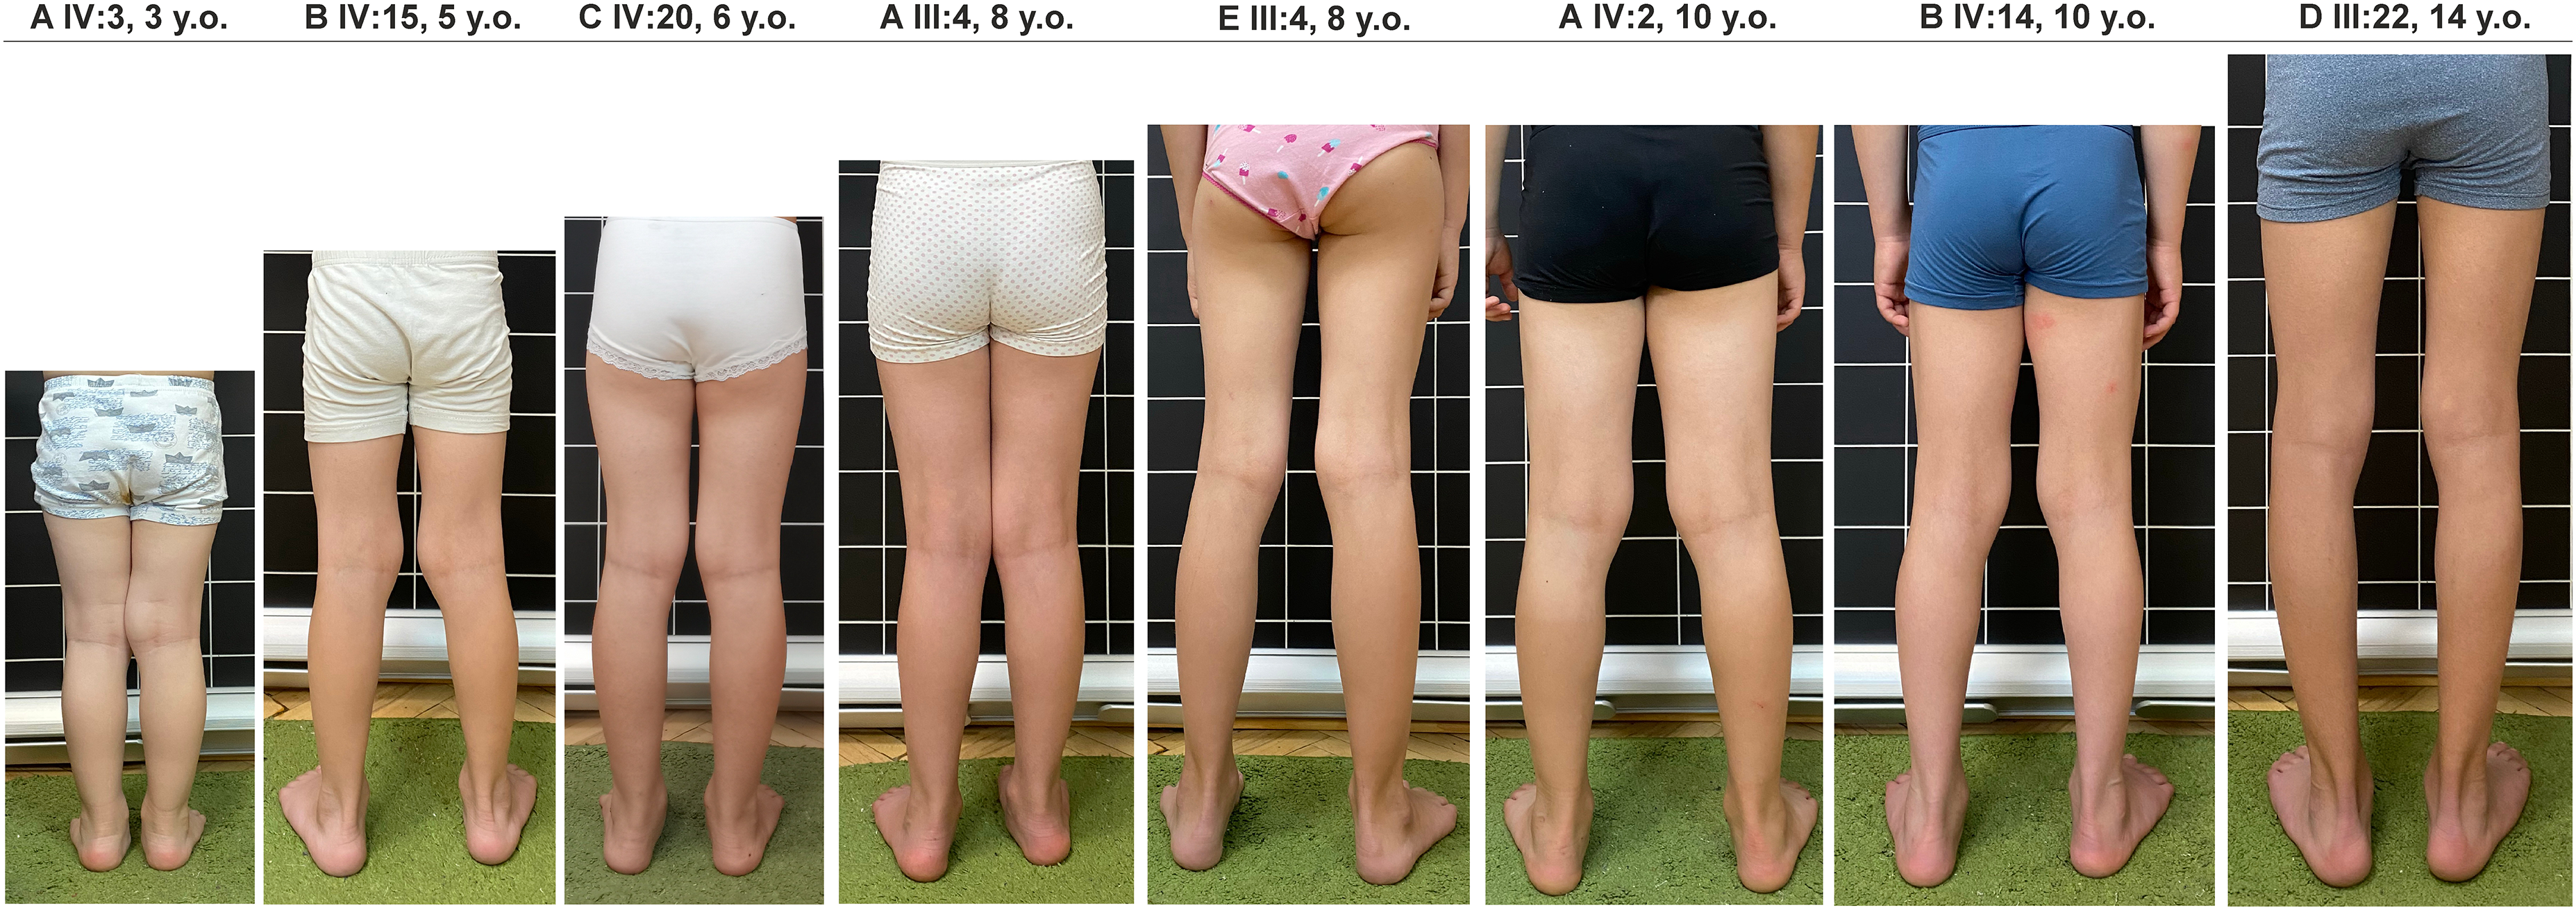
Trophic status of the lower extremities and setting of feet in six patients at the pre-manifest stage of dysferlinopathy. Patient III:22 has barely noticeable hypotrophy of medial part of gastrocnemius. All patients had planovalgus deformity of the feet.
The symptom of home shoes by Mongi Ben Hamida (Rabat Institute, Tunisia) 25 consists of rapid wear (abrasion) of the sole of the back of the shoe. This symptom was detected in all patients except for asymptomatic patient IV:3.
Clinical testing
All examined patients at the pre-manifest stage of dysferlinopathy showed an increase in the level of creatine kinase (CK) 544 (450; 935) U/L and lactic dehydrogenase (LDH) 524 (485; 564) U/L, with a tendency to increase with age, starting from 3 years. One asymptomatic patient (IV:3) had a CK level of 249 U/l, which is significantly less than in seven patients with an oligosymptomatic state 570 (519; 2149) U/l (one-sample Wilcoxon test, z = 2,4; p = 0,02).
It should be noted that an increase was detected in myoglobin from the age of 10 and in ALT from the age of 8. The aspartate aminotransferase (AST) level was normal in all subjects at the pre-manifest stage except for patient III:22 with slight elevation AST level up to 51 U/L (Table 2).26–31
Results of laboratory studies of patients at the pre-manifest stage of dysferlinopathy.
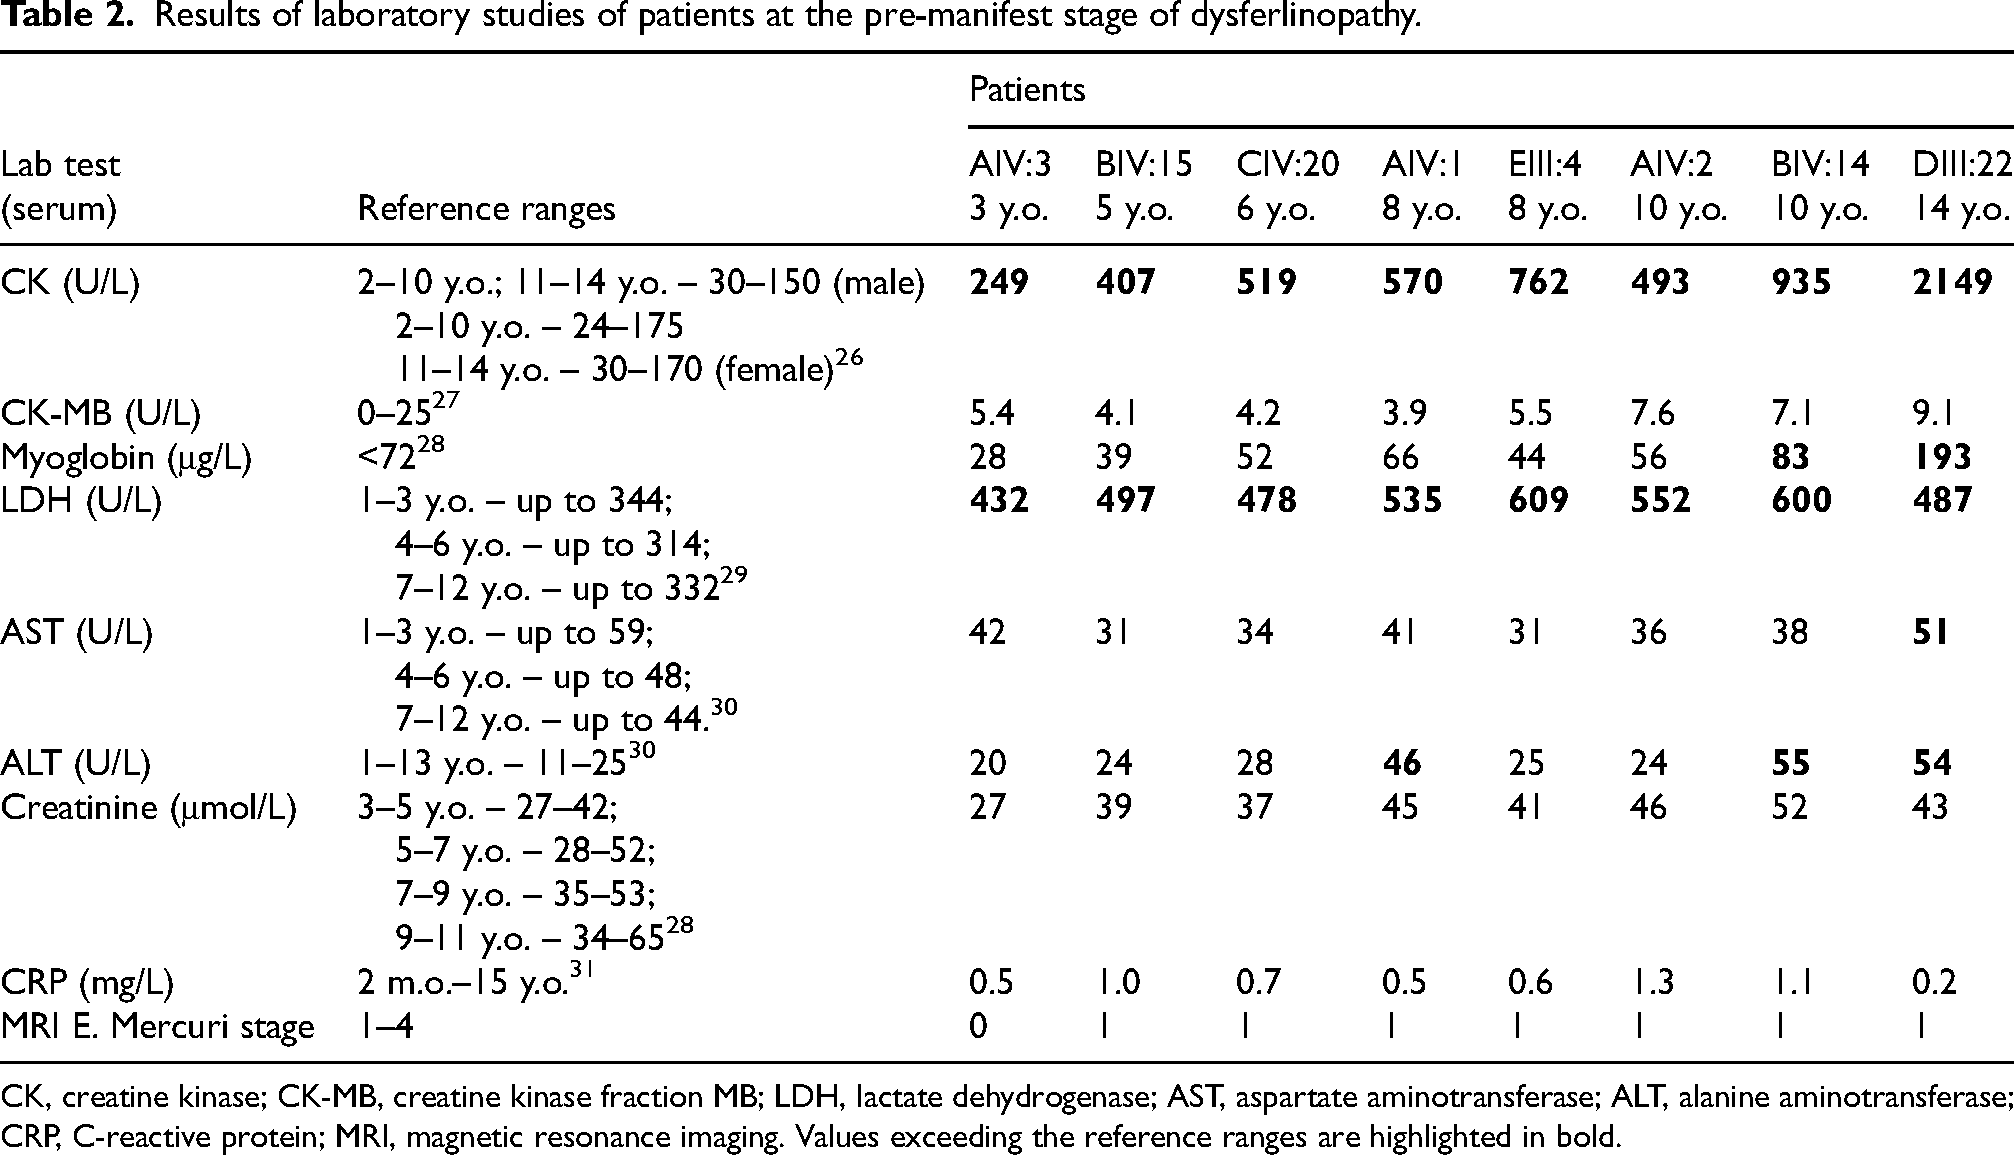
CK, creatine kinase; CK-MB, creatine kinase fraction MB; LDH, lactate dehydrogenase; AST, aspartate aminotransferase; ALT, alanine aminotransferase; CRP, C-reactive protein; MRI, magnetic resonance imaging. Values exceeding the reference ranges are highlighted in bold.
The CK level is directly correlated with the level of myoglobin (Spearman's test, rs = 0.96; р = 0.003), LDH (rs = 0.82; р = 0.006), ALT (rs = 0.99; р = 0.03), and creatinine (rs = 0.82; р = 0.03). Creatinine and C-reactive protein (CRP) levels were normal (Table 2). The level of CK and myoglobin was noted to increase in proportion to body mass index (Pearson's criterion, rp = 0.88; p = 0.01; rp = 0.78; p = 0.03) during ages 3–12 years.
Needle EMG of the deltoid muscle in oligosymptomatic patients 10–14 years old (IV:2, IV:14, and III:22) revealed a reduced in motor unit action potential duration by 10–14% – 7.5 (min. 3.9; max. 10.4) ms, and the number of polyphase potentials was increased (up to 4.3–22.1%). A decrease in the MUAP amplitude by 41–49% was detected only in a patient 10 and 11 years old (443 (min. 212; max. 797) μV; 384 (min. 172; max. 774) μV). The Wilison interference pattern corresponded to the myogenic type (saturated, decreased in amplitude). Single fibrillation potentials were observed. In all oligosymptomatic patients (IV:15, IV:20, IV:1, IV:2, III:22, IV:14, and E III:4) in the vastus lateralis muscle, MUAPs were characterized by normal amplitude 534 (min. 149; max. 1508) μV and reduced duration by 11–16% – 8.6 (min. 5.6; max. 11.4) ms, but an increase in the number of polyphasic fibers (up to 14.5–23%) was noted. The interference pattern corresponded to the norm (saturated, normal amplitude). In the tibialis anterior muscle, MUAPs were of normal amplitude 648 (min. 568; max. 734) μV, but reduced duration by 10–23% – 7.0 (min. 6.8; max. 7.5) ms, and the number of polyphase potentials was increased (up to 7–37%). The interference pattern corresponded to the myogenic type. No spontaneous activity was observed in the vastus lateralis muscle.
In asymptomatic and oligosymptomatic patients in the gastrocnemius lateralis muscle, MUAPs were reduced duration by 15–27% – 6.9 (min. 6.3; max. 7.2) ms, reduced amplitude by 32–40% – 387 (min. 331; max. 765) μV, and the number of polyphase potentials was increased (up to 18.3%). The interference pattern corresponded to the myogenic type. Single fibrillation potentials were observed in oligosymptomatic patients.
No cardiac pathology was revealed on ECG or ECHO.
Digital plantography in all patients revealed a shift in the center of gravity of the body to the hindfoot. The axial load on the forefoot was 17 (10.5; 22.5) % on the left and 10.2 (6.3; 14.0) % on the right. This is significantly less than the axial load on the hindfoot, which was 83 (76; 89)% on the left and 89 (84; 92) % on the right (Student's test, p = 0.0026 and p = 0.0017). The ratio of the support areas of the frontfoot to the hindfoot was 0.50 (0.47; 0.81) on the left and 0.34 (0.30; 0.48) on the right. The ratio of the support areas was significantly greater in the control group: 0.84 (0.75; 1.08) on the right (Student's t-test, t = 3.4, p = 0.01) and 0.89 (0.70; 1.64) on the left foot (Mann-Whitney test, z = 2.2; p = 0.01). Patient III:22 has a significant asymmetry in the support areas due to the difference in the angles of extension of the feet (77° / 84°). (Figure 3).
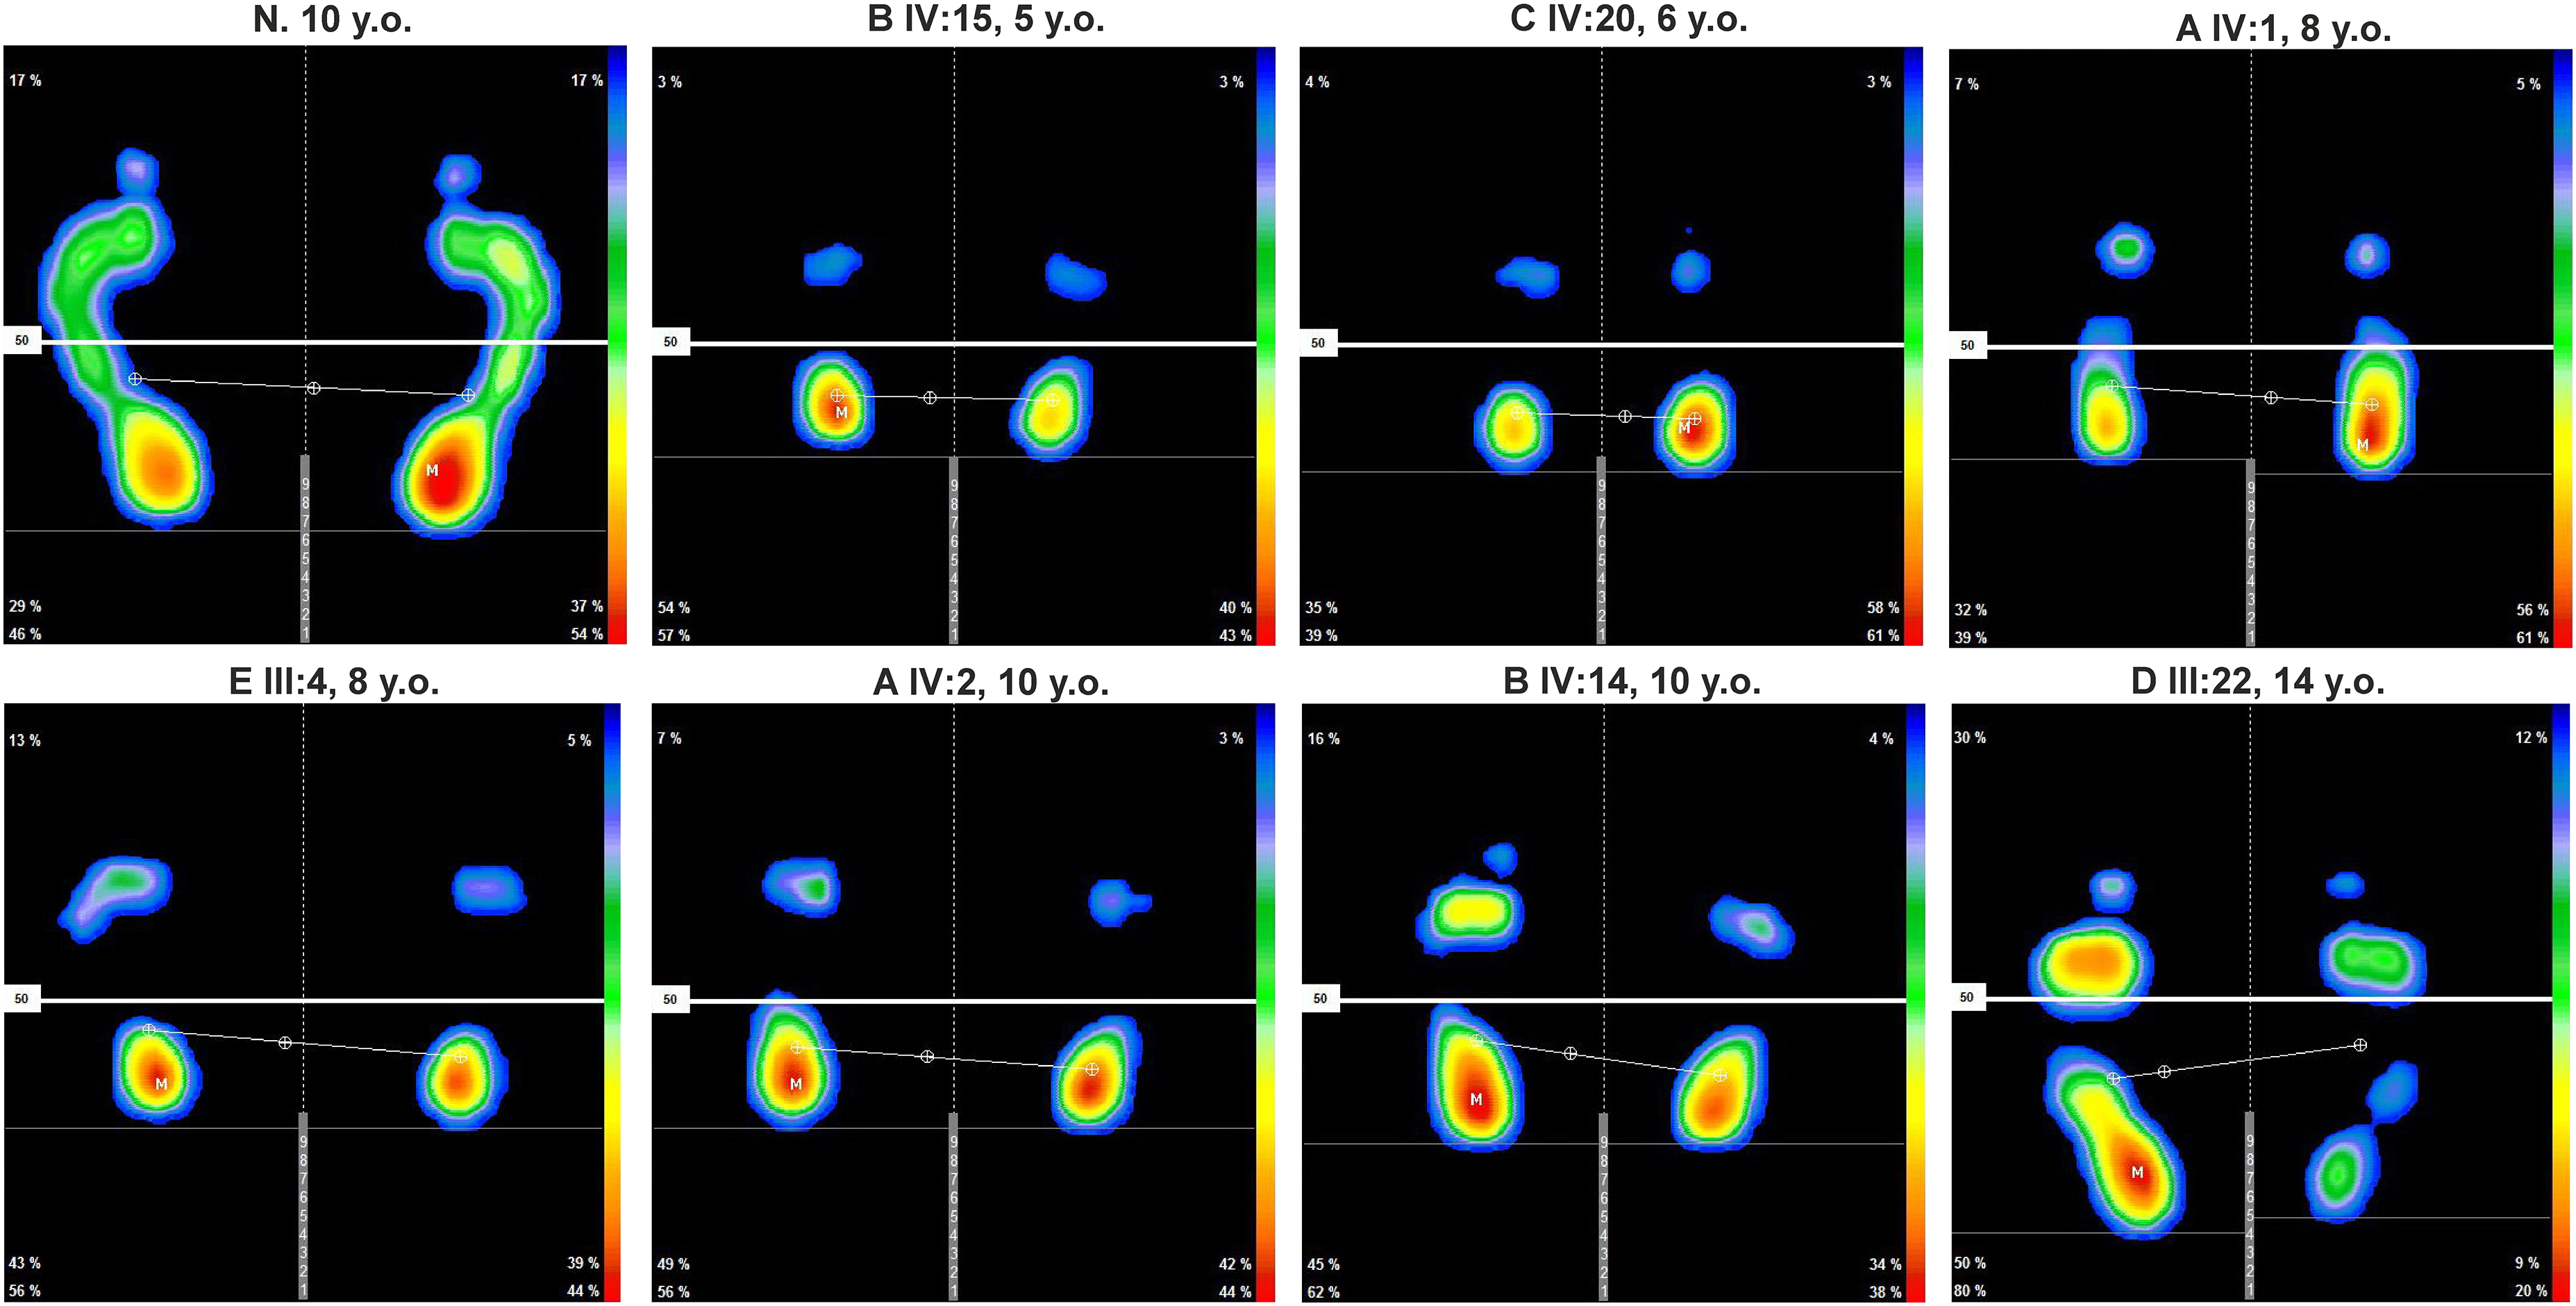
Plantography (plantar pressure distribution) of patients at the pre-manifest stage of dysferlinopathy. «N» denotes healthy volunteer control patient. «M» is the point of maximum pressure. Color scale represents red as maximum pressure and blue as minimum pressure.
MRI of the muscles of the whole body did not reveal fatty infiltration of the muscles of the shoulder girdle or axial muscles. However, patient IV:14 performs daily push-ups for exercise and was noted to have edema of the left infraspinatus muscle. Patient III:22 wrestles daily and has edema of the infraspinatus, subscapularis, posterior deltoid on the left, and pectoralis major on the right. (Figure 4).
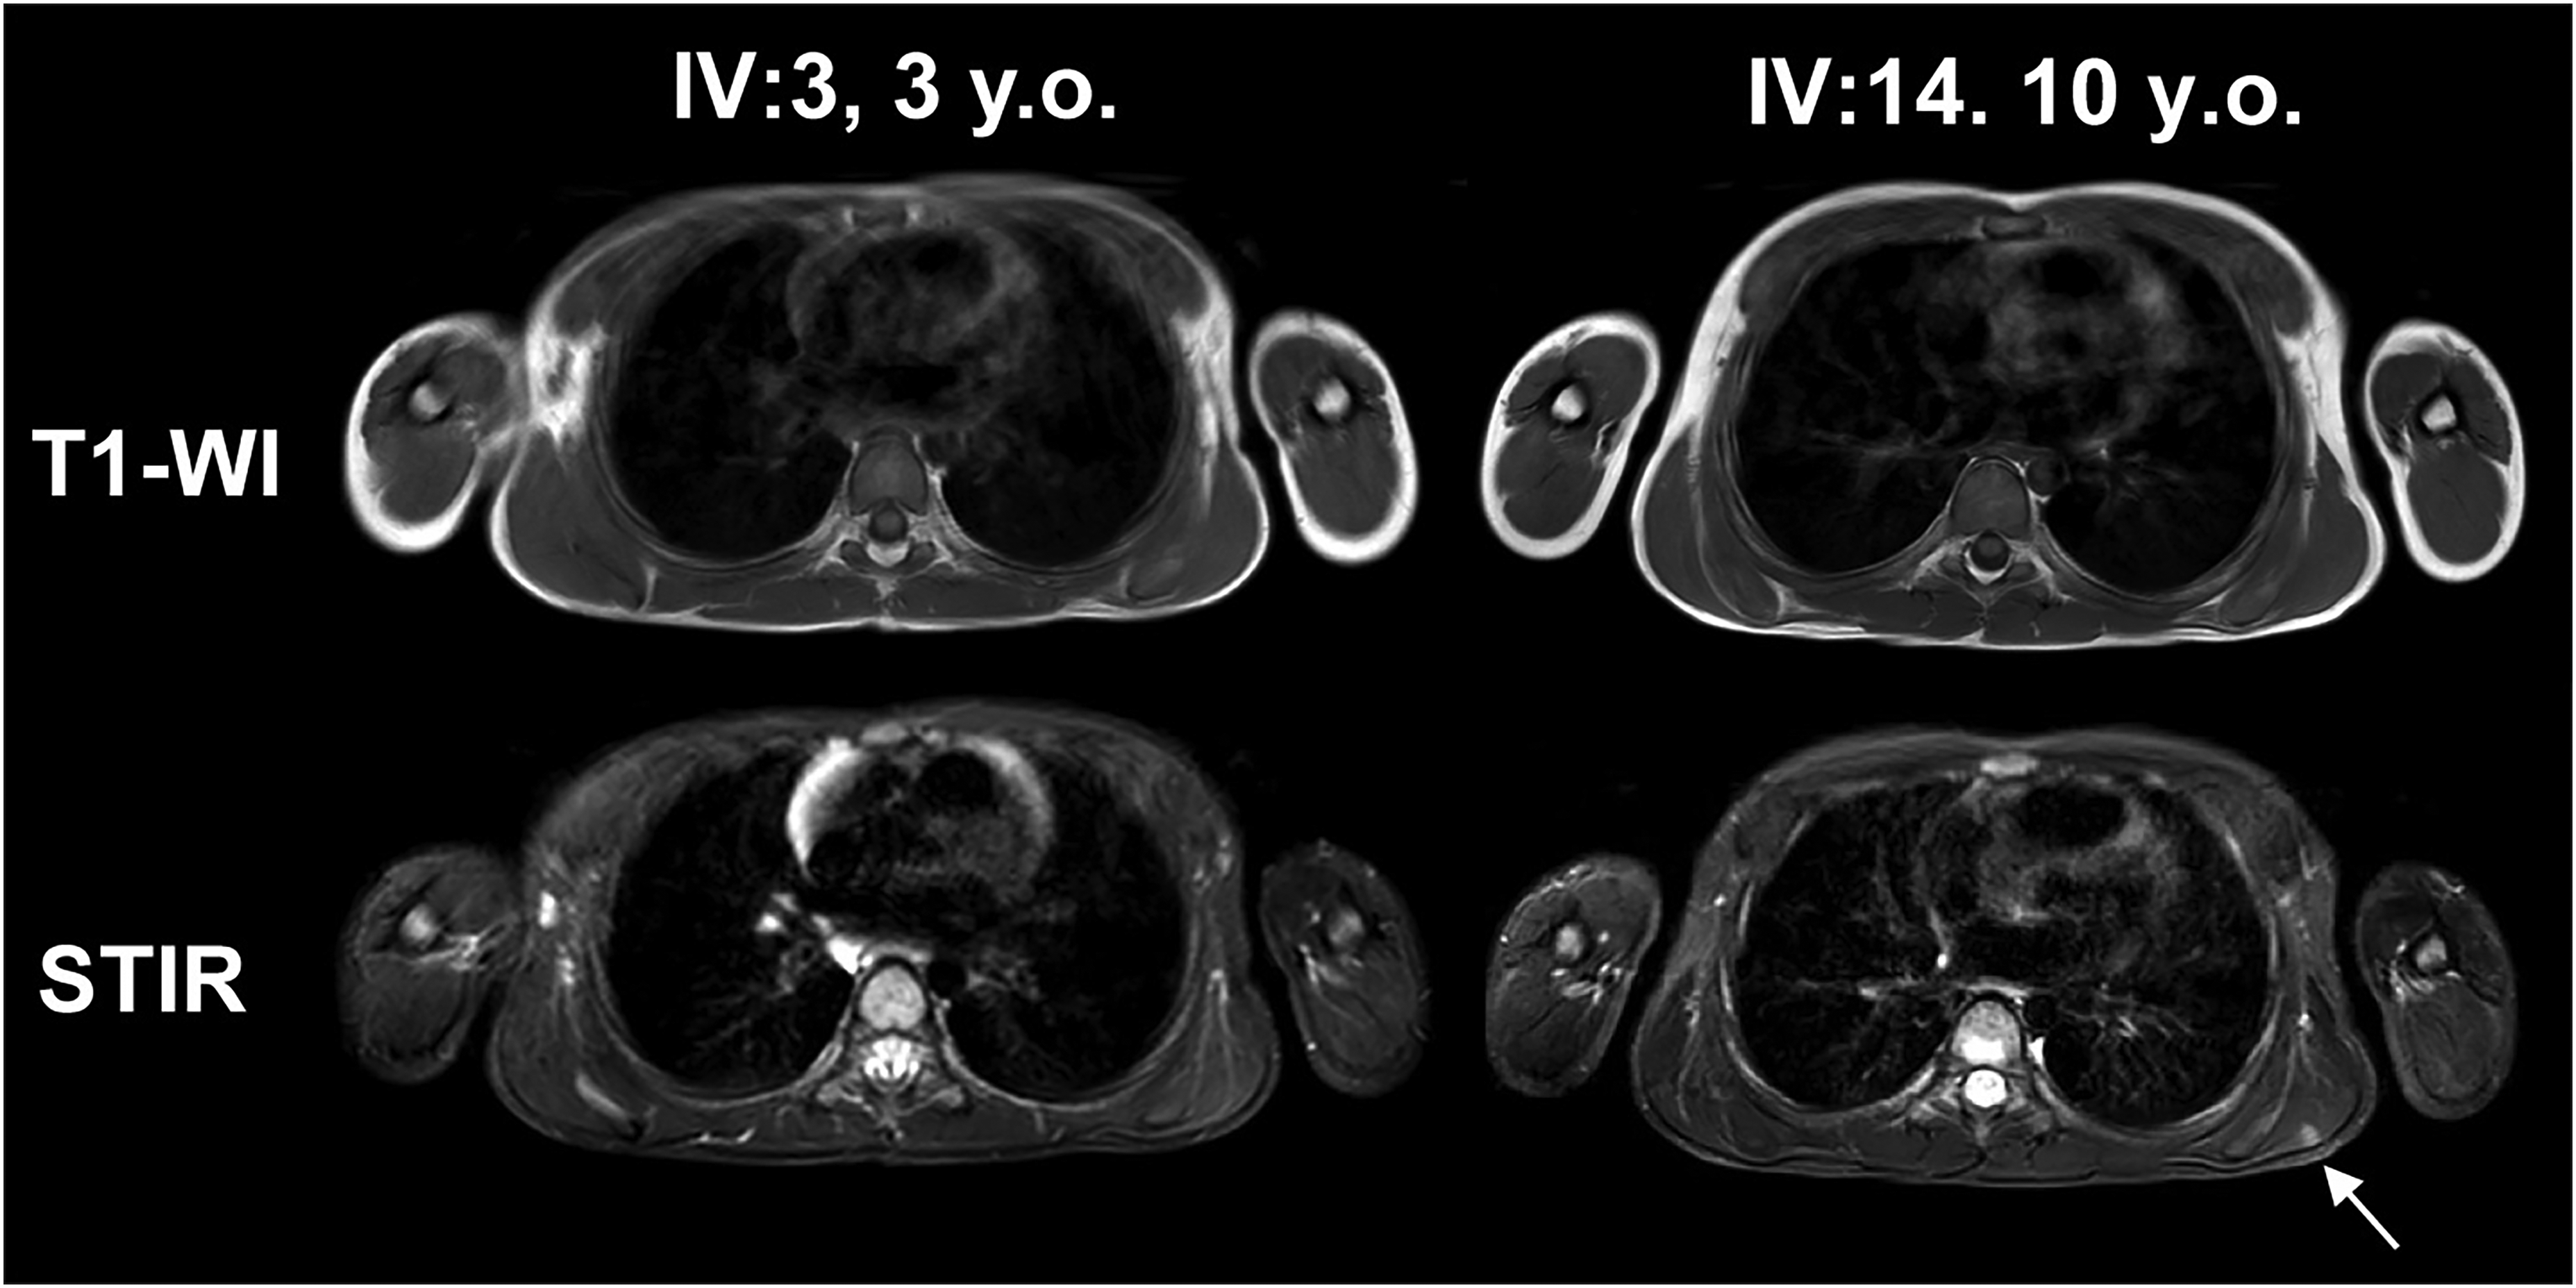
MRI (T1-WI and STIR) of the muscles of the shoulder girdle, shoulders, and trunk of patients IV:14 and IV:3. Arrow marks the site of local muscle edema.
In the vastus lateralis (FF = 9.3 (8.4; 9.9) %), vastus medialis (FF = 10.1 (9.6; 10.6) %), and adductor magnus muscles (FF = 9.5 (8.5; 10.0) %), the initial signs of fat replacement correspond to E. Mercuri stage 1 in patients IV:1, IV:14, IV:2, and III: 22. Fatty infiltration in the rectus femoris muscle (FF = 7.5 (6.5; 8.4) %) and vastus intermedius muscle (FF = 10.3 (9.5; 11.1) %) corresponding to E. Mercuri stage 1 was noted in patients IV:1, IV:2, and III:22. Initial signs of substitution with adipose tissue in muscles of the posterior thigh was observed in most patients (FF = 10.2 (9.1; 11.0) %). Fatty infiltration of the gastrocnemius caput mediale muscle (FF = 11.3 (10.5; 12.1) %) and soleus muscle (FF = 11.5 (10.6; 12.3) %) was noted in all patients, and in the gastrocnemius caput laterale for all patients except IV:3. (Figure 5).
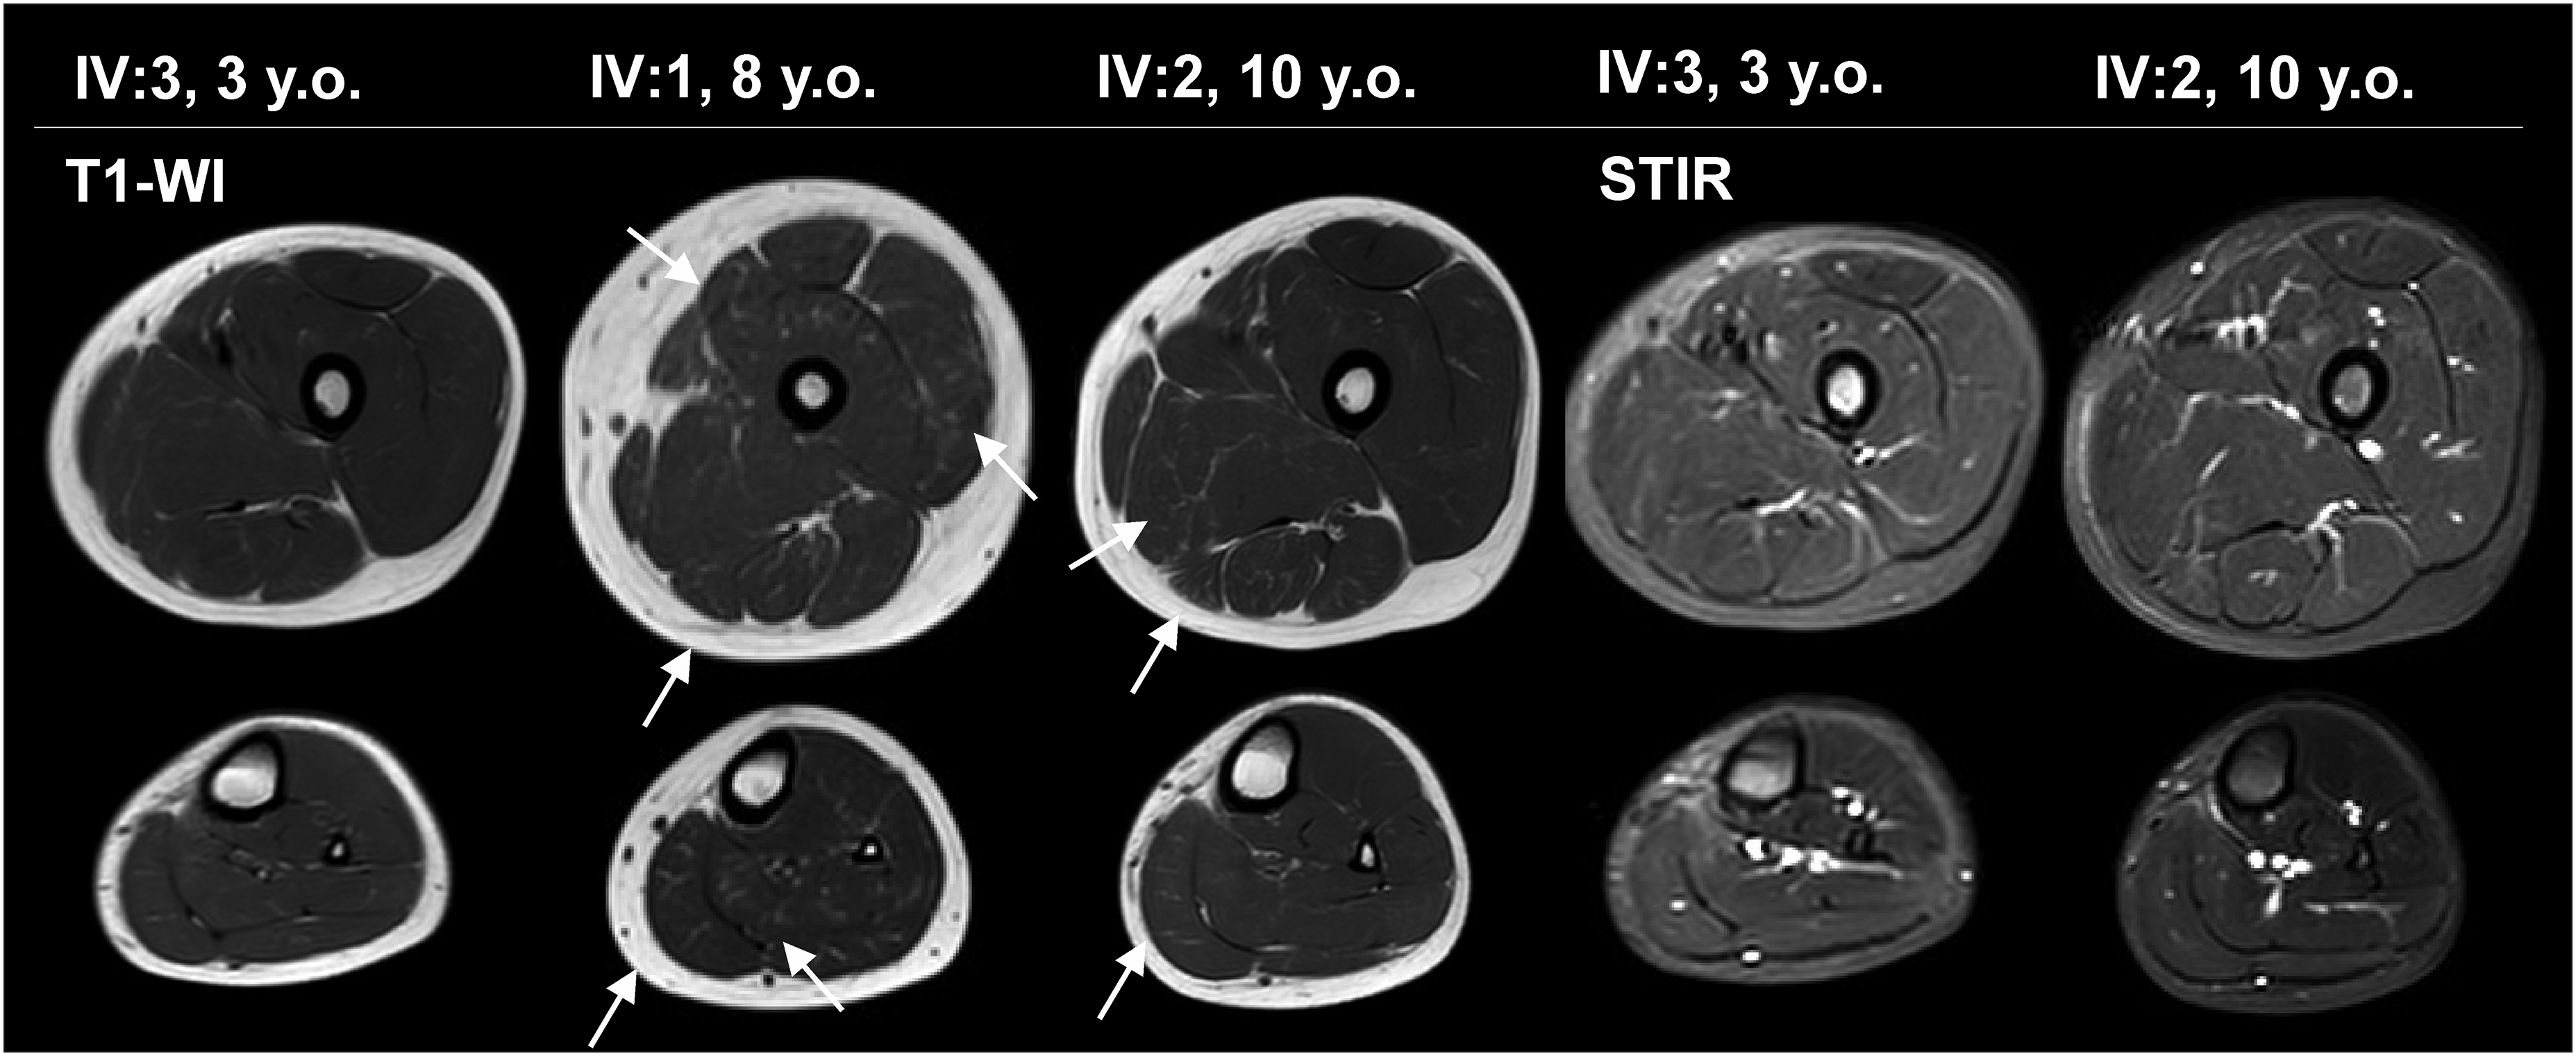
MRI (T1-WI and STIR) of the muscles of the thighs and lower legs of patients IV:14, IV:1, and IV:3. Arrows mark the areas of initial fat replacement.
Quantitative analysis of MRI of the pelvic muscles showed that the water T2 value did not differ from the norm, however, an increased FF was registered in the gluteal muscles (Student's t-test, t = 2.5; p = 0.01), in particular in the gluteus maximus muscle.
Among the muscles of the thighs, the level of water T2 is increased in m. quadriceps femoris (Student's t-test, t = 2.4; p = 0.017) without changing the FF in it. The water T2 value and FF in the posterior thigh muscles did not differ from the control group. A significant increase in water T2 values was found in the medial thigh muscles (Student's t-test, t = 3.7; p = 0.0006), in particular in m. adductor magnus and m. adductor longus. In addition, there is a tendency to increase the FF in m. adductor longus (Figure 6).
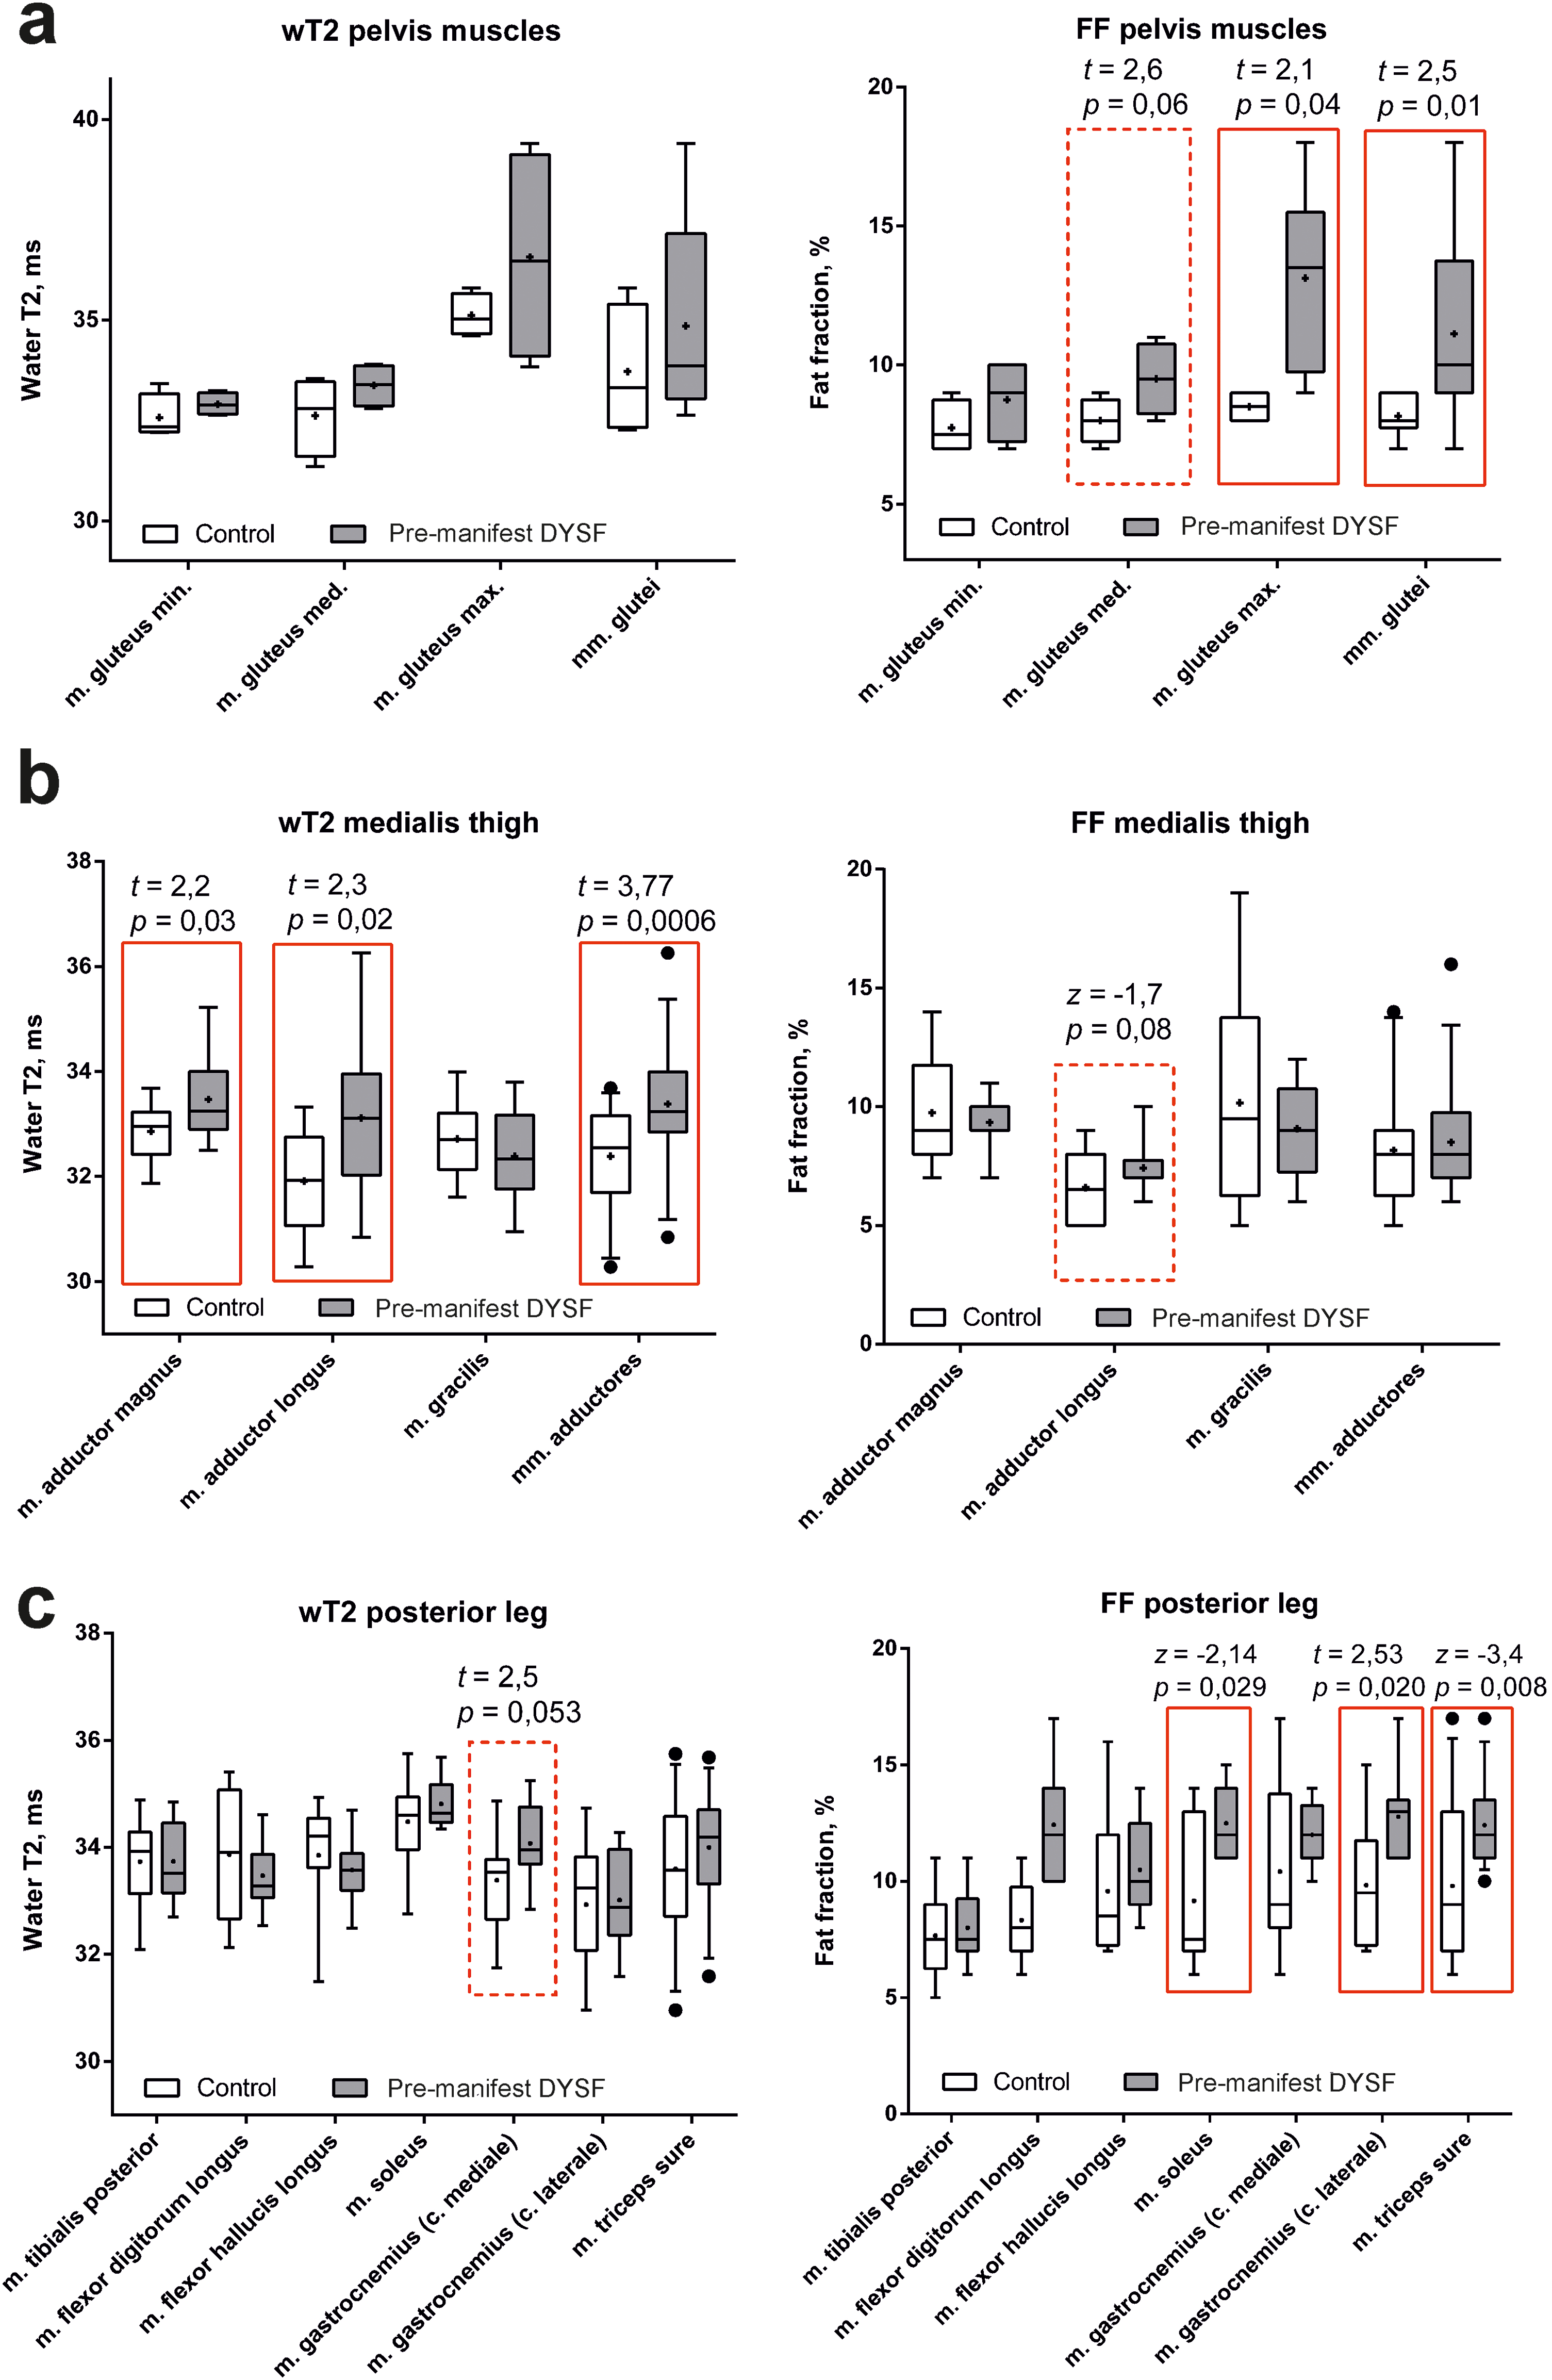
Quantitative MRI analysis (water T2 and FF) of the pelvis (a), medial thigh (b) and posterior leg muscles (c) in DYSF pre-manifest patients (gray box-plot) and the healthy volunteers (white box-plot). The red frame highlights the values that are statistically significantly different (p < 0.05). The dotted line indicates values that tend to differ.
There is a tendency to increase the water T2 value (Student's t-test, t = −1.7; p = 0.06) with a normal level of fatty infiltration in the anterior-medial leg muscles. A tendency to increase the water T2 value in m. gastrocnemius mediale, while the FF was higher than control group in the whole m. triceps sure (Mann-Whitney test, z = −3.4; p = 0.008), in particular in m. soleus and caput laterale m. gastrocnemii.
FF values in the anterior and medial thigh muscle groups of the asymptomatic patient (IV:3) were less than in oligosyptotic patients (Mann-Whitney test, z = −2.47; p = 0.009; z = −2.33; p = 0.016) . At the same time, T2W values were significantly greater in the anterior, medial and posterior thigh muscle groups in the asymptomatic patient than in the oligosymptomatic ones (Mann-Whitney test, z = −2.14; p = 0.03; z = −3.67; p = 0.002; z = −2.47; p = 0.016). There were no differences in the FF and water T2 values among the leg muscles.
Discussion
The previously described cases of the subclinical course of dysferlinopathy have been characterized by one unifying laboratory sign, hyperCKemia, in the absence of clinical symptoms that could lead to the patient seeking medical help. 32 The rarest variant of the subclinical course is isolated hyperCKemia, which is not accompanied by any clinical and instrumental signs, with the exception of a decrease or absence of dysferlin on immunohistochemistry of muscle biopsy.32,33 However, in most published cases of hyperCKemia, the presence of a number of other clinical and instrumental signs indicating the persistence of the dystrophic process is mentioned, such as pain and fatigue in the calf muscles, 34 hypertrophy of the calf muscles, 35 episodes of acute weakness and darkening of urine that occur after significant physical exertion and regress after 1–4 months,32,36 rhabdomyolysis complicated by acute renal injury without muscle weakness and pain, 37 increased signal intensity in the posterior leg muscle group on T2-WI and STIR MRI,9,34 and gastrocnemius muscle atrophy on computed tomography (CT) imaging. 35 Thus, some of the subclinical patients correspond to the oligosymptomatic forms characterized, in addition to an increase in CK, by other insignificant clinical and instrumental manifestations of dysferlinopathy.12,38 The average duration of the subclinical stage is 18.5 (15.5; 28.0) years,9,32–36,38–43 and ranges from 10 33 to 50 years. 9 Thus, the term subclinical patient used in the literature includes asymptomatic and oligosymptomatic cases, which are essentially the pre-manifest stage of dysferlinopathy.
The difficulty of detecting pre-manifest cases, along with their genetic heterogeneity, complicates research efforts to understand the sequence of disease development.9,10 Based on the age-related distribution of clinical signs and symptoms in this case series, we propose the following two variants of the pre-manifest stage of dysferlinopathy:
Asymptomatic state (at age 3): Laboratory detectable myocytolysis syndrome, based on minimally expressed isolated hyperCKemia (<1.5 × the upper limit of normal (ULN)) and increased LDH levels, based on patient IV:3 (3 years old).
Oligosymptomatic state (at age 5–14 years): Laboratory detectable myocytolysis syndrome, based on elevated CK (2.7–12.6 × ULN), LDH, ALT, and myoglobin; minimal signs of fatty muscle infiltration corresponding to E. Mercuri stage 1 in the anterior and medial thigh muscle groups and the posterior leg muscle group; shifting the center of support to the hindfoot and reducing the support surface of the forefoot; the appearance of the first complaints of fatigue of the posterior muscle group of the legs during physical activity; objective signs of a slight decrease in muscle strength, often in the neck flexors, forearms, leg flexors, and foot extensors; decreased Achilles and, less commonly, knee tendon reflexes; based on patients: IV:15 (5 years old), IV:20 (6 years old); IV:1 (8 y.o.), EIII:4 (8 y.o.), IV:14 (10 y.o.), IV:2 (10 y.o.), and III:22 (14 y.o.).
Thus, for pre-manifest cases, there are laboratory changes that suggest the development of muscular dystrophic and necrotic processes in patients with dysferlinopathy. Moreover, the earliest changes were noted at 3–5 years old, before the appearance of clinical symptoms.
These variants of pre-manifest dysferlinopathy are supported by descriptions of other cases in the literature. HyperCKemia accompanied by an increase in LDH up to 1.3 × ULN was observed in a 3-year-old patient (IV:3). The level of CK in a IV:3 patient with asymptomatic state was statistically lower than in patients with oligosymptomatic state (one-sample Wilcoxon test, z = 2,4; p = 0,02). In three cases of congenital dysferlinopathy, which presented with hypotonia at birth and muscle weakness of the neck flexors and proximal lower extremities, CK levels were 200 U/L in the 2-year-old, 241 U/L in the 3-year-old of CK, 6 and 748 U/L in the 2.5-year-old. 7 The similarity of CK levels between asymptomatic and congenital cases is likely explained by increased sarcolemmal permeability in the absence of the dysferlin in both forms. However, the number of necrotic fibers is possibly greater in the congenital phenotype than in asymptomatic ones. In the described cases of isolated hyperCKemia (at ages 2, 3, 10, and 12 years) 33 and congenital forms of dysferlinopathy, edema and fatty infiltration were not detected on MRI of muscles.6,7
The level of CK and myoglobin was noted in our case series to increase in proportion to body mass index during ages 3–14 years, reaching a maximum of 2,149 U/L in patient III:22. Previously reports of patients aged 11–12 years, at the pre-manifest stage, reveal a wide variability of hyperCKemia from 1,439 40 to more than 30,000 U/L, 41 with an average CK value of 5,503 (3,281; 7,945) U/L.11,32–37,40,43 This variability of hyperCKemia is likely attributable to the varied degree of muscle breakdown between patients.9,34,35
A thorough clinical examination in patients 6–8 years old at the oligosymptomatic state also revealed a slight decrease in muscle strength, similar in distribution to congenital forms of dysferlinopathy.6,7 There was also a decrease in Achilles reflexes compared to knee reflexes. A special feature of the patients described here was the symptom of home shoes, 25 which was previously identified in the manifest forms of Miyoshi myopathy (from 15–18 years old). This symptom is caused by weakness in the posterior muscle group of the legs, which leads to rapid wear of the sole of the rear of the shoe. However, in our patients, weakness in the gastrocnemius muscles was not revealed. At the same time, when performing digital plantography, the displacement of the center of gravity to the back of the feet was determined, which may explain the presence of this symptom at the pre-manifest stage.
Patients aged 8–10 years old were distinguished by the appearance of minimal subjective signs. There were complaints of calf fatigue from the age of 8, and two patients (EIII:4 and IV:2) also had a feeling of swelling and soreness of the calves after exercise. The difficulty of identifying these symptoms is due to their minimal severity, dependence on physical activity, and fluctuating nature. 34
Hypotrophy of the gastrocnemius muscles was not detected in any of the patients here at the pre-manifest stage. Whereas in the previously described patients from Saudi Arabia, aged 10 and 12 years, symmetric atrophy of the calf muscles was observed, along with slight weakness in the younger siblings, accompanied by a decrease in the MUAP amplitudes on EMG. 33 The CK values in both cases were significantly higher, at 3,087 and 1,509 U/L, than in our patients here. In both cases, the results of muscle MRI (T1-WI) are regarded as normal, probably due to the limited technical capabilities of the low-field MRI scanner. 33
MRI did not reveal fatty infiltration and muscle edema in our 3-year-old patient with isolated hyperCKemia, which agrees with a previously-described 3-year-old pre-manifest case 33 and patients with congenital dysferlinopathy.6,7 In our patients aged 6–14 years, in addition to hyperCKemia, minimal MRI signs of fatty infiltration were found, corresponding to E. Mercuri stage 1, in the absence of edematous changes. These features suggest that an increase in the level of CK in dysferlinopathy is more likely due to increased permeability of sarcolemma, than an increase in the number of necrotic muscle fibers. 44 This is confirmed by the results of morphological studies of muscles, which describe single necrotic fibers mainly in the gastrocnemius muscles, 34 with a complete absence or significant decrease in the amount of dysferlin in muscle biopsy.6,12,36,38,42,45 Therefore, immunohistochemical analysis of muscle biopsy is an effective method for diagnosing dysferlinopathy in 1.5% 46 – 18.4% of cases of asymptomatic hyperCKemia.12,41,45
Some have posited that MRI is a sensitive method for detecting changes in muscle tissue years before the onset of the disease, 47 while in asymptomatic patients, the presence of edema may be the earliest sign of disease activation. 33 The edema is diffuse in nature with areas of more significant amplification of the STIR signal in the posterior, medial, and anterior thigh muscle groups, and the posterior leg muscle group.34,37 This feature was also observed in the case of congenital dysferlinopathy in a 5-year-old patient. 6 Along with a sharp increase in CK during the period of activation of the disease, he developed MR signs of edematous changes in the posterior group of the muscles of the thighs and calf muscles, in contrast to his sister, who was at the pre-manifest stage of dysferlinopathy for 2 years. 6
Quantitative MRI assessment revealed an increase in the water T2 value and FF in some muscles with or without minimal signs of damage according to the qualitative analysis of MRI. 23 Increased water T2 in muscles supports its role of biomarker of disease activity, what was found in patients with dystrophinopathy 48 and GNE myopathy. 49 In pre-manifest patients with dysferlinopathy, the muscles with increased water T2 are not exactly the ones with the earliest fatty replacement. Surprisingly, we found an increase in fatty infiltration in the gluteus maximus muscle, although it is affected quite late in dysferlinopathy.
However, the disadvantage of our study is small sample and lack of diversity of causative mutations. The inclusion of only pediatric patients in the study does not allow extrapolating the conclusions to subclinical adult patients. Further longitudinal research is needed on the pathogenetic mechanisms that underlie the slowly progressive muscular-dystrophic process of dysferlinopathy.
Mutations in the DYSF gene, despite the relatively late phenotypic manifestations, leads to degenerative-dystrophic changes in skeletal muscle tissue from early childhood. Quantitative analysis of muscle MRI confirmed the presence of early signs of muscle damage such as an increase of water T2 and FF. Based on the results of this case series, along with support from the literature, we propose two states of pre-manifest dysferlinopathy. Taken together, asymptomatic (isolated hyperCKemia) and oligosymptomatic patients form a single continuum disease progression.
Footnotes
Funding
The author(s) disclosed receipt of the following financial support for the research, authorship, and/or publication of this article: The study was supported by the Ministry of Science and Higher Education of Russia, agreement No. 075-15-2021-1346
Conflict of interests
Pierre G Carlier is an Editorial Board Member of this journal, but was not involved in the peer-review process nor had access to any information regarding its peer-review.