
Abstract
Background and aim
The Timed Up and Go (TUG) test is one of the most widely used assessments. This study investigated the psychometric properties of the observed step count during this test performed by experienced physiotherapists, using video recordings of healthy adults.
Methods
In this cross-sectional study two physiotherapists independently observed video recordings of healthy participants completing the TUG twice, and obtained step count and the time taken to complete the TUG. For the intra-rater reliability, the step count observation was repeated after 10 months. ICC and Bland Altman plots were used to analyse the intra-and inter-rater reliability. Spearman correlation coefficient was used to investigate the correlation between step count and time taken.
Results
Thirty-six recordings from 31 healthy adults were analysed. The median step count across both raters and rating sessions was 12. The intra-rater reliability for step count was 0.924 (95% CI: 0.874 to 0.954), whereas the inter-rater reliability was 0.857 (95% CI: 0.730 to 0.919), the minimal detectable change (MDC) was 0.51. The correlation between the time taken and the average step count was rho = 0.71 (p < 0.001).
Conclusion
The results indicate that the observed step count during the TUG in healthy adults using video recordings is reliable and is positively correlated with the time to complete the test. With an MDC of 0.51 steps, a change of more than one step confidently reflects a real change in performance, beyond measurement error. Further research should explore this outcome parameter in individuals with irregular and unpredictable gait patterns.
Keywords
Introduction
The Timed Up and Go (TUG) test is widely used as a performance-based measure of mobility in clinical practice, home-settings and research.1–4 Minimal equipment is required, it is simple to conduct1,2 and it is, for example, recommended for neurological physiotherapy entry-level education in Austria. 5 The TUG test assesses functional mobility by asking a person to stand up from a chair, walk three meters, turn around, walk back to the chair and sit down again 6 and is therefore a commonly used measurement tool in different disorders, for example in people with Parkinson’s Disease (PD). 7 Although nowadays the test is often recorded with wearable sensors, it is still relevant to assess its validity with measures available in the clinic, such as the observed step count using video analysis. Therefore, the observed step count during the TUG could provide a gold standard against which wearable sensors can be validated. The standard outcome parameter is the time it takes to finish the task. 8 The inter-rater reliability for the TUG test duration is excellent with an intraclass correlation coefficient (ICC) of 0.96 for people aged between 20 and 59 years and normative values in these age groups are ranging from 8.6 to 9.9 s. The TUG is widely validated for different disorders like Multiple Sclerosis, 9 Alzheimer’s Disease, 10 with typical adults, individuals with cerebral palsy, Huntington’s disease, stroke or spinal cord injury. 6 It is also proven reliable in intra- and inter-rater analysis with ICC values within the 0.69–0.99 range in people diagnosed with PD. 11
Just focusing on the time taken during the TUG may lead to other aspects of movement quality being overlooked. It has been demonstrated during a modified TUG 12 and the 10-metre walking test 13 that the step count can provide additional information about step length, when the walking distance is known. The step rate can also be calculated if the number of steps taken and the time taken to complete the test are known, 14 which could help to identify subtle mobility limitations. For example, the number of steps is an important gait parameter which changes before and during Freezing of Gait (FOG) in people with PD. 15 Furthermore, it is currently impossible to specify which aspects of the TUG test did improve to achieve a better time, either getting up from or sitting down on a chair or walking or turning. Observed step count is established for other mobility assessments like the step test, where the rater counts the number of steps taken up a step for 15 s. 16 However, the psychometric properties of incorporating the observed step count into the standard TUG assessment have not yet been systematically investigated, highlighting the need for research in this area.
To our knowledge, no research has been conducted on the psychometric properties of the observed step count of the TUG. This study was conducted on a healthy population to obtain initial results with the purpose to conduct this study in the future on people with PD experiencing FOG.
Therefore, we aimed to evaluate the intra- and inter-rater reliability of the observed step count using video recordings of healthy adults performing the TUG. Two trained and experienced physiotherapists rated the videos observing the step counts twice, with the ratings taken 10 months apart. A previous study 17 showed that recall rates after 4 weeks may be sufficiently high to affect an intra-rater study design, and that longer intervals between ratings could reduce recall bias. Mischiati, Comerford 18 also found that extended intervals of several months are feasible. Additionally, the standard error of measurement (SEM) and the minimal detectable change (MDC) were calculated to evaluate the accuracy and sensitivity of this method. 19 The study also investigated the correlation between the mean step count and the time assessed by a third rater in a single rating session.
Methods
This study employed a cross-sectional design to evaluate the intra- and inter-rater reliability in accordance with the Guidelines for Reporting Reliability and Agreement Studies (GRRAS) framework to ensure transparent and standardized reporting. 20
Participants
To be included in the study, the participants had to be students or employees of the University of Applied Sciences, over 18 years of age, and able to walk 6 metres without the use of assistive devices. People experiencing acute pain while walking were not eligible to participate.
Sample size calculation
Key parameters for ICC hypothesis testing were established for the reliability analysis. The minimum acceptable reliability coefficient was set at 0.75, and a reliability of 0.90 was expected. The statistical parameters included a significance level (α) of 0.05 using a two-tailed test and a power of 80%. The study design incorporated two raters and repetitions per subject. Based on these specifications, the required sample size was calculated to be 33 subjects (Afrin, 2025).
Recruitment
This study was conducted as part of the elective ‘Research in Physiotherapy’ course in a Bachelor’s degree program in Physiotherapy at a local University of Applied Sciences in Austria. Students enrolled on the course acted as student researchers and were involved in the development and execution of the project, overseen by the course lecturer and lead researcher. Participants were recruited via email, and were provided with detailed information about the project, as well as the opportunity to actively opt-in via an online form. Information about the project was also disseminated in lecture rooms, and individuals could opt-in to participate during the 2-day data collection period on campus.
Ethics
Prior to the project’s commencement, the Ethics Committee of Lower Austria confirmed that a formal ethics vote was not required due to the study’s low risk and anonymous nature (GS1-EK-12/797-2024). The lead researcher provided all participants with detailed information about the study and gave them the opportunity to ask questions. The study was conducted in accordance with the principles of the Declaration of Helsinki. Written informed consent was obtained from all participants.
Data collection
All the data was collected over the course of two testing days in May 2024. After confirming the inclusion and exclusion criteria, information on age, self-reported gender and height was collected. Participants performed the TUG test twice, with each trial recorded on video. Two student researchers oversaw the TUG assessment. To avoid bias, the lead researcher did not actively participate in this process, as this person acted as one of the two raters in the video analysis.
The TUG was performed using the following procedure: Participants began seated in a standard chair with full back support, their feet flat on the floor and their arms resting on the armrests. When instructed to ‘Go’, they stood up from the chair, walked 3 metres at a comfortable and safe pace, turned around at a designated marker, returned to the chair and sat down again. 21
In accordance with the General Data Protection Regulation, 22 the decision was made to restrict the video recording to the participants’ legs alone, in order to avoid revealing any personal information and minimise the amount of data collected. The removal or covering of any objects that could indirectly identify individuals, including jewellery and tattoos, was mandatory.
Video analysis – First rating session
For the inter-rater reliability, the observational step count analysis was conducted by two physiotherapists who participated as raters. Both raters did not actively participate in the video recordings and were physiotherapists with over 15 years of clinical experience and over 10 years of teaching experience in the bachelor’s degree program in physiotherapy.
Prior to analysing the video recordings, the two raters reached a consensus on the defining characteristics of a step for observing step count during walking and turning. The focus of the step count observation was placed on the feet and not the rest of the body. The following was agreed upon: A step is counted when a foot in an upright, vertical body position (i.e. standing) is either completely lifted off the ground (e.g. stepping while standing) or when the entire foot changes position in any direction (forward, backward or sideways), even without being completely lifted of the floor. Alternating the weight from left to right or forwards and backwards while standing without moving or lifting the feet is not a step, nor is moving the foot while sitting.
The video recordings were obtained using the integrated video recording functionality of a gait analysis software (STAPPONE Research by StAPPtronics GmbH). An external camera was connected to the laptop and positioned on a tripod at a 2-meter distance at which the 3-meter walking distance for the TUG was recorded in a lateral view.
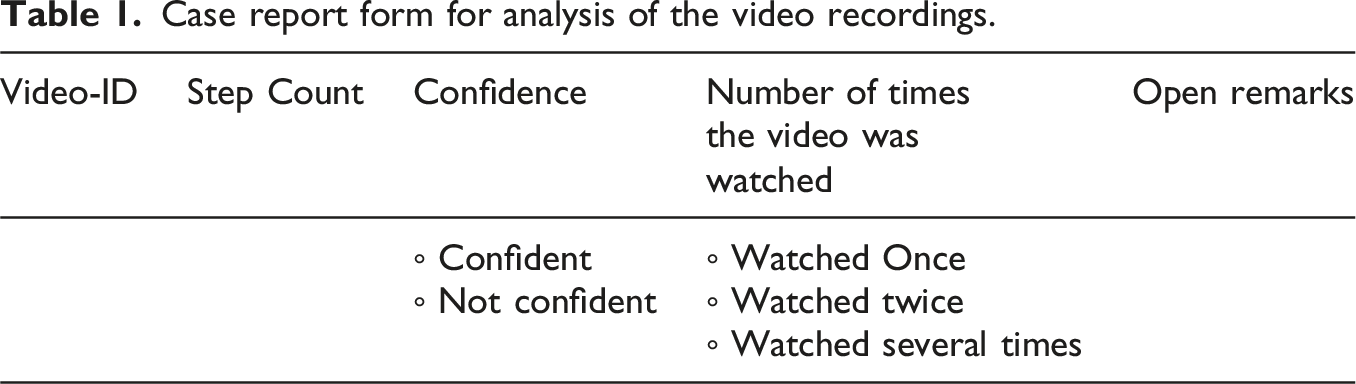
Case report form for analysis of the video recordings.
Furthermore, for the correlation analysis an independent Rater 3, a physiotherapist with 4 years of clinical experience documented the time in seconds required by the participants to complete the test using video recordings. This was achieved by means of ELAN, an open-source software program that facilitates the annotation of audio and video recordings. 23
Video analysis – second rating session
To assess intra-rater reliability, a second rating session focusing solely on observing step count was conducted, using the same video recordings as in the first rating session. Raters 1 and 2 conducted their step count analyses independently, 10 months after the initial analysis. This was done, as a previous study 17 showed that recall rates after 4 weeks may be sufficiently high to affect an intra-rater study design, and that longer intervals between ratings could reduce recall bias. Mischiati, Comerford 18 also found that extended intervals of several months are feasible.
Analysis
Following data collection, files were checked if they could be viewed properly. After the first rating session the assessors’ open remarks were checked for reasons for further exclusion.
The quantitative analysis was done with IBM SPSS Statistics, Version: 29.0.0.0 (241). The step count data of the remaining videos was assessed for normal distribution with Shapiro-Wilk test and analysed using SPSS to evaluate intra- and inter-rater reliability through the calculation of the ICC for two-way mixed effects model and single measures according to GRRAS. 20 The definition for interpretation are used according to Koo 24 , with good correlation between 0.75 and 0.90, and excellent correlation above 0.90. The results were visualised using a Bland-Altman plot. This plot can be used even when the data was not normally distributed, provided that the 95% confidence intervals (CI) for the limits of agreement are also reported, thereby improving clarity and reliability. 25 The SEM and MDC were calculated based on the inter-rater reliability of the observed step count across both rating sessions. The SEM was derived using the standard deviation (SD) of the number of steps and the ICC, reflecting the variability between raters. 19 The smallest change that exceeds measurement error with 95% confidence, or the MDC, was calculated as the SEM multiplied by 1.96 and the square root of two. 19 Due to the asymmetrical distribution of the data, the Spearman rank test was calculated to assess the correlation between the time taken and the step count. Quantitative data on confidence and the number of times the video was watched were analysed descriptively.
Results
In this study, 31 participants (self-reported gender: 12 women/9 men) were included. The participants had a median age of 22 years (range: 18–43) and a median height of 174 cm (range: 158–190 cm). Each participant performed the TUG twice, resulting in 62 video recordings.
Of the initial 62 files, three (4.8%) were technically disrupted and had to be excluded from the subsequent analysis. During the first video analysis rating session, Rater 1 and Rater 2 analysed the remaining 59 video recordings. Rater 3 analysed the videos regarding the time taken to complete the TUG.
Out of 59 videos, 22 (37.3%) were excluded due to the subject ‘stepping outside of the frame’ documented as an open remark by one or both raters. One video had technical issues (1.7%) and received the remark ‘missing’. Thirty-six videos (61%) of the 59 remained for the statistical analysis.
The process of data collection, exclusion of data files, video analysis, and quantitative analysis are visualised in the Flow Chart (Figure 1). Flow Chart of data collection and analysis and process of exclusion.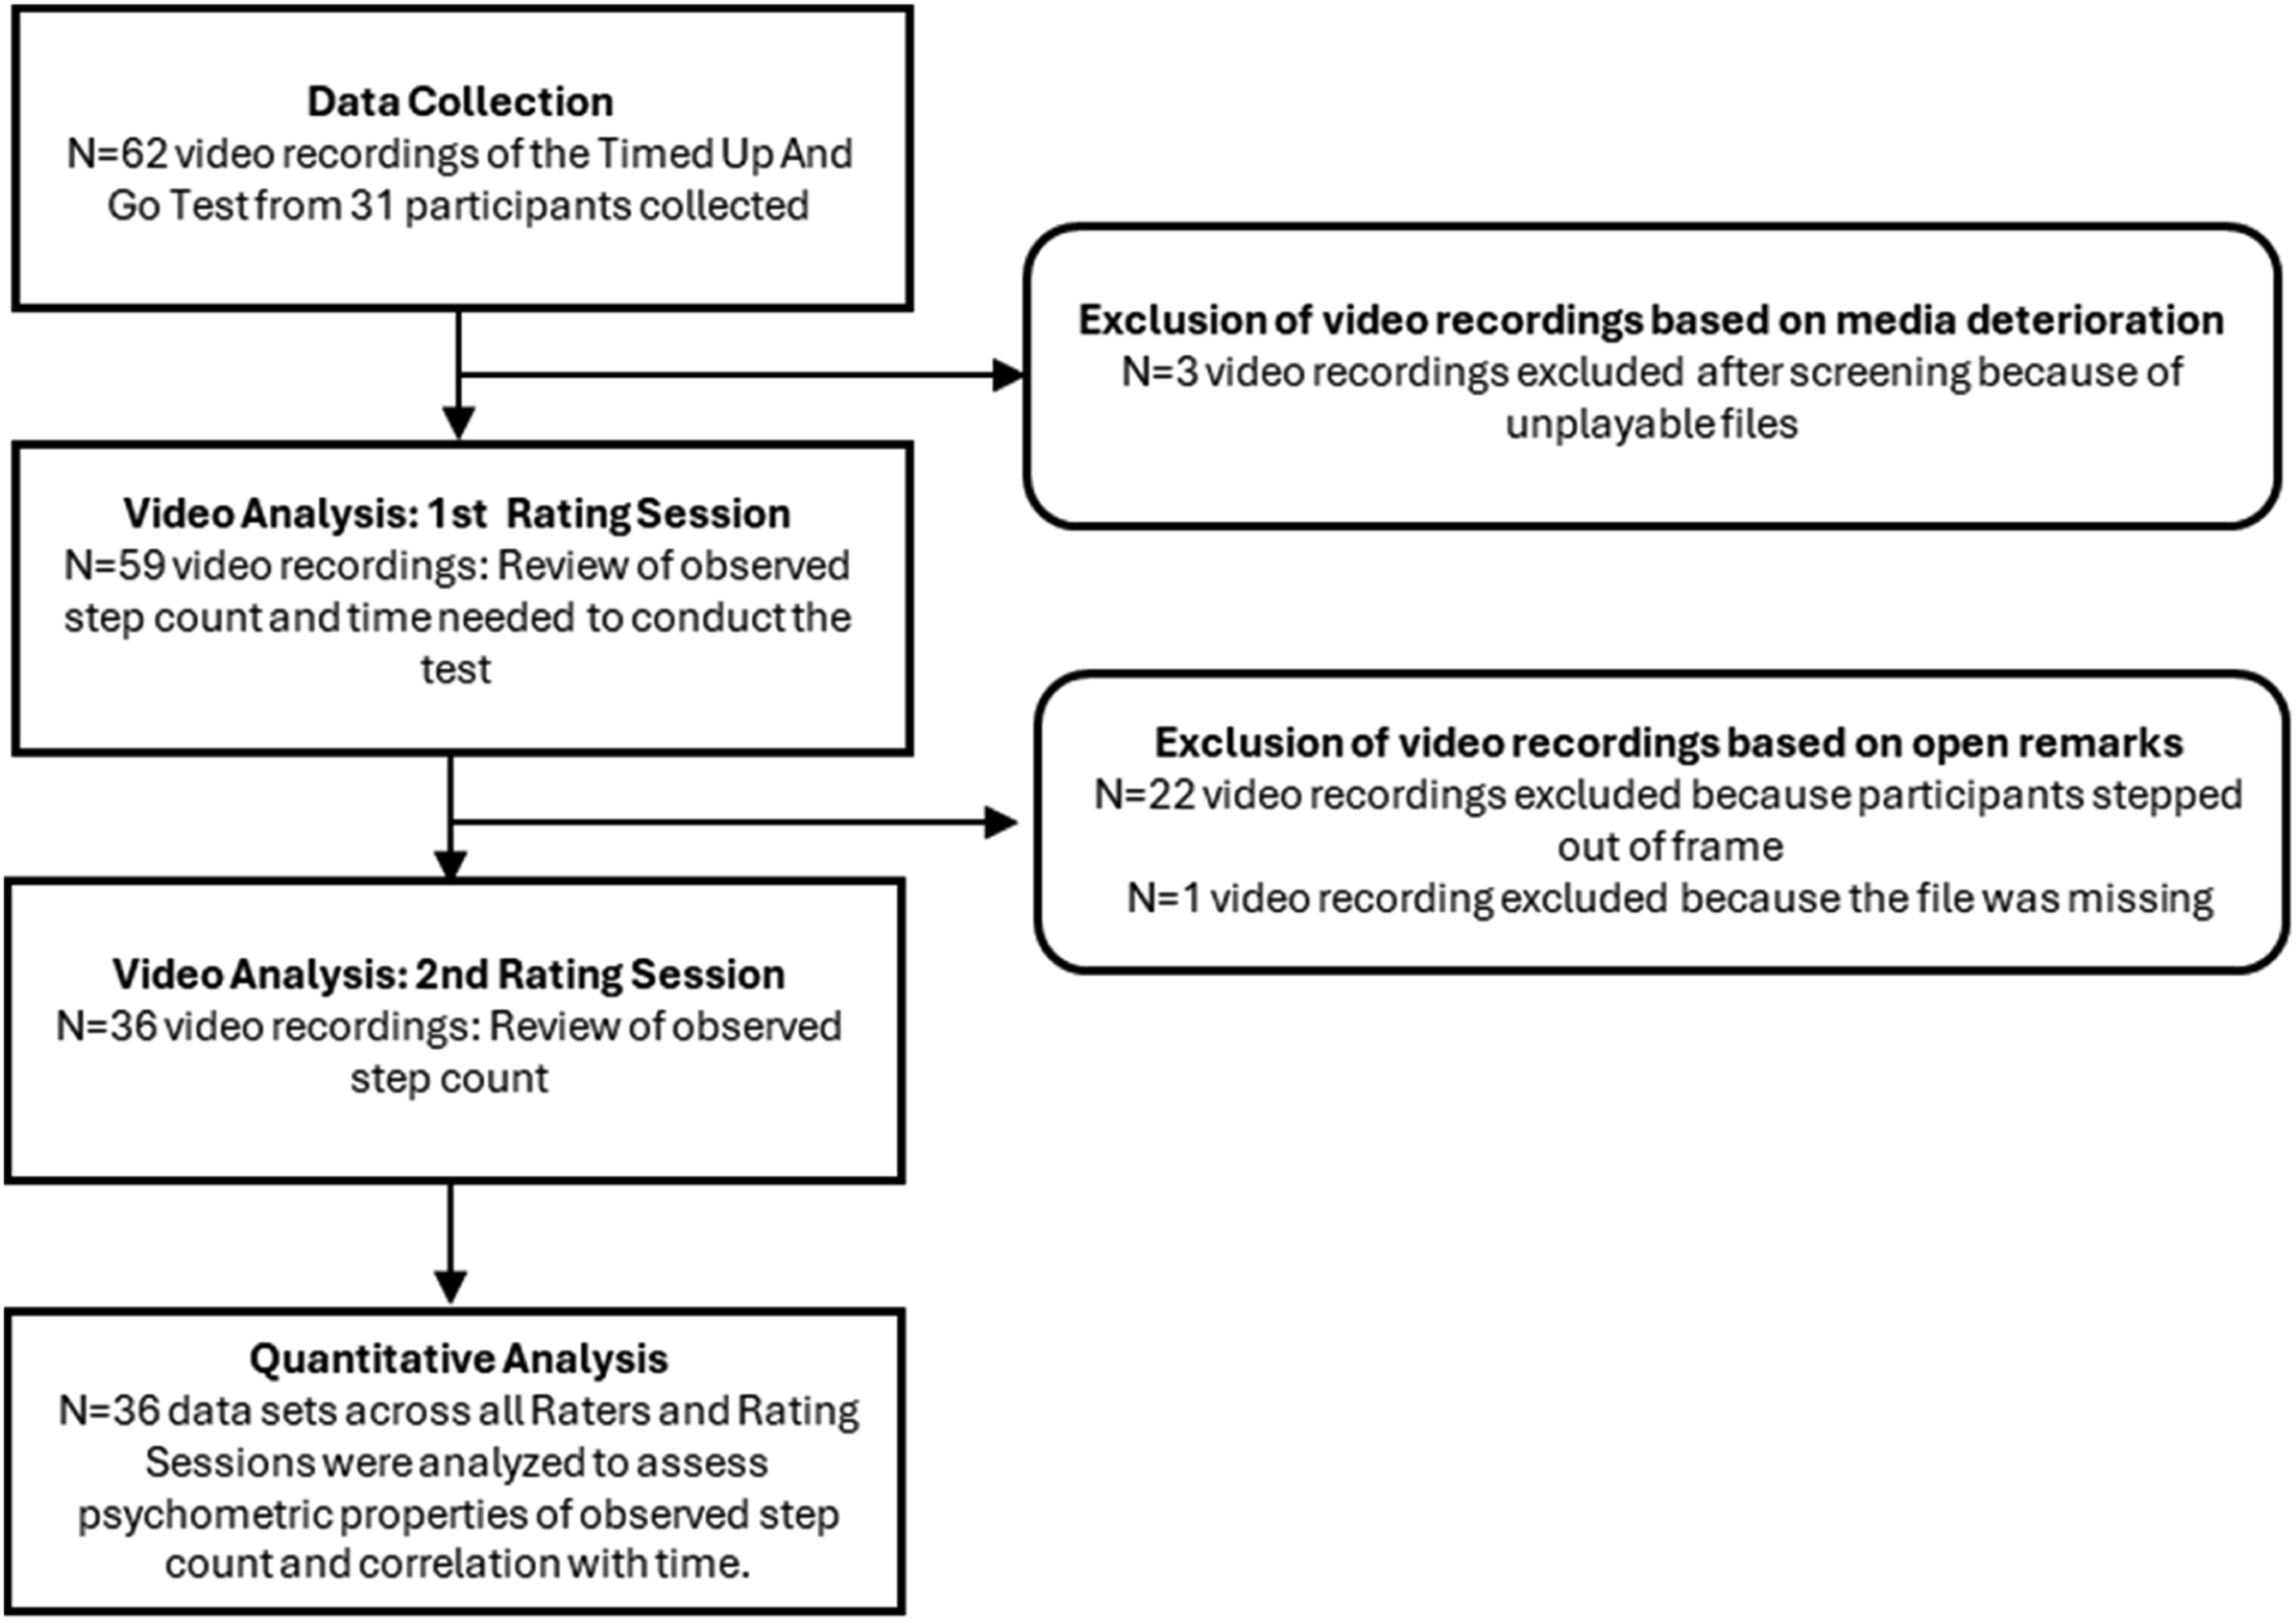
In average both raters were 86.1% confident with their observed step count and did watch the videos in 55.6% once, 34.7% twice and 6.9% more the two times. Detailed analysis showed a difference in the times the videos were watched between the raters (Twice or more than two times; Rater 1: 80.6%/Rater 2: 8.3%). Of the 27 videos watched more than once by Rater 1, 13 received the open remark ‘sliding with the heel’. Rater 2 watched three videos more than once, and two of these received the open remark ‘short step at the end’. The other video recordings watched more than once did not receive any open remarks.
Intraclass Correlation coefficient, two-way mixed effects model for intra-and inter-rater reliability of the step count.
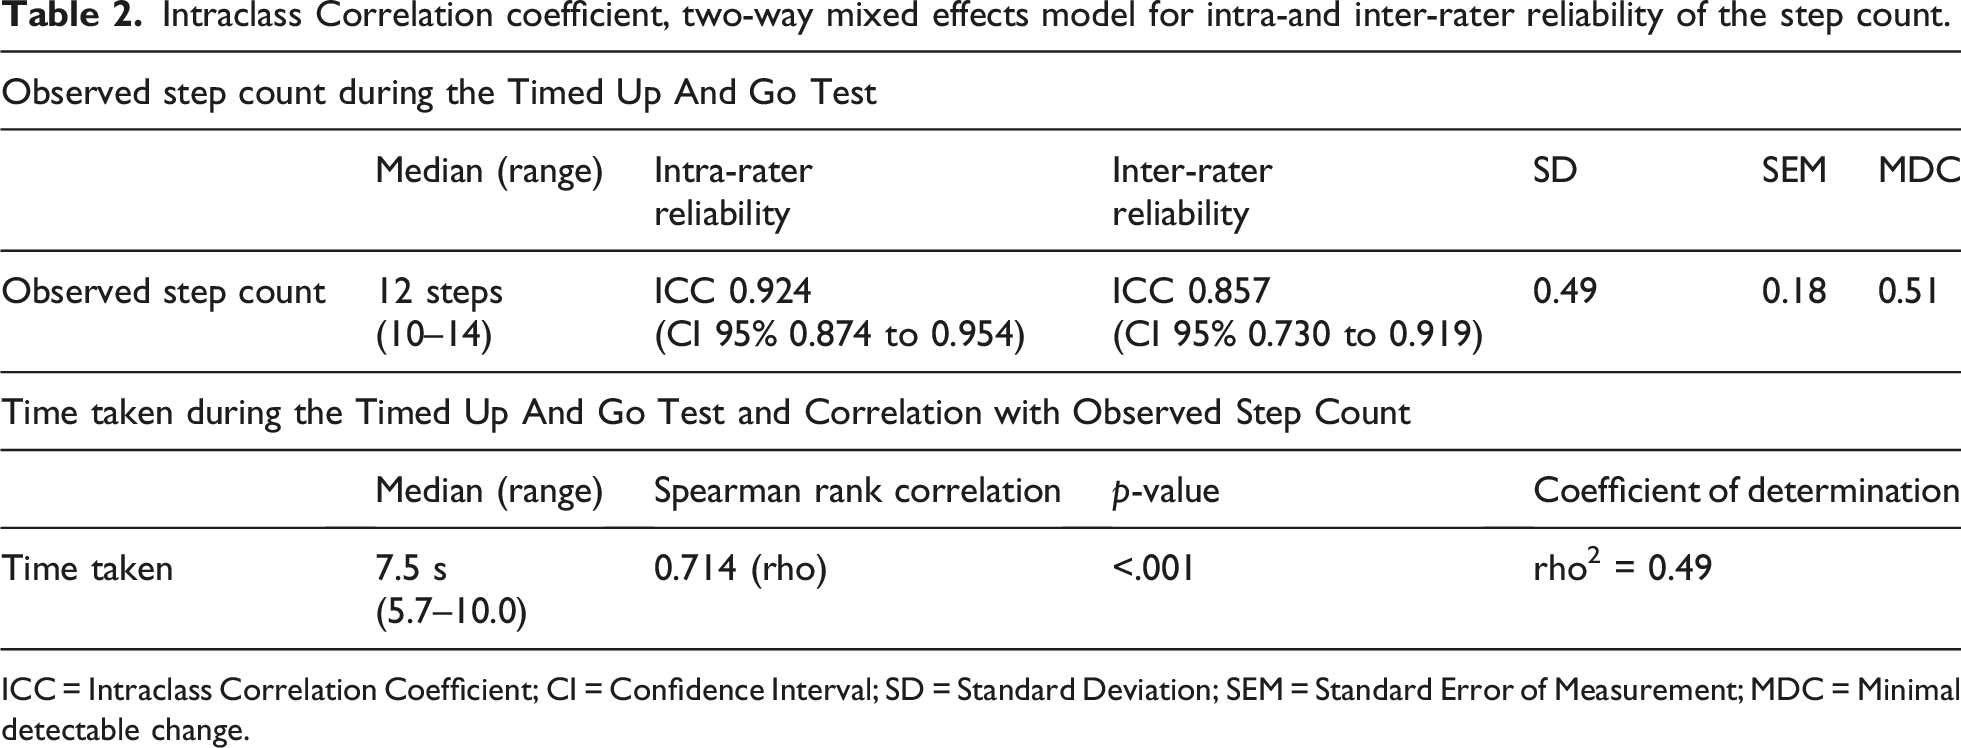
ICC = Intraclass Correlation Coefficient; CI = Confidence Interval; SD = Standard Deviation; SEM = Standard Error of Measurement; MDC = Minimal detectable change.
The ICC for intra-rater reliability was 0.924 (range 0.874 to 0.954), whereas the ICC for inter-rater reliability was 0.857 (0.730 to 0.919). Derived from the SD (0.49) and the ICC (0.857) from the inter-rater reliability the SEM was 0.18 steps and the MDC 0.51 steps. Please see Table 2 for more details.
The Spearman’s rank correlation coefficient showed a statistically significant positive correlation between time and observed step count during the TUG with 0.714 (rho) and a p-value of <.001. The coefficient of determination was rho2 = 0.49 (see Table 2).
The data for intra-rater (see Figure 2(a)) and inter-rater (see Figure 2(b)) reliability was visualised with a Bland-Altman plot, displaying the 95% CI. (a) and (b) Bland-Altman Plot: Intra- and inter-rater step count.(a) Assessment of agreement between two rating sessions; (b) Assessment of agreement between Rater 1 and Rater 2; Red continuous line = mean difference (a) between the two rating sessions (b) between the two raters. Green dotted lines = CI 95% = limits of agreement. Blue dots = individual differences (a) between the two rating sessions (b) between the two raters. There is an overlap of the dots, if the difference was identical.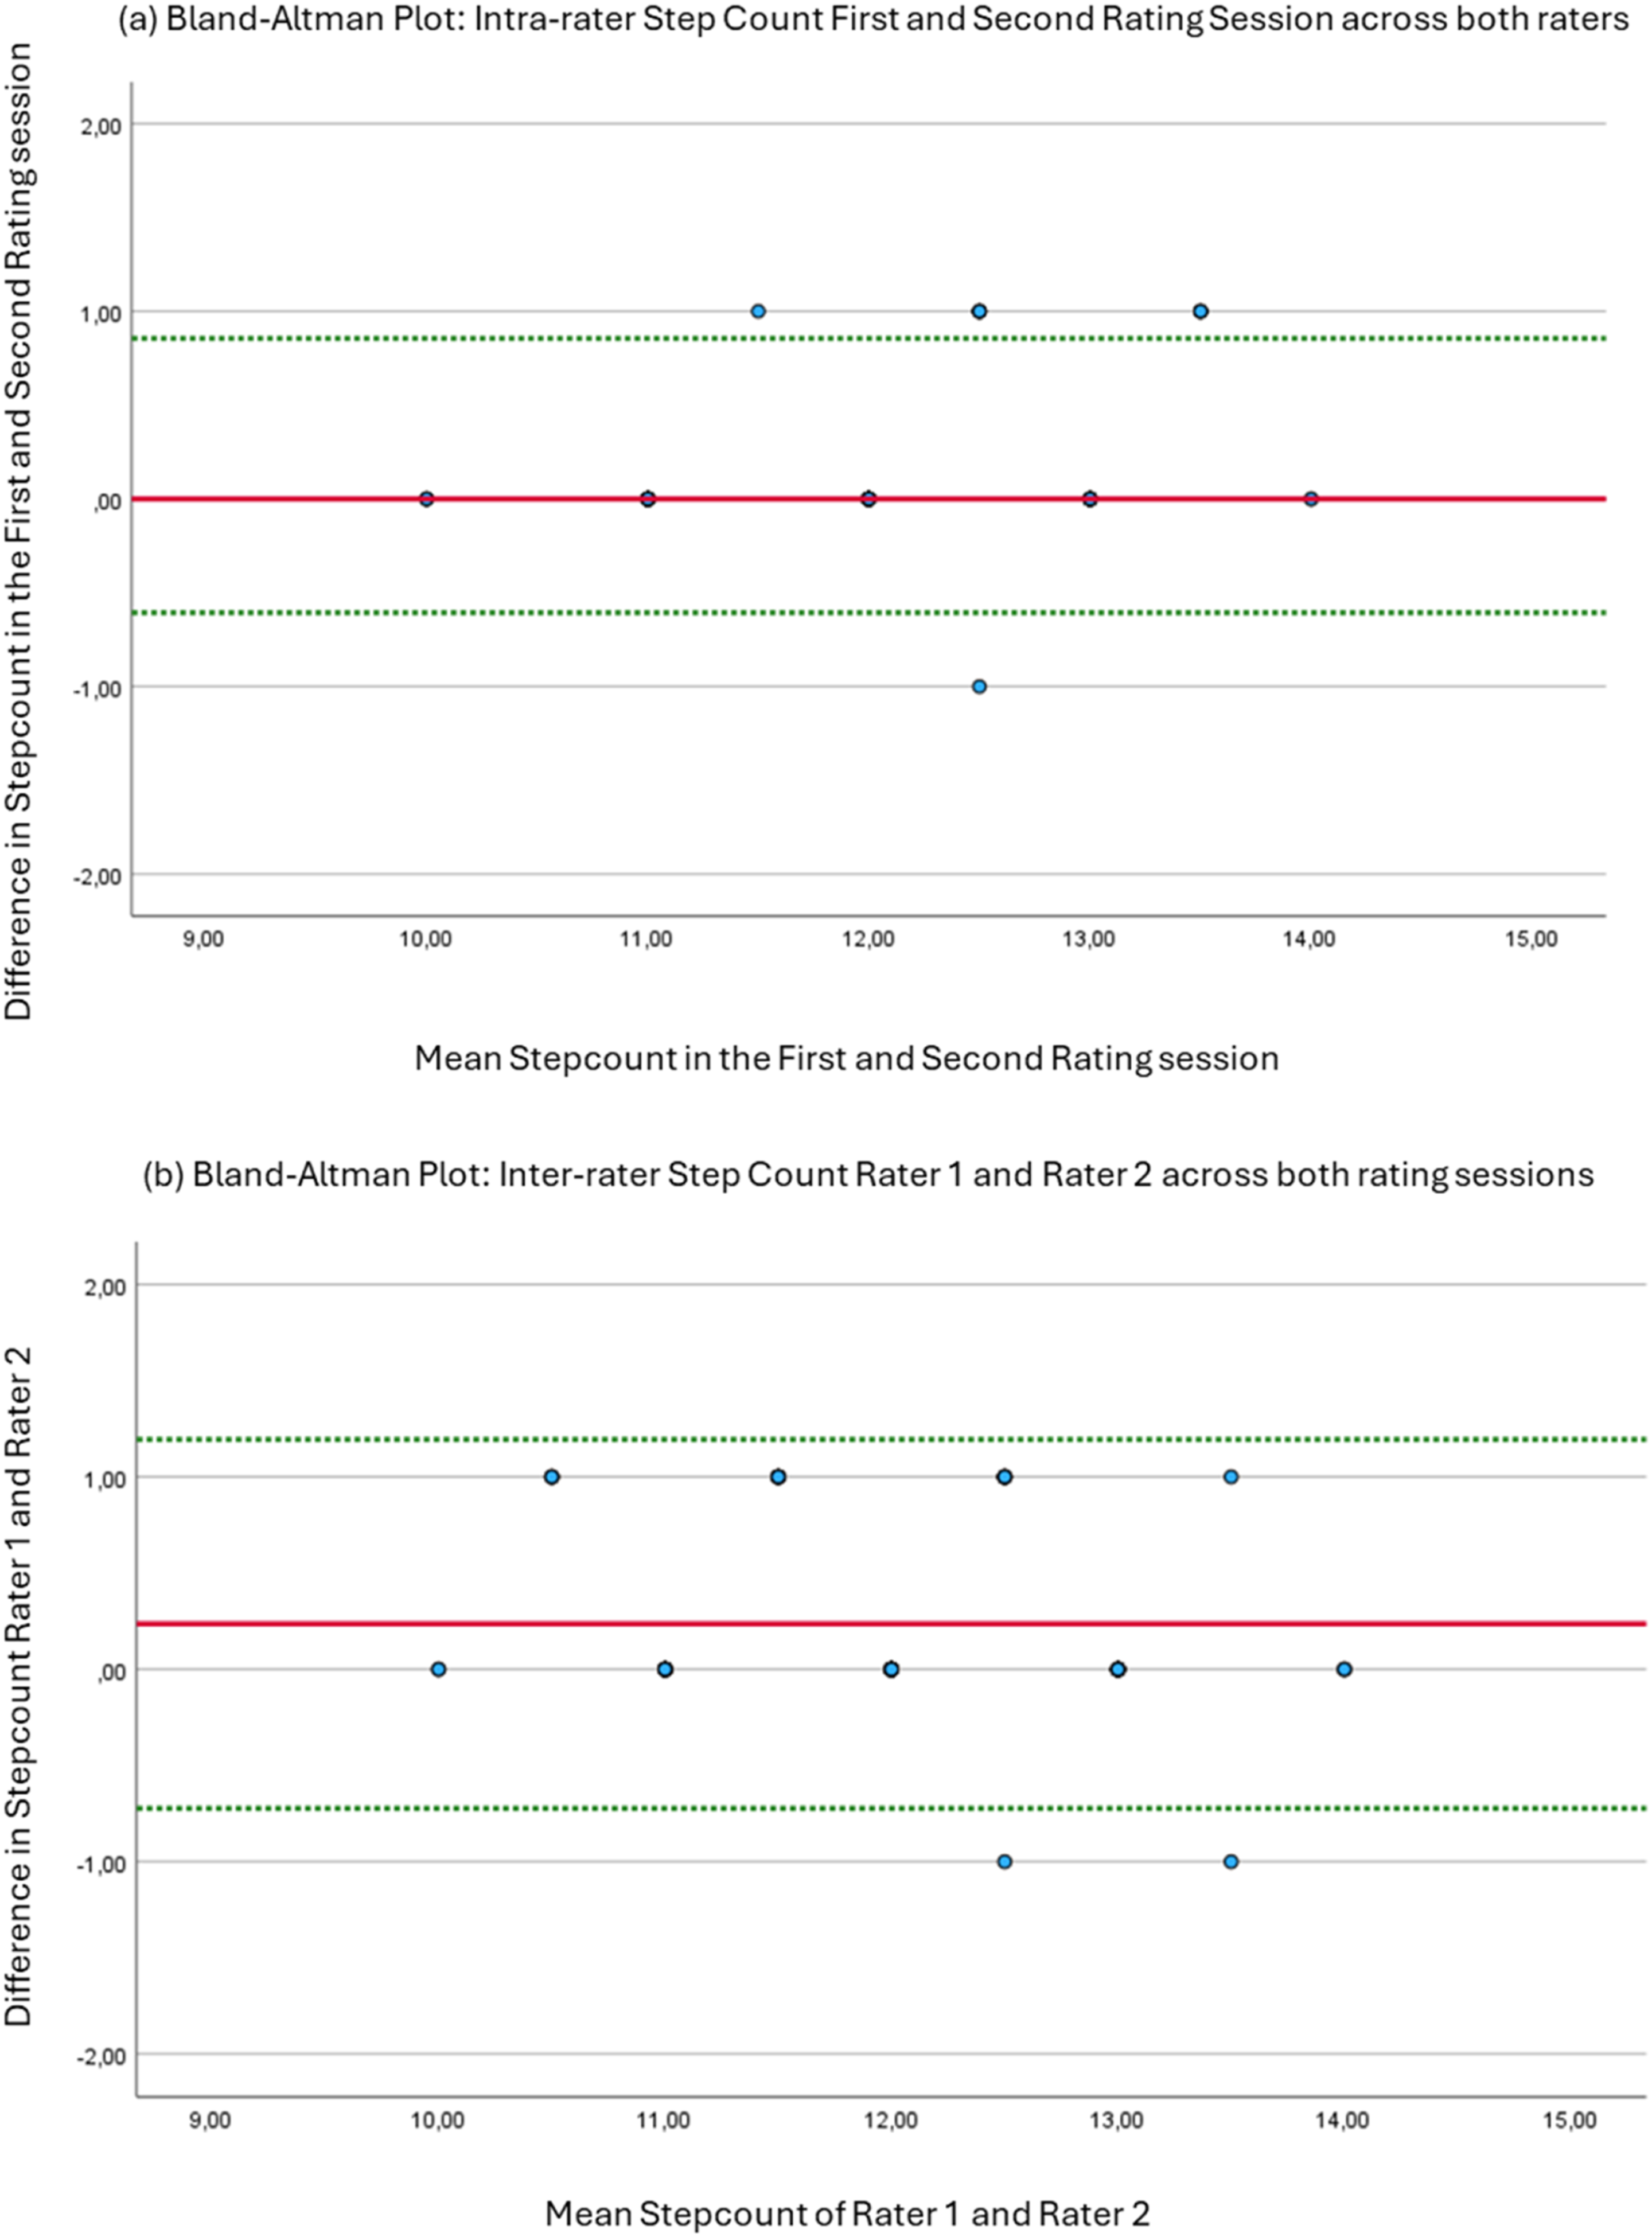
Discussion
The main objective of this cross-sectional study was to investigate the intra- and inter-rater reliability of observed step count using video recordings of the Timed Up and Go test performed by healthy adults and to correlate the time taken to the step count during the TUG. This study showed excellent intra- and good inter-rater reliability for the step count during the TUG. 24 The ICC values for the observed step count are similar to the intra- and inter-rater reliability regarding the time needed to conduct the TUG investigated by Kear et al. 8 Therefore, it can be assumed, that both parameters can be assessed during the TUG with comparable reliability. The Bland-Altman plot displayed for inter-rater and for intra-rater that the limits of agreement were narrow, with fewer than two steps in either direction for both intra- and inter-rater reliability. When differences in steps occurred between the raters, or between the two rating sessions, the difference was never greater than one step. This indicates a high degree of certainty that the correct number of steps lies within ±1.
The MDC, representing the smallest change that can be interpreted as a real difference beyond measurement error, rather than random variation, 19 is particularly valuable in clinical practice, to determine whether observed changes in a patient’s performance are meaningful. The MDC of 0.51 steps suggest that the step count during the TUG demonstrates high measurement precision. As there are no half steps, more than one step would need to be interpreted as a difference beyond the measurement error. These findings support the use of step counting via video analysis during the TUG.
To the best of our knowledge, no studies have established normative data on the observed step count during the standard TUG. In this study, involving young healthy participants, the median number of steps was 12. The minimum number of steps was 10, and the maximum was 14. According to Tudor-Locke, Han, 26 the walking cadence in healthy young adults is 100 steps per minute, which corresponds to 1.67 steps per second. The median time taken to complete the TUG in this study’s population was 7.5 s. This suggests that the estimated number of steps taken would be 12.5 steps. This finding is consistent with the median of 12 steps that was explored in this study. This data could be used as a first reference value for future studies looking at the observed step count during the TUG.
In this study, the median time needed to complete the TUG was 7.5 s with a range of 5.7 to 10.0 s. This reflects the normative data for the respective age group (20–30 years), with a median of 8.4 s and a range of 6.1 to 12.5 s. 8 This suggest that our sample was representative for its age, as the MDC for the TUG investigated in a study by in a population with total knee arthroplasty was 2.3 s.
The statistical significant positive correlation (rho) between time and the observed step count during the TUG aligns well with existing literature. 27 This is not surprising as walking speed can be determined by the product of step length and cadence. 28 The coefficient of determination (rho2 = 0.49) indicates that the variability in time explains 49% of the variation in step count. It can be therefore concluded that there is additional information in measuring the step count beyond measuring the time. Assessing and reporting both outcome parameters in combination may provide complementary insights into functional mobility evaluation and interpretation. This should be explored in different populations, such as people with PD who experience FOG, since their gait patterns are often irregular and unpredictable.
Before screening the data and observing the step count, both raters agreed on which key components to focus on when counting steps from video recordings. Accordingly, a step must be performed while standing upright and the entire foot must change position in any direction. This included shuffling, sliding the entire foot, taking side steps, and stepping backward. A step was also defined as lifting the entire foot off the ground, including stepping in place. This description agrees with the clinical definition of a step29–31 and is supporting the minimisation of data and the avoidance of direct identifiers, such as a person’s face due to the General Data Protection Regulation. 22 This definition could be used when assessing the observed step count in research and clinical practice, since a precise definition of a step is essential for ensuring consistency, accuracy and comparability in data collection and interpretation.
Limitations
This study was performed on young, healthy adults with no major gait deviations or walking disorders. Further studies are needed to evaluate intra- and inter-rater reliability, SEM and MDC in different populations with walking disorders, such as people with PD experiencing FOG.
The high dropout rate was a limitation as it reduced statistical power. However, the narrow CI regarding the intra- and inter-rater reliability suggested that the estimates were stable despite the reduced sample size. The dropout rate was mainly due to setup errors resulting in the inability to accurately count the steps based on the video recordings. It was recognised and reflected on that specific task instructions and setups are required for the TUG. For future studies the setup regarding the starting and the turning spot and the camera position should be more focused on, when using a two-dimensional lateral-view video gait-analysis like recommended by Michelini, Eshraghi. 32
A potential source of bias stemmed from the lead researcher’s involvement in randomizing the video recordings, observing step count, and analysing data, which could have influenced the study’s objectivity. This overlap in roles occurred due to limited time and staff resources. To reduce this risk, standardized procedures were implemented, and critical steps were documented to promote transparency and consistency.
Conclusion
The observed step count during the TUG using video recordings has excellent intra- and inter-rater reliability, and could therefore be used as an additional, reliable outcome parameter in future research and clinical practice. An MDC of more than one step enables to capture changes beyond the measurement error with high confidence. The high correlation between the observed step count and the time taken to perform the TUG suggested concurrent validity. Reporting both parameters may however provide complementary reliable insights into functional mobility evaluation and interpretation. Further research should explore the psychometric properties of the observed step count as an outcome parameter during the TUG in different populations.
Footnotes
Acknowledgements
We sincerely thank all the student researchers who participated in the elective course ‘Research in Physiotherapy’ within the Bachelor’s degree program in physiotherapy at the University of Applied Sciences in Krems, Austria. Their active involvement in conducting this study was essential to making this work possible. We also would like to thank all participants in this research study. Their contribution is greatly appreciated.
Ethical considerations
This study was conducted in accordance with the principles set out in the Declaration of Helsinki. Informed consent was obtained from all participants. Confirmation was received from the Lower Austrian ethics committee that no formal ethics application or vote was required due to the study’s low risk and the healthy volunteers involved (GS1-EK-12/797-2024).
Consent for publication
Not applicable. Participants were informed in the consent form that their data would be used anonymously for publication.
Author contributions
AW – The author made substantial contributions to the conception and design of the work; the acquisition, analysis, and interpretation of data; and drafted the manuscript.
TM – The author substantively revised the manuscript.
AN – The author made substantial contributions to the revision of the manuscript and contributed to the interpretation of data.
JJ – The author made substantial contributions to the conception and design of the work and substantively revised the manuscript.
PA – The author made substantial contributions to the conception of the project, study supervision and oversight, and substantively revised the manuscript.
All authors read and approved of the final manuscript.
Funding
The authors disclosed receipt of the following financial support for the research, authorship, and/or publication of this article: This study is funded through the NÖ Gesundheits- und Sozialfonds (NÖGUS) via a Dissertation Call at the IMC Krems University of Applied Sciences. The funding recipient is the first author AW.
Declaration of conflicting interests
The authors declared no potential conflicts of interest with respect to the research, authorship, and/or publication of this article.