



Abstract

With cost constraints in the healthcare system, the providers are under pressure to practice medicine more cost effectively. The laboratory is challenged to maintain services and improve efficiency. This article will show the steps one lab has taken to improve operating efficiency and the methods they used to achieve these improvements.
Minimize the Number of Instruments (Workstation Consolidation)
Over the past few years the laboratory has gone from 9 workstations in chemistry and immunochemistry to 4. In hematology and coagulation the laboratory has gone from 5 workstations to 2. This workstation consolidation allows a broad number of tests to be run on a few instruments. By doing this 78% of all the samples run and 88% of all the tests in the laboratory can be run on these workstations. By switching from older analyzers the new systems are more labor efficient using primary tube sampling and electronic programming of tests. Figure 1 shows the labor savings of 2.5 minutes per sample by switching drug testing from an older dedicated immunoassay analyzer to a new clinical chemistry analyzer. This also minimizes some of the sample routing problems and the calibration and quality control issues that occur with many workstations in the lab.
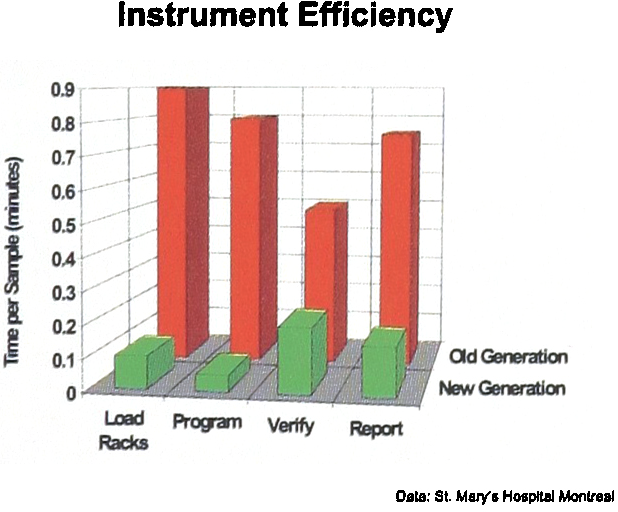
This shows a labor savings of 2.5 minutes per sample. The savings are a result of primary tube sampling and electronic programming and reporting of tests.
Improve the Flow of Information (Paperless Processing)
By using bar coded samples the information flow efficiency can be improved. It is important in preparing for automation that the Laboratory Information System be able to print a unique individual bar code number for each sample, this will allow robotic processing of different specimen types like hematology, coagulation and chemistry. Some LIS's do not perform this individualized labeling and label all the different type tubes with the same bar code number. In North America about 80% of the laboratories use some method of bar coding the samples. In most North American laboratories the bar codes are placed on the sample in the receiving area of the laboratory. Ideally in order to reduce errors the bar code should be placed on the specimen at the time of obtaining the sample.
At St. Mary's about half of the samples that are received in the laboratory are bar coded. An electronic means has been set up for remote entry of orders, bar code generation and results reporting; Figure 2 describes this process. The reason that this was done was to reduce labor time involved in processing non bar coded samples received in the laboratory and improve the accuracy. Table 1 shows a comparison of the process for non bar coded and bar coded samples in specimen receiving and the in laboratory labor saved per sample. At 1.8 minutes per sample savings, if one ran 1000 non bar coded samples per day the savings by doing order entry and bar coding outside the laboratory would be 3 FTE's for the laboratory.
This shows the difference in the process for bar coded and non bar coded samples. The bar coded samples take 1.8 minutes per sample less to process.


The electronic transfer of data is key to an efficient outreach program. This shows the data being ordered from a remote site with the bar code being generated and applied. The bar coded tube is processed by electronic test request on the analyzer. The results are auto validated 80% of the time and electronically transmitted back to the remote site.
A major step in improving the efficiency of the analyzers was the programming of the tests for the sample from the bar code identification on the sample and the test order in the laboratory information system. This eliminated the time consuming and error prone task of manually entering the patient id and sample test menu (1).
After the results have been generated many laboratories manually validate the results before they are sent back to the physician. Many programs are now available to perform auto verification of results, these will typical automatically pass 80% of the samples. The other 20% are verified manually. Getting the results to the physician can also be accomplished electronically to a terminal or by fax to a remote site that does not have a terminal. This also reduces labor and errors and speeds up total turnaround time. St. Mary's has just installed a new LIS and is installing remote terminals in the major off site areas, so that order entry, bar coding and order reporting can be easily performed.
Physical Rearrangement of the Laboratory (Core Laboratory)
There is a trend in the laboratory to re organize the classical hematology and chemistry sections into a high volume automated section. This has been called a core laboratory in many places. The philosophy is to put central processing and the high volume testing as close as possible to minimize routing problems. St. Mary's has rearranged the laboratory to make a core, lab shown in Figure 3. The blood procurement center is where the outpatient samples are drawn and bar coded. Reception and processing now has 50 square meters and the automated section with chemistry, hematology, coagulation and immunochemistry now has 112 square meters.

This shows the process the samples follow through the reception and core laboratory area. The major difference is the bar coded and non bar coded samples.
The samples are received in the reception and processing area with the time distribution shown (Figure 4). The non bar codes samples are logged in and the bar code applied (Figure 5). The samples that require centrifugation are spun and loaded into the analyzer racks. Urinalysis and blood gases are also performed in this area. The microbiology plating is performed on the back bench. In specimen reception and processing there are 2 clerks to log in the samples, 2 technologists to prepare and sort the samples, one technologist for microbiology plating and one for urinalysis and blood gases. Some samples are aliquotted for the following reasons:

This shows the laboratory layout after remodeling. Blood Gas, Urinalysis, and Microbiology Plating are run in the reception area. Hematology, Biochemistry, Coagulation, Immunochemistry, Serology and Immunology are run in the core laboratory.
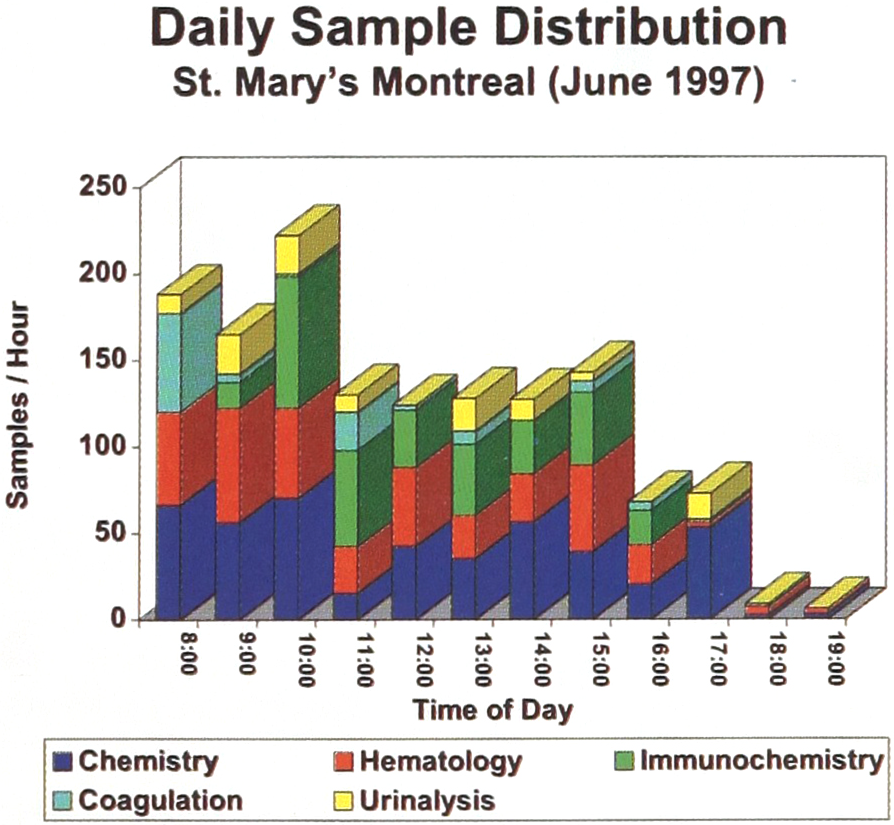
The daily sample distribution segmented into sample types for a typical day.
Serology, to avoid contamination since, as a major obstetric center, we might have to keep the serum for to nine months.
For low volume tests which are batched.
For esoteric testing.
This is a very small number, only 50 – 60 samples or 6 – 8% of the total specimens processed per day. At the time of sample procurement, the phlebotomist identifies all “stat” tests by making a mark on the tube's cap with a black felt pen. This mark allows the technologist at the processing center to identify the tubes immediately, even from the centrifuge, and prioritize them. The samples are picked up by the technologist in the automated laboratory and loaded on to the instrument. The Core laboratory has one technologist to run two Synchron CX7 chemistry analyzers, one technologist to run a GenS and one for the coagulation system, and two technologists to run the AxSym and the Array for immunochemistry, serology and immunology. There is one technologist in the blood bank area and two in the manual area. There are three floaters to fill in and give breaks during the shift. The instruments are programmed from the LIS and about 80% of the results are auto verified by the LIS.
The samples that require other tests or rerun are identified. The GenS automatically makes slides for the samples that are flagged in the automatic differential. These are then processed and reported from the manual section. If the volume justifies these could be loaded on an automated microscope. Chemistry samples may be required to be transferred to an immunochemistry analyzer for reflex testing. The samples are flagged at the verification terminal and then they are transferred from the Synchron rack to the AxSym rack and loaded on the analyzer. Once the sample is validated and the tests are all complete the samples are moved from the instrument rack to a storage rack where they are arranged alphabetically for easy recall. They are placed in the storage refrigerator and arranged by date of draw. This allows easy recall and disposal.
Personnel Reorganization
Before the core laboratory reorganization the laboratory had more supervisors. We now have a technical to total FTE ratio of 0.84 as compared to a ratio of 0.75 before.
Results of Reorganization (Productivity Metrics)
Before the reorganization by combining Biochemistry (including Endocrinology and Immunology), Hematology, Blood Bank and Microbiology, we were processing 955 samples (3255 reportable test results) with 20 FTE's (18 technical and 2 clerical). Today, we are processing 1915 (6500 reportable results) samples per day with 17 FTE's (15 technical and 2 clerical). Before we utilized 688 square meters to process the specimens and now we use 508 square meters. The following table illustrates the improved productivity over three shifts (Table 2). We are currently installing terminals for remote entry and bar code labeling at each of our major remote draw sites.
The metrics used the measure labor productivity and space utilization are ratios of the number of samples per day.

The goal is to get 90% of the samples that enter the laboratory bar coded. This will improve the transcription error rate and minimize the cost in laboratory labor for processing specimens. We have achieved improvements in productivity without investing in automation and we have developed a laboratory process that can be easily automated once we decide to invest.
Future Automation Plans
We are continuing to grow and we are looking at what areas to improve in efficiency next. In the analytical area if the analyzer capacity runs out, we can add a duplicate analyzer or go to the next higher throughput model to keep up with the demand without adding people.
People are still needed at the analyzers to load reagents and perform routine tasks. Since the electronic programming of analyzer makes the operation mostly loading and unloading racks the labor saved would be minimal by comparison to the cost of automatic transport and automatic loading and unloading. The pre-analytical area is where we would need to add people to keep up with increased workflow.
Our next phase would be the addition of a pre-analytical workstation to perform centrifugation, decapping, aliquoting and sorting to the analyzers. This would allow us to grow and continue to improve our productivity without adding people.
Conclusion
By using a stepwise progressive process we have achieved productivity increases by using the following steps.
Perform a detailed hourly workflow analysis to understand where the cost and production problems are in the laboratory. Redo this periodically to measure improvements in productivity and cost.
From the workflow analysis consolidate the number of workstations in the laboratory to minimize the labor in routing and the cost of extra calibration and maintenance.
Upgrade your laboratory information system so it will have:
A unique bar code for every sample.
Remote order entry and bar code labeling.
Electronic programming of the analyzer for the test orders.
Automatic verification of results based upon rule based parameters.
Electronic reporting to the site of the results.
Restructure the laboratory configuration to place specimen processing and the highly automated analyzers all in an automated area or core laboratory.
Add robotics to improve specimen processing efficiency.
By following these steps laboratories can take a progressive automation path at improving productivity in the laboratory.
We have included in table 2 some basic metrics to measure your own laboratory against St. Mary's. In our opinion skipping over one of these areas or trying to do too many of them at once will make the laboratory improvement more difficult.