
Abstract
The assessment of plasma volume loss (∆PV) induced by exercise can be estimated from changes in hematocrit (Htc) and hemoglobin (Hb), and it is essential when investigating the metabolic or biologic response to exercise of circulating biomarkers. We aimed to ascertain whether the estimation of ∆PV may differ when Hb and Htc are determined by automated hematological analyzer (AHA) versus manual methods. Twenty-five healthy male subjects performed a maximal running incremental exercise. Blood samples were taken before exercise, immediately after exercise, and after a 30-min recovery. Hb and Htc (Htc-AHA) were determined by an AHA. Htc was also determined by microcentrifugation (Htc-M). The ∆PV immediately after exercise and after recovery was calculated. The serum concentrations of several specimens were determined and corrected for ∆PV derived from Htc-AHA (∆PVAHA) and from Htc-M (∆PVM). Htc-M was found to be higher than Htc-AHA at all time points (p < 0.001). However, no differences were observed between ∆PVM and ∆PVAHA either post exercise (∆PVM −12.43% versus ∆PVAHA −12.41%, p = 0.929) or after recovery (∆PVM 1.47% versus ∆PVAHA 1.97%, p = 0.171). No significant differences were found between both ∆PV corrected concentrations of any biomarker (p ≥ 0.076). In conclusion, both AHA and the microcentrifuge may be reliably used to estimate ∆PV during exercise.
Introduction
The assessment of plasma volume loss (∆PV) induced by exercise is essential when investigating the metabolic or biologic response to exercise of circulating biomarkers. 1 During exercise, the intramuscular content of metabolites and the extravascular osmolarity increase. This effect, along with increased arterial pressure 2 and sympathetic activation, 3 causes an enhanced blood fluid filtration into the interstitial space, thus leading to the well-known hemoconcentration effect.4,5 Hemoconcentration can be estimated conventionally from changes in hematocrit (Htc) and hemoglobin (Hb), by the extensively used Dill and Costill equation. 6
Therefore, Hb and Htc must be determined prior to and after exercise to estimate ∆PV. However, the method by which these parameters are determined is critical. Automated hematological analyzers (AHAs) use a small volume of anticoagulated blood sample, typically comprising between 100 and 200 µL, to provide a large number of parameters that include Hb and Htc determinations along with blood cell enumeration and sizing. The many advantages of the automated complete blood cell count (CBC) have been largely emphasized in the past, and they include the more accurate and reproducible measurements compared to analysis of blood smear by conventional optical microscopy, the high throughput and faster turnaround time, along with a larger number of data on blood cell structure and function. 7
AHAs are typically located in hospitals, and it is often impossible to analyze blood samples collected in distant places within 4 h after blood drawing.8,9 Laboratory assays with spectrophotometric measurements (i.e., the reference cyanmethemoglobin assay or absorption spectrometry) can be used to determine Hb concentrations in stored blood samples, and Htc can be determined by centrifugating fresh anticoagulated blood in a capillary tube and comparing the height of the packed red blood cells (RBCs) with the height of the blood column. Nevertheless, some doubts exist as to whether the estimation of ∆PV may differ when Hb and Htc are determined by AHA versus manual methods, and whether these discrepancies may have an impact on the actual concentration of many biomarkers.
Hb measurement by AHA is typically performed by spectrophotometric assays, which are rather similar to manual techniques. In AHA, however, Htc is determined by optical or electrical impedance techniques after treating RBCs with specific isotonic solutions. Erythrocyte volume is sensible to osmotic variation of the medium. Thus, this process may have an impact on RBC volume, consequently altering Htc measurements. Hence, it seems conceivable that the assessment of Htc with AHA may mask the exercise effects, because plasma osmolarity rises with exercise. Indeed, it was recently shown that AHA could produce artifacts on Htc measurements and estimation of exercise-induced ∆PV. 10
In the present study, we aimed to obtain an answer to this issue by determining ∆PV after a running maximal incremental test to exhaustion and after a 30-min recovery period by measuring both Hb and Htc by both AHA and microcentrifuge. Moreover, we determined the effect of both methods to measure Htc on the after-exercise ∆PV corrected concentrations of several biomarkers.
Materials and Methods
Subjects
Twenty-five healthy male subjects [age, 20–45 years; body mass index (BMI), 19.7–26.7 kg/m2] were included in the study. Exclusion criteria were hematological, infectious, or inflammatory diseases; a history of heart disease; or the presence of cardiovascular risk factors (obesity; BMI >30 kg/m2), current tobacco use (>1 cigarette/day), hypertension (systolic blood pressure >140 mmHg, diastolic blood pressure >90 mmHg), hyperlipidemia (total cholesterol >220 mg/dL and/or triglycerides >175 mg/dL), or fasting glucose >126 mg/dL.
All participants were informed of the purpose, protocol, and procedures of the study before agreeing to participate. The trial was approved by the Ethical Committee of the Catholic University of Valencia. This work complies with the principles of the Declaration of Helsinki and was performed in accordance with the Spanish laws on research in humans.
Experimental Protocol
All participants performed a maximal incremental test on a motorized treadmill until exhaustion. Subjects were instructed not to exercise 24 h before performing the trial. All of the participants reported to the laboratory in fasting conditions between 8:00 and 9:00 a.m. Before the test, information on weight and height was collected, and blood pressure was measured by auscultation.
During the warmup period (5 min), subjects selected the running speed (between 8 and 12 km/h) according to their preferences and habitual training pace. This speed remained fixed during the test, whereas the slope was increased by 1% every minute. The test ended when the subject was unable to keep running despite verbal encouragement. Ventilatory parameters were recorded during exercise through a respiratory valve and a face mask (Hans Rudolph, Kansas City, MO, USA) using a gas analyzer (MetaLyzer 3B-R2, Cortex Biophysik, Leipzig, Germany). The test was considered maximal when at least two of the following conditions were fulfilled: respiratory quotient > 1.1, and maximal heart rate > predicted maximal heart rate (220 – age).
Blood Sampling
Blood samples were taken from the antecubital vein before exercise, immediately after exercise, and after the 30-min recovery period. For lactate and hematological determinations, blood was collected in standard vacuum tubes containing K3EDTA. For AHA measurements, tubes were refrigerated (i.e., kept at 4 °C) until analysis was completed, within 2 h after extraction. For biochemical analyses, blood was collected in vacuum plain tubes without additives, allowed to coagulate, and centrifuged according to manufacturer’s instructions. Serum was immediately divided in aliquots and kept at −80 °C until measurement.
Laboratory Methods
An AHA (XE-2100L, Sysmex, Kobe, Japan) 11 was used to assay Htc (Htc-AHA) and Hb in duplicate. In this instrument, hemoglobin is measured with the noncyanide SLS–hemoglobin method using sodium lauryl sulfate (SLS), whereas erythrocyte analysis is performed by passing blood cells through the aperture of the detector surrounded by sheath fluid in the sheath flow method (also known as hydrodynamic focusing), and Htc is finally calculated via the RBC pulse height detection method. 12 The intra-assay coefficients of variation (CVs) 13 of these methods are 0.34% for Htc and 0.30% for Hb, respectively. Htc was also determined by microcentrifugation (Htc-M). Shortly, two 120-µl capillary tubes were filled with anticoagulated blood and centrifuged for 5 min at 15 000 g (Sorvall Legend Micro 21R Microcentrifuge, Thermo Scientific, Waltham, MA, USA). The height of the packed RBCs was divided by the height of the blood column to calculate Htc. The interassay CV of this technique is 0.69%.
The whole-blood lactate concentration was determined just after blood was drawn with a Biosen C-line autoanalyzer (EKF-diagnostic GmbH, Germany). Twenty microliters of whole blood were pipetted into two premade analyzer tubes, gently agitated, and inserted into the previously calibrated analyzer. All the measures were performed in duplicate. The intra- and interassay CVs are 0.92% and 2.39%, respectively, for the whole-blood lactate measures.
The glucose (Glu), total-cholesterol (TC), triglycerides (TG), and total-proteins (TP) concentrations in serum were determined with an AU 5430 clinical chemistry analyzer (Beckman Coulter, Brea, CA, USA). The serum concentrations of lactate dehydrogenase (LDH) and creatine kinase (CK) were tested immediately after thawing on a Roche Cobas 6000 system (Roche Diagnostics, Penzberg, Germany), according to the manufacturer’s specifications. Serum brain natriuretic peptide (BNP) and creatine kinase-MB isoenzyme (CK-MB) were assayed using a Roche Elecsys 2010 (Roche Diagnostics). Total imprecision is <3% for LDH, <5% for CK, and <10% for both BNP and CK-MB, as quoted by the manufacturers.
Calculations
The change in plasma volume (∆PV) from baseline (i.e., immediately after exercise and after recovery) was calculated using the Dill and Costill equation 6 as follows:

where Htc is given as a percentage and Hb is in g/dL. Two ∆PV were calculated using Htc by microcentrifuge (∆PVM) and using Htc by AHA (∆PVAHA).
The concentrations of biochemical parameters immediately post exercise and after a 30-min recovery were then corrected for hemoconcentration as follows:

where the c and u sub-indices denote the corrected and uncorrected concentrations, respectively.
Statistical Analysis
All data variables were analyzed for normality by the Shapiro–Wilk test. The effects of exercise and recovery on the biochemical parameters uncorrected or corrected by ∆PV were analyzed by a paired Wilcoxon’s test or a one-way ANOVA for repeated measures (sampling time: pre-exercise, post exercise, and after a 30-min recovery). Post-hoc comparisons were made with Bonferroni’s test correction. ∆PVM and ∆PVAHA were compared at post exercise and after a 30-min recovery by means of a one-way ANOVA for repeated measures. To analyze the agreement between Htc-M and Htc-AHA, between ∆PVM and ∆PVAHA, and between the ∆PVM- and ∆PVAHA-based hemoconcentration corrected concentrations of the biochemical parameters post exercise and after a 30-min recovery, we used Bland–Altman plots, calculating the limits of agreement at 95% (LoAs) based on the mean difference (bias). 14 The statistical analysis was performed using SPSS, version 21 (IBM, Armonk, NY, USA). The results were considered statistically significant at p < 0.05. Data were expressed as mean ± one standard deviation or by median (10th–90th percentiles).
Results
All the 25 male subjects concluded the incremental running test until exhaustion. All trials were considered maximal. Average maximal oxygen consumption (VO2max) was 52.7 ± 5.3 mL/min/kg, and postexercise whole-blood lactate concentration was 9.24 ± 2.33 mM.
Exercise induced a significant effect on Hb [pre-exercise, 15.3 ± 0.8 g/dL; post exercise, 16.3 ± 0.9 g/dL; and 30-min recovery, 15.1 ± 0.9 g/dL, F(2,48) = 101.496, p < 0.001] and on Htc-M [F(2,48) = 85.472, p <0.001] and Htc-AHA [F(2,48) = 133.566, p < 0.001] (see Fig. 1 ). Htc-M was found to be higher than Htc-AHA at all time points (pre-exercise, Htc-M 47.2% versus Htc-AHA 44.6%, p < 0.001; post exercise, Htc-M 50.8% versus Htc-AHA 48.4%, p < 0.001; and 30-min recovery, Htc-M 47.2%, Htc-AHA 44.3%, p < 0.001) (see Fig. 1 ). However, no differences were observed between ∆PVM and ∆PVAHA either at post exercise (∆PVM −12.43% versus ∆PVAHA −12.41%, p = 0.929) or after a 30-min recovery (∆PVM 1.47% versus ∆PVAHA 1.97%, p = 0.171) (see Fig. 1 ).
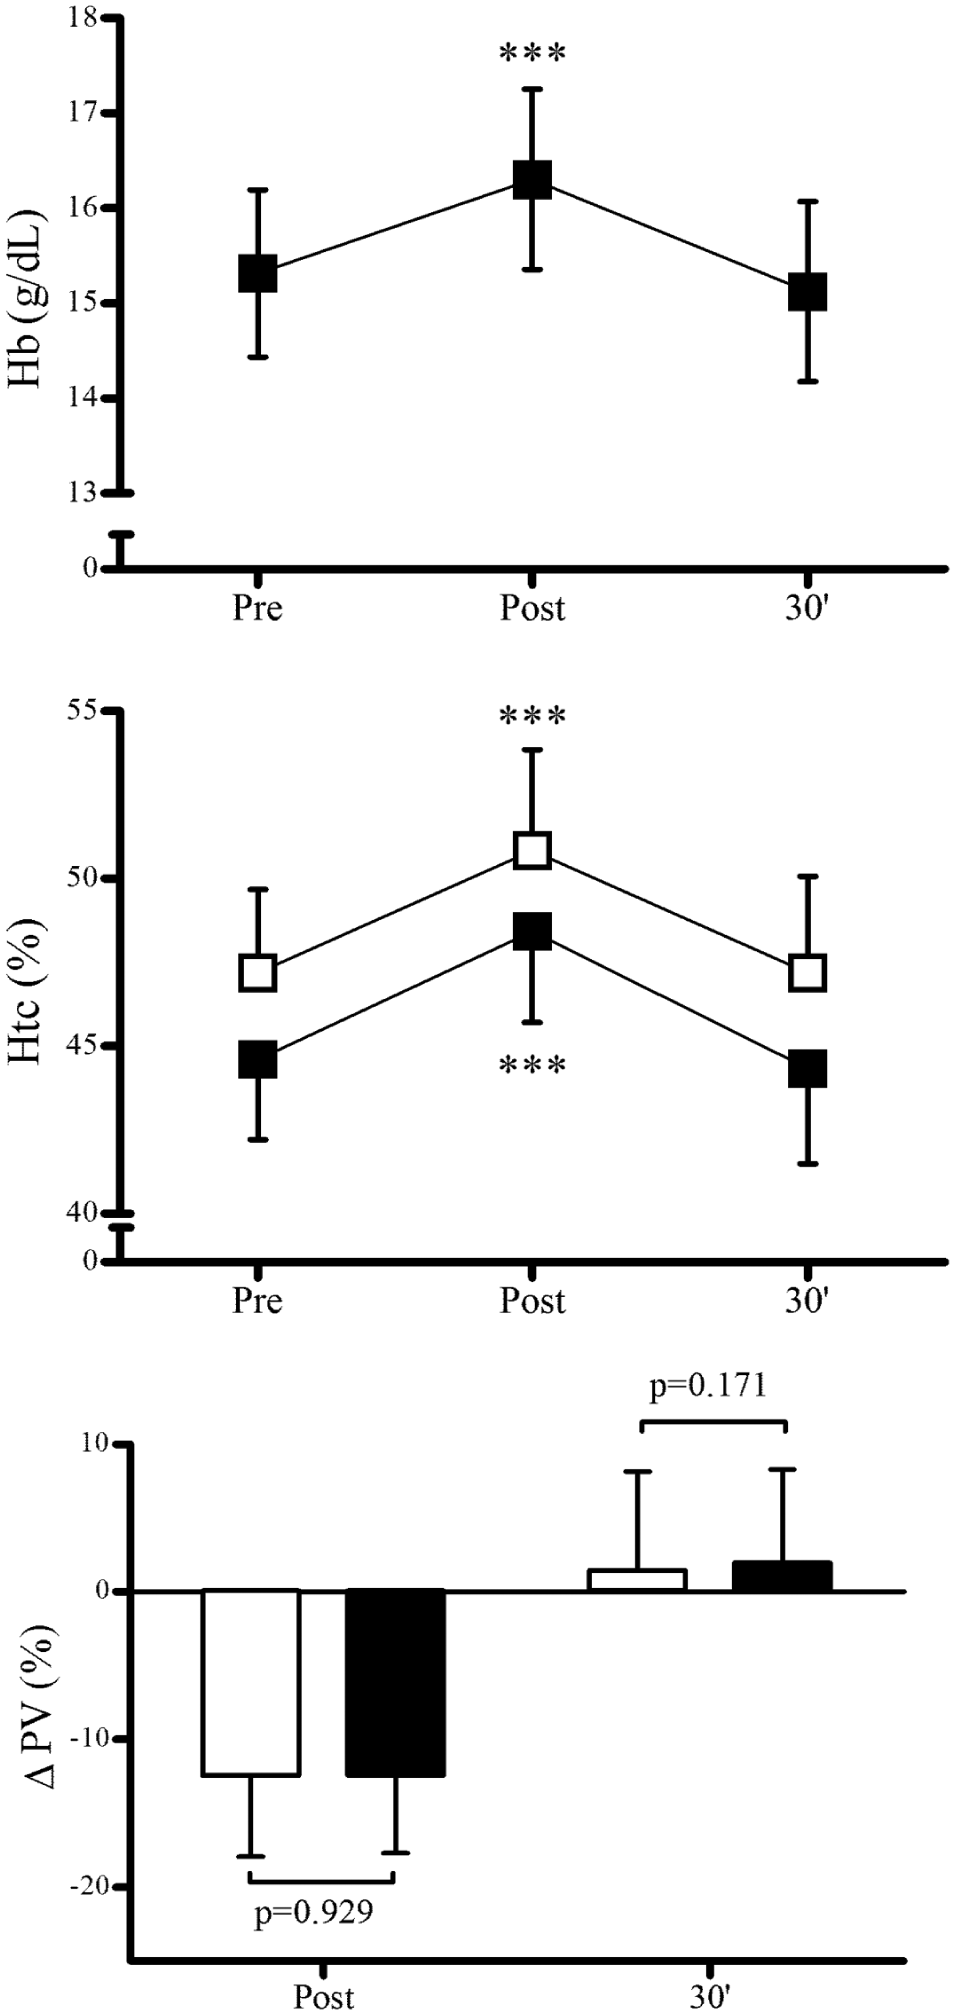
Effects of a maximal incremental running test and a 30-min recovery period on hemoglobin (Hb) concentration, hematocrit (Htc), and plasma volume loss (∆PV). Clear symbols and bars represent microcentrifuge-derived Htc and ∆PV, and solid symbols and bars represent automated hematological analyzer–derived Htc and ∆PV. Symbols and bars represent mean values; error bars represent one standard deviation. ***p > 0.001 versus pre-exercise.
The serum values of Glu, TC, TG, TP, CK, CK-MB, BNP, and LDH were determined at pre-exercise, post exercise, and after a 30-min recovery. Postexercise and after-recovery serum concentrations were corrected by hemoconcentration using ∆PVM and ∆PVAHA. The postexercise uncorrected concentrations of all the biomarkers investigated were found to be increased, an elevation that lasted after the recovery period, except for TC, TP, and BNP ( Fig. 2 ). Both ∆PV corrections yield very similar results on the evolution of the biomarker’s concentrations ( Fig. 2 ). No significant differences were found between both ∆PV corrected concentrations of any biomarker, or after exercise or recovery (p ≥ 0.076; Fig. 2 ).
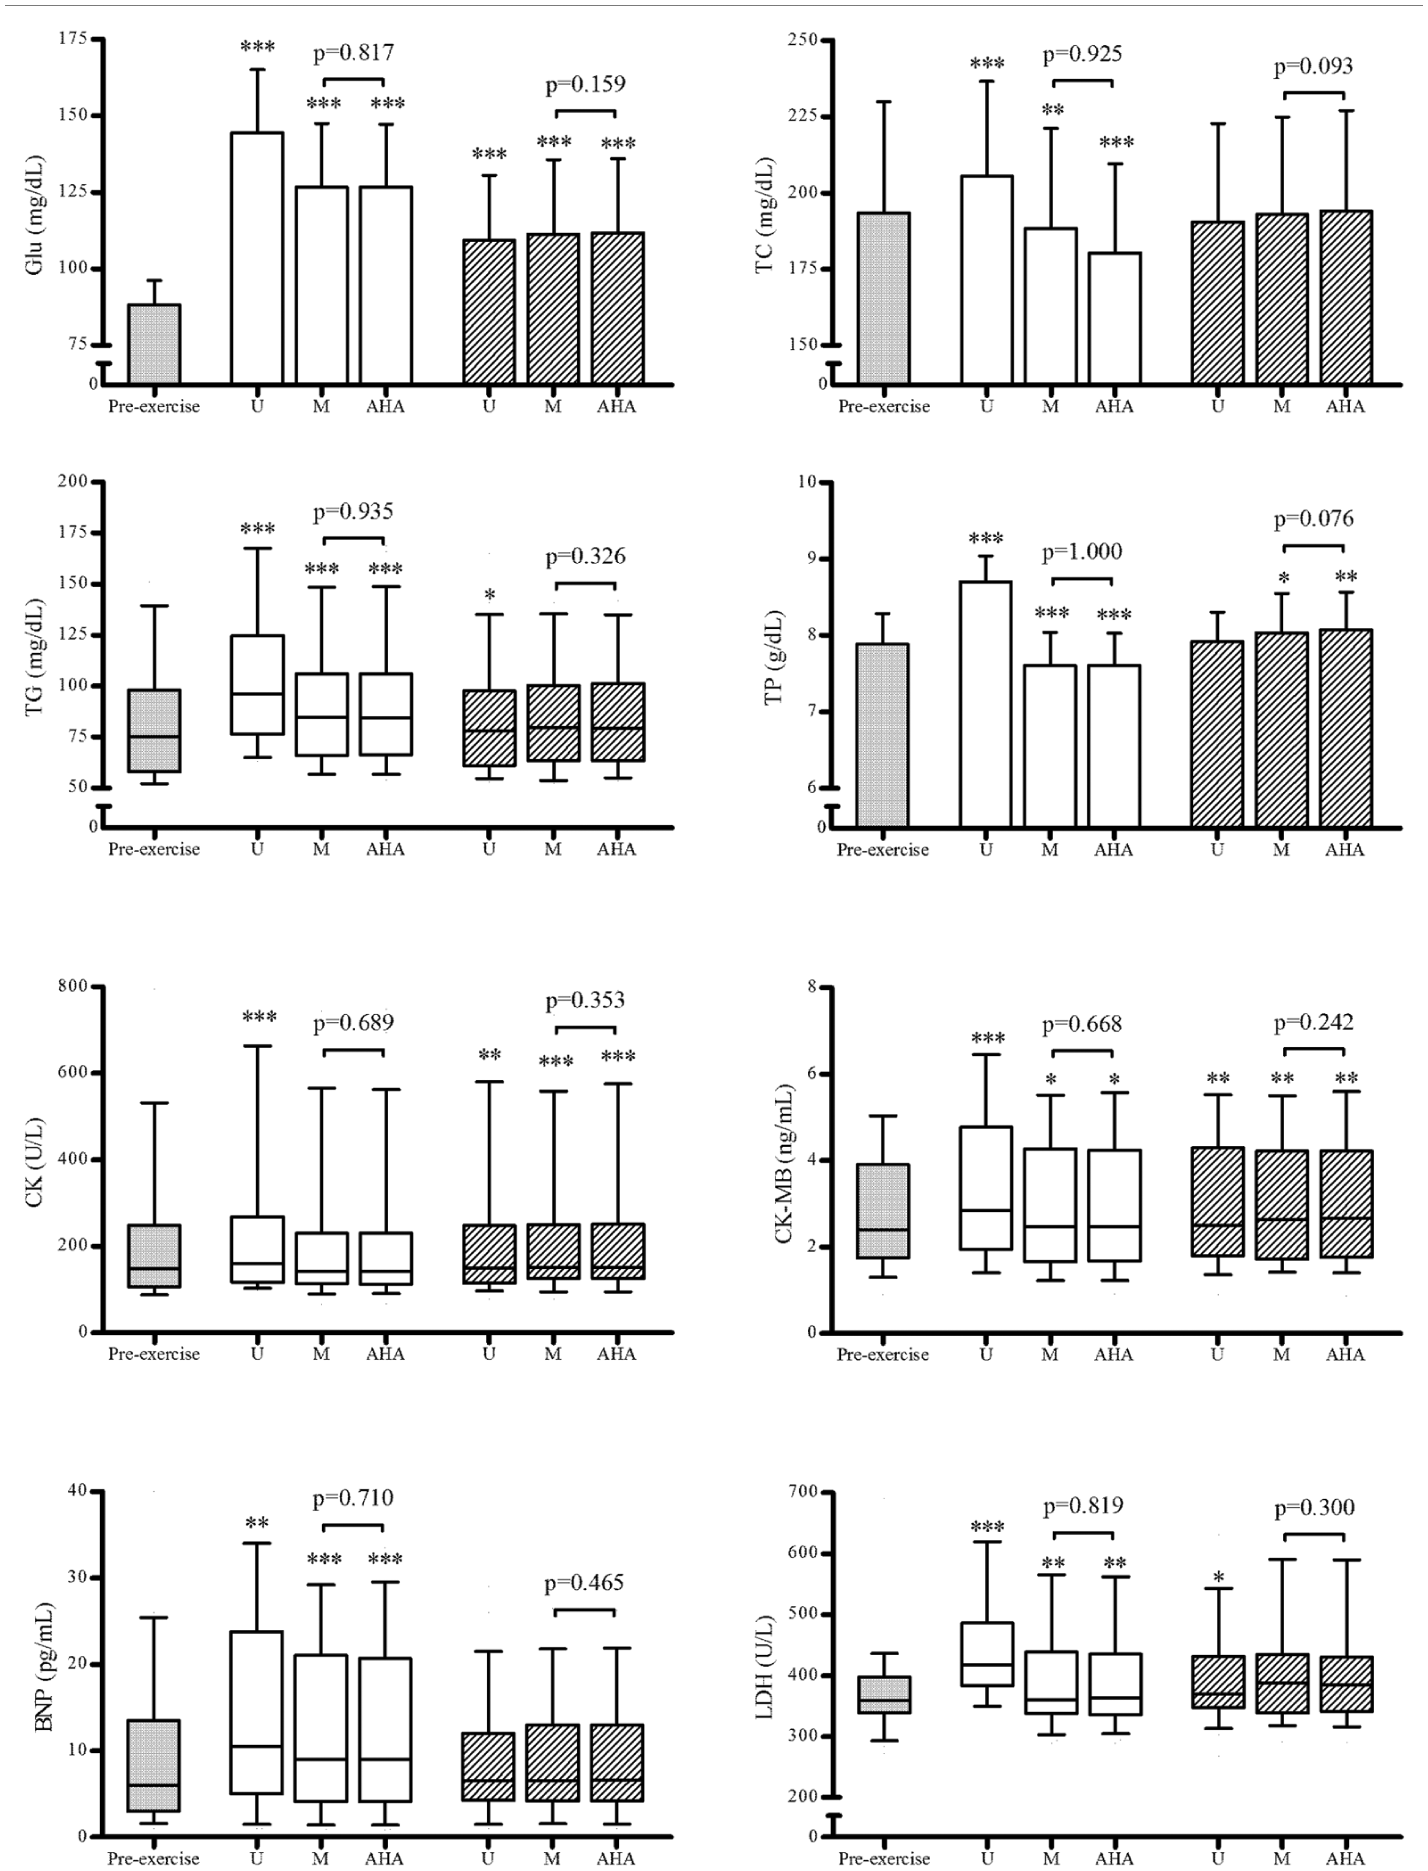
Effects of a maximal incremental running test and a 30-min recovery period on serum concentrations of glucose (Glu), total cholesterol (TC), triglycerides (TG), total proteins (TP), creatine kinase (CK), creatine kinase-MB isoenzyme (CK-MB), brain natriuretic peptide (BNP), and lactate dehydrogenase (LDH). U denotes uncorrected concentration, M denotes concentration corrected by hemoconcentration estimated by microcentrifuge-derived hematocrit, and AHA denotes concentration corrected by hemoconcentration estimated by automated hematological autoanalyzer–derived hematocrit. White-filled bars and boxes denote postexercise values, and shaded bars and boxes denote values after a 30-min recovery. Data are represented as mean (bars) and one standard deviation (error bars) or as median (boxes) and 10th–90th percentiles (whiskers). *p < 0.05; **p < 0.01; ***p > 0.001 versus pre-exercise.
We also investigated the agreement between Htc-M and Htc-AHA measurements by means of Bland–Altman analyses at pre-exercise, post exercise, and after a 30-min recovery. These analyses provide biases and LoAs that help determine whether both methods could be used indistinctively.
Htc bias and LoAs were broad at all time points (pre-exercise: bias −2.6%, LoA sup −1.3%, and LoA inf −3.8%; post exercise: bias −2.4%, LoA sup −1.0%, and LoA inf −3.8%; and after a 30-min recovery: bias −2.9%, LoA sup −1.4%, and LoA inf −4.3%). The same statistical approach was used to estimate the agreement between ∆PVM and ∆PVAHA. Small biases were found both post exercise (bias 0.02%, LoA sup 2.05%, and LoA inf −2.02%) and after recovery (bias 0.05%, LoA sup 3.99%, and LoA inf −2.99%).
Figures 3
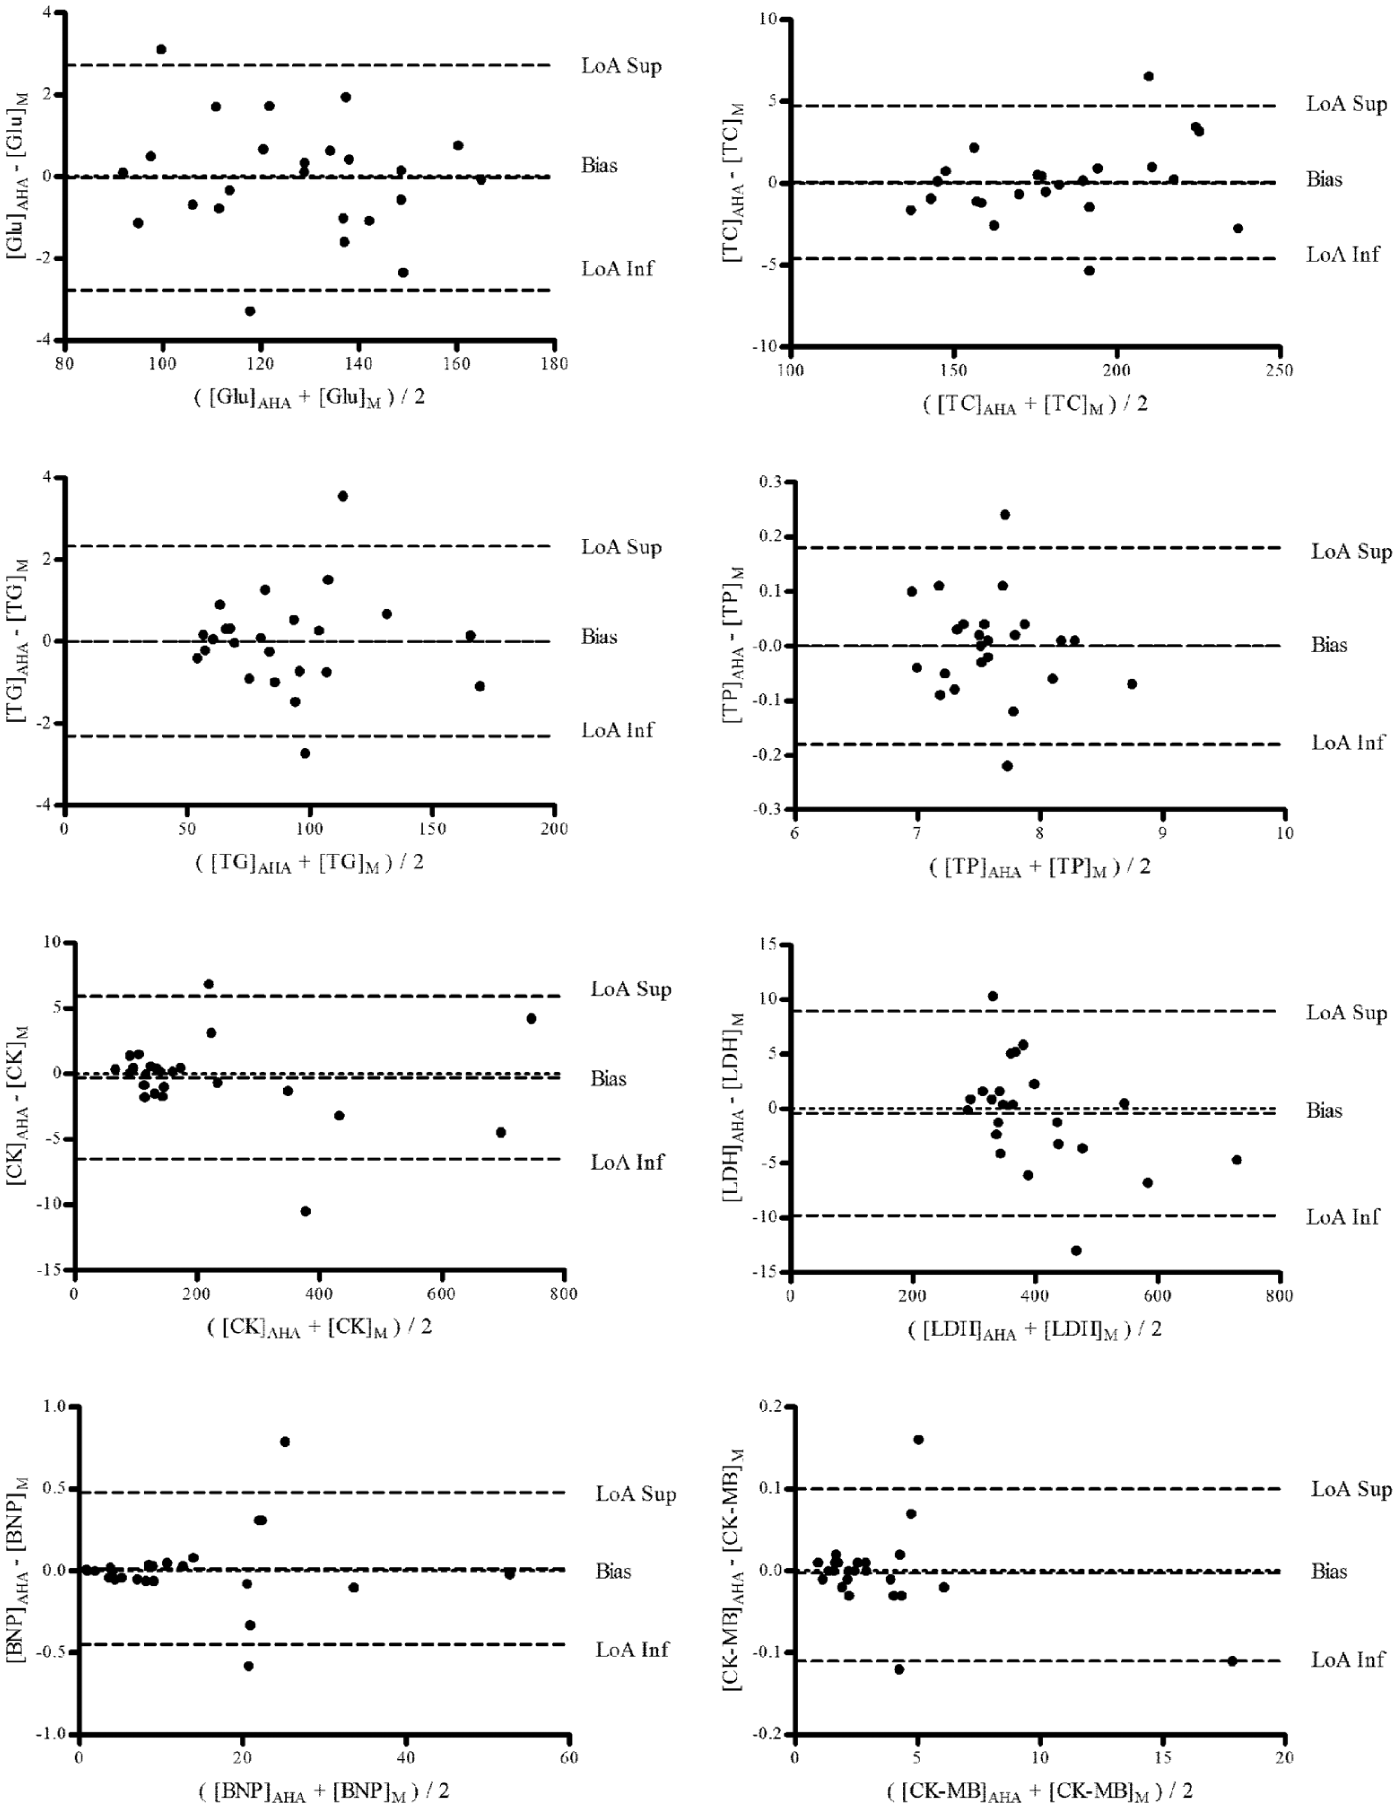
Bland–Altman plots of the postexercise serum concentrations of glucose (Glu), total cholesterol (TC), triglycerides (TG), total proteins (TP), creatine kinase (CK), creatine kinase-MB isoenzyme (CK-MB), brain natriuretic peptide (BNP), and lactate dehydrogenase (LDH), corrected by hemoconcentration calculated by changes of hemoglobin and hematocrit derived from microcentrifuge (M) and from automated hematological autoanalyzer (AHA). LoA, limit of agreement.
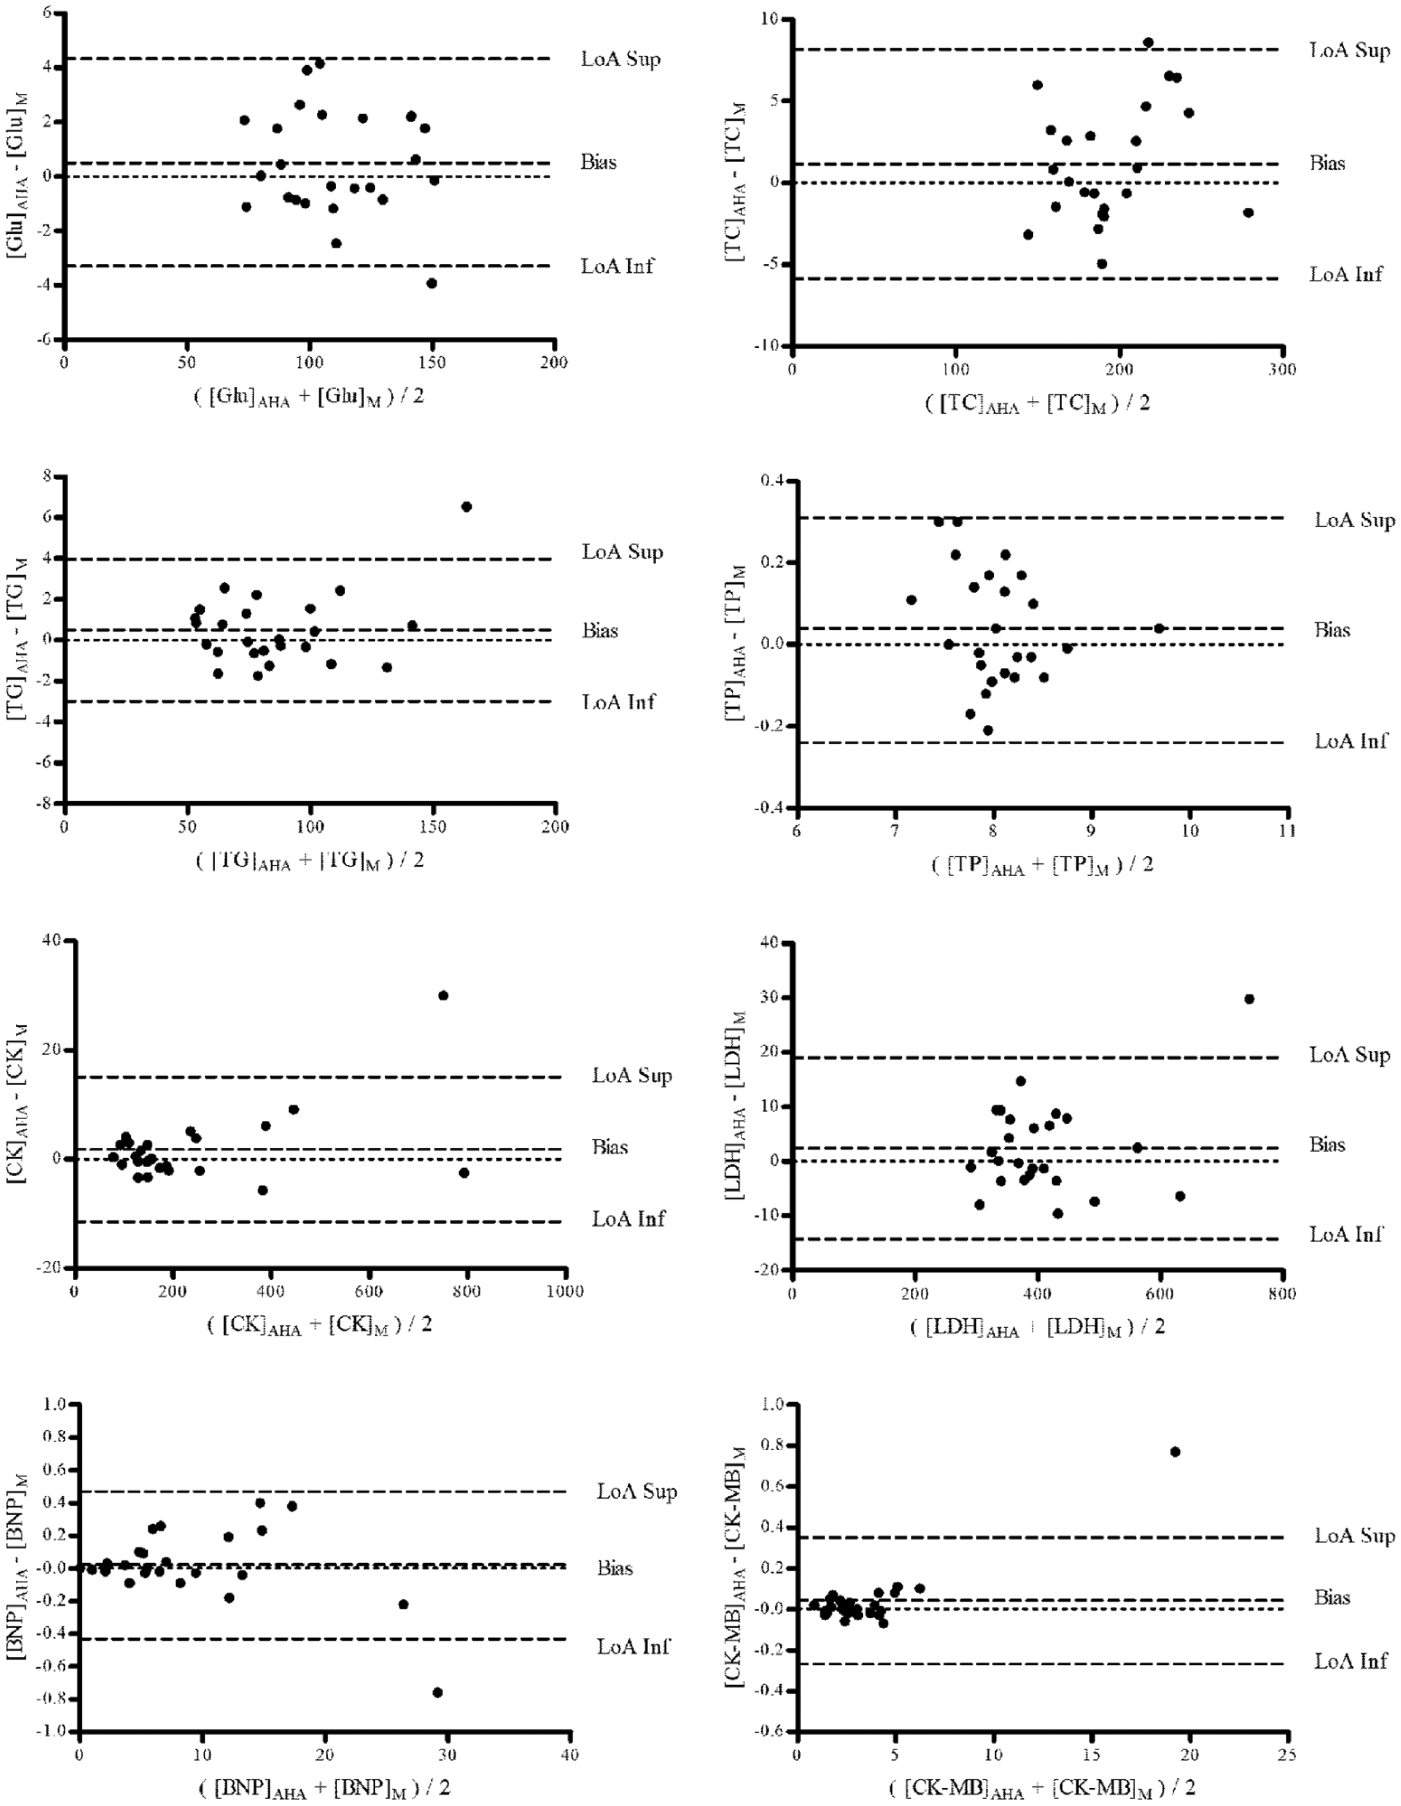
Bland–Altman plots of the postexercise serum concentrations of glucose (Glu), total cholesterol (TC), triglycerides (TG), total proteins (TP), creatine kinase (CK), creatine kinase-MB isoenzyme (CK-MB), brain natriuretic peptide (BNP), and lactate dehydrogenase (LDH), corrected by hemoconcentration calculated by changes of hemoglobin and hematocrit derived from microcentrifuge (M) and from automated hematological autoanalyzer (AHA). LoA: limit of agreement.
Discussion
We aimed to establish whether a bias in estimation of exercise-induced hemoconcentration may exist when Htc is assessed by microcentrifuge or AHA using the Dill and Costill equation, 6 and whether using a different methodology could have an impact on the corrected concentrations of circulating biomarkers in exercise. In AHAs, Htc is usually assessed by two main approaches (i.e., by direct measurement as in XE-2100, or by indirect calculation from erythrocyte volume and number) after RBCs are treated with isotonic solutions, and this may mask the exercise-induced increase of plasma osmolarity, a well-recognized source of modification of erythrocyte volume and, therefore, of packed cell volume.
The data of the present study show that Hct values assessed by microcentrifuge or AHA differ significantly ( Fig. 1 ), but also that this bias has a negligible impact on ∆PV estimation, which remains highly comparable and correlated just after exercise, as well as after 30 min of exercise cessation. This is not really unexpected, because the Dill and Costill equation calculates hemoconcentration by changes in Hb and Htc rather than by absolute values, so that the ∆PV calculated using both methods is expected to be highly comparable. This is confirmed by our data, which show that no significant differences exist in the mean ∆PV calculated by both microcentrifuge and AHA at post exercise and after recovery ( Fig. 1 ). Accordingly, small biases and narrow LoAs were also found in the Bland–Altman analyses both post exercise and after recovery.
Consequently, the correction of circulating biomarkers for hemoconcentration by both methods yield highly comparable data in all the specimens investigated (
Fig. 2
), as well as small biases and narrow LoAs (see
Figs. 3
At variance with our data, Watson and Maughan 10 recently showed that an overestimation of ∆PV may occur using a Coulter ACT 5diff hematological analyzer compared with manual methods to determine Htc during exercise. However, no differences between AHA Htc and spun Htc were recorded at pre-exercise, and it was only during exercise and at exhaustion that significant differences of Htc emerged (i.e., AHA Htc higher than spun Htc), which then affected the ∆PV. 10 The authors attributed these results to the high osmolality (342 mOsm·kg−1) of the Coulter commercial wash buffer that alters erythrocyte volume and therefore masks the effect of in vivo plasma osmolarity on Htc. However, this explanation seems not very accurate in light of the Htc values reported by Watson and Maughan. 10 An osmolarity increase of the medium on AHA must yield lower Htc than that obtained by microcentrifugation in native plasma, because such medium should shrink RBCs. Moreover, no differences were found at baseline 10 when plasma osmolarity should be not sought to increase. Another explanation to these incongruent results might be possible. The authors reported that the AHA determinations were performed within 3 h after drawing but that samples were not refrigerated. This could be suitable for baseline conditions, but during exercise, when high lactate concentrations are present in plasma, slow intake by erythrocytes 15 increases cell volume. 16 This would explain the increased Htc observed on the delayed assayed AHA samples.
Microcentrifugation measurements of Htc are not exempt of error or artifacts. The height of the blood and of the packed cell columns have to be measured using graded rulers, which is often difficult due to the small size of capillaries; this can generate potentially inaccurate measures. Moreover, plasma may be also entrapped within packed blood cell columns during centrifugation. In this study, Htc-M was corrected for trapped plasma in the packed cell column by a fixed coefficient (i.e., decreasing values by 1%). 17 According to the centrifugation g force and time applied, different corrections should be adopted. 18 The most frequently used correction for trapped plasma is 4% of the packed cell volume. 6 If such a correction would have been applied in the present study, the Htc-M values would have been further reduced by approximately 1%, thus becoming even closer to the values obtained with AHA.
Because plasma volume is affected by several factors, it would be interesting to conduct an experimental phase without performing this exercise, to observe the changes on ΔPV provoked by other factors. This issue and the reduced sample size (n = 25) are the main limitations of the present study.
In conclusion, the results of the present study show that, despite the fact that Htc values were different when measured with AHA or microcentrifuge, the ∆PV calculated and the correction of postexercise biomarker concentrations yield very similar results between the two methods. Therefore, we suggest that both AHA and the microcentrifuge may be reliably used to estimate plasma volume changes during exercise.
Footnotes
Declaration of Conflicting Interests
The authors declared no potential conflicts of interest with respect to the research, authorship, and/or publication of this article.
Funding
The authors disclosed receipt of the following financial support for the research, authorship, and/or publication of this article: This research has been supported by grant DEP2012-37494 from the Spanish government and by grants 2013-168-002 and 2012-011-001 from the Catholic University of Valencia, Spain. RA is a predoctoral fellow of the Catholic University of Valencia.