
Abstract
Study Design
Biomechanical Simulation Study.
Objectives
Spinal injuries account for 30-40% of severe mountain biking (MTB) cases and may be mitigated by back protectors. Thoracolumbar compression fractures are linked to rolling impacts during forward falls, yet their biomechanical mechanisms remain poorly understood. It is unclear whether current back protectors, tested under perpendicular conditions (EN1621-2), adequately address the complex loading of real-world crashes.
This work aims to investigate the biomechanical mechanisms of thoracolumbar fractures during MTB forward falls.
Methods
Forty-four back-impact scenarios were simulated using a THUMS V4 finite element model, based on velocities derived from prior multibody simulations. The analysis examined the effects of impact velocity, angle, friction, and body position on spinal loading and fracture pathways. Injuries were predicted using force, moment, stress, and strain.
Results
Vertebral fractures were predicted in 84% of cases, occurring away from the impact site due to combined axial loading and hyperflexion. Three mechanical pathways leading to Magerl type A fractures were identified: (1) 45° lower-back impacts causing thoracolumbar (T12–L2) fractures; (2) flat (0°) lower-back impacts causing upper-thoracic injuries; and (3) upper-back impacts leading to lumbar (L4–L5) fractures through “whiplash-like” motion. Normal velocity was the strongest injury risk predictor, while impact angle determined fracture location.
Conclusion
Simulated fractures were not predicted at the impact site but at a distance, driven by combined axial loading and hyperflexion induced by normal and rotational velocities. Current back protector testing protocols do not reflect these mechanisms and may not adequately address real-world spinal loading conditions.
Introduction
Mountain biking (MTB) is a high-speed outdoor activity that, while popular, carry a significant risk of falls and injuries (16.8 per 1000 hours of exposure 1 ). While most of these incidents result in limb injuries, such as shoulder injuries, 2 spinal injuries, though less frequent, account for 30-45% of severe trauma cases 3 and can have life-altering consequences. In MTB, forward falls were identified as the leading mechanism of spinal injury.4,5 Following such a fall, two primary impact-to-ground kinematics are commonly observed: (1) a head-first impact followed by a trunk impact causing cervical spine injuries (73.8% of all spinal injuries 4 ) due to axial loading and hyperextension,6–8 or (2) a rolling impact, where the back contacts the ground during tumbling motion, involving complex rotational kinematics, which may lead to thoracic or lumbar fractures (26.2% of all spinal fractures 4 ). While specific data on MTB injury patterns remain limited, existing studies suggest that resulting thoracic and lumbar fractures are mainly compression fractures (Magerl type A), 9 occurring predominantly as multistage compression either at the T6–T12 or at L1–L3 levels. 10
To further understand injury mechanisms, insights can be drawn from winter sports where similar fall dynamics occur. In skiing, detailed injury patterns have been documented: thoracic fractures are reported as predominantly compression fractures (92%) following airborne falls with uncontrolled landings, while at the lumbar level, compression fractures also dominate (85%), followed by transverse process fractures (15%). 11 This prevalence of compression injuries (90%) is consistent with findings by Gertzbein et al1 12 To investigate these mechanisms, researchers in these fields have successfully combined multibody modelling and finite element (FE) analysis.13–15 However, despite the similarities in injury types and the established numerical methodologies, the kinematic data and specific injury thresholds from snow sports are not directly transposable to mountain biking due to substantial differences in terrain, friction, and fall dynamics. Consequently, the biomechanical link between the rolling impact kinematics specific to MTB and the resulting thoracolumbar fractures remains poorly understood. Addressing this gap is critical because rolling impacts primarily affect the thoracic and lumbar spine, regions supposedly protected by current back safety gear. It remains unestablished whether fractures in MTB arise primarily from a direct perpendicular back impact, as assumed in current protective standards (EN1621-2), 16 or from hyper-flexion induced by rotational impact scenarios resulting in vertebral body compression. This distinction is vital, as current protector designs focus on energy absorption during perpendicular impacts and their relevance in realistic oblique or rotational scenarios is uncertain.17–19
This study aims to investigate how thoracolumbar spinal fractures occur during a forward fall, which is the main scenario leading to these specific injuries in MTB. Back-impact scenarios were simulated using a detailed finite element human body model (THUMS V4) and the effects of impact conditions (impact area, normal/tangential/rotational velocity, angle, friction, and body position) on spinal injury mechanisms (location along the spine, severity, and vertebral fracture site) were examined.The ultimate goal is to provide data that can inform and challenge protective equipment standards and critically assess whether current back protectors are truly effective under realistic impact conditions.
Methods
This study presents a detailed FE reconstruction of impacts on the back of a cyclist during a forward fall in MTB to investigate spinal loading mechanisms leading to thoracolumbar fractures. The choice of modelling a forward fall was based on both epidemiological data and a video analysis study showing that this crash scenario is the primary cause of thoracolumbar fractures. 10 The associated impact conditions were derived from a previous study 20 that analyzed back-to-ground impacts during realistic forward MTB falls using human multibody simulations. This latter study is summarized below.
Identification of Realistic Back Impact Conditions in MTB
Realistic back impact conditions were derived from a previous multibody simulation study
20
reconstructing forward falls in MTB induced by a bad jump landing or a front-wheel locking. In that work, 271 crashes were simulated under realistic initial conditions (speed, initial and final slope angle, bike orientation, handlebars holding force, obstacle height). In 45.8% of simulated crashes, the rider rolled on ground, impacting their back during the motion. Using this multibody work, we deepened our analysis to differentiate the specific impact conditions between rolling upper back-first cases and rolling lower back first cases (from lumbar spine to buttocks). For each case, key impact parameters were extracted, including impact zone (upper back or lower back), normal velocity (Vn), tangential velocity (Vt), and rotational velocity (Vrot), as summarized in Figure 1. To capture realistic but injury-relevant conditions, the impact scenarios selected for FE testing ranged from the first quartile (25th percentile) to the 95th percentile of the distributions (Figure 1). (a) Boxplots of tangential velocity (Vt, green), normal velocity (Vn, red), and rotational velocity (Vrot, orange) as a function of first impacted area (upper back or lower back). Each box represents the interquartile range (25th–75th percentiles) with the horizontal line indicating the median. The whiskers extend to the minimum and maximum values within 1.5 times the interquartile range. Circles (•) indicate the 25th percentile, and crosses (×) indicate the 95th percentile. Left axis: Vt and Vn (m/s). Right axis: Vrot (rad/s). Example of upper back first rolling impact (b) and lower back first rolling impact (c)
Finite Element Models for Biomechanical Response Evaluation
From these impact conditions, two designs of experiment (DOE) were performed with FE modelling: upper back first rolling impacts and lower back first rolling impacts. For these simulations, we used the mid-size THUMS model version 4 and all FE simulations were performed using the explicit solver LS-DYNA R13. The THUMS model was prepositioned at 50 mm from a rigid floor. The normal (Vn) and tangential (Vt) velocities derived from the multibody model were applied to the entire body, while rotational velocity (Vrot) was applied at the T7 centre of mass, consistent with measurements from the multibody model.
Designs of experiment were begun with third quartile values first, followed by a full Monte Carlo approach to generate 22 simulations for each DOE, investigating six initial parameters: Vt, Vn, Vrot, friction, THUMS position and impact angle. Friction between the THUMS model and the rigid ground ranged from high (0.4, equivalent to road friction) to very low (0, equivalent to ice).
21
Two positions were investigated: (0) Tucked position, with the spine flexed, knees pulled towards the chest and head drawn inside (1) Sit position with legs raised and head bent forward toward the chest. Finally, impact angles with values from −60° to 0° for upper back DOE and 0° to 70° for lower back to buttocks impacts (Figure 2). Each crash was simulated for a duration of 150 ms to ensure the full capture of the initial ground impact and the associated spinal injury mechanisms. Presentation of the two designs of experiment (DOE) for upper back impact first (a) and lower back impact first (b). Position and Friction vary within similar ranges for the two DOE. Vt, Vn, Vrot and angle are DOE specific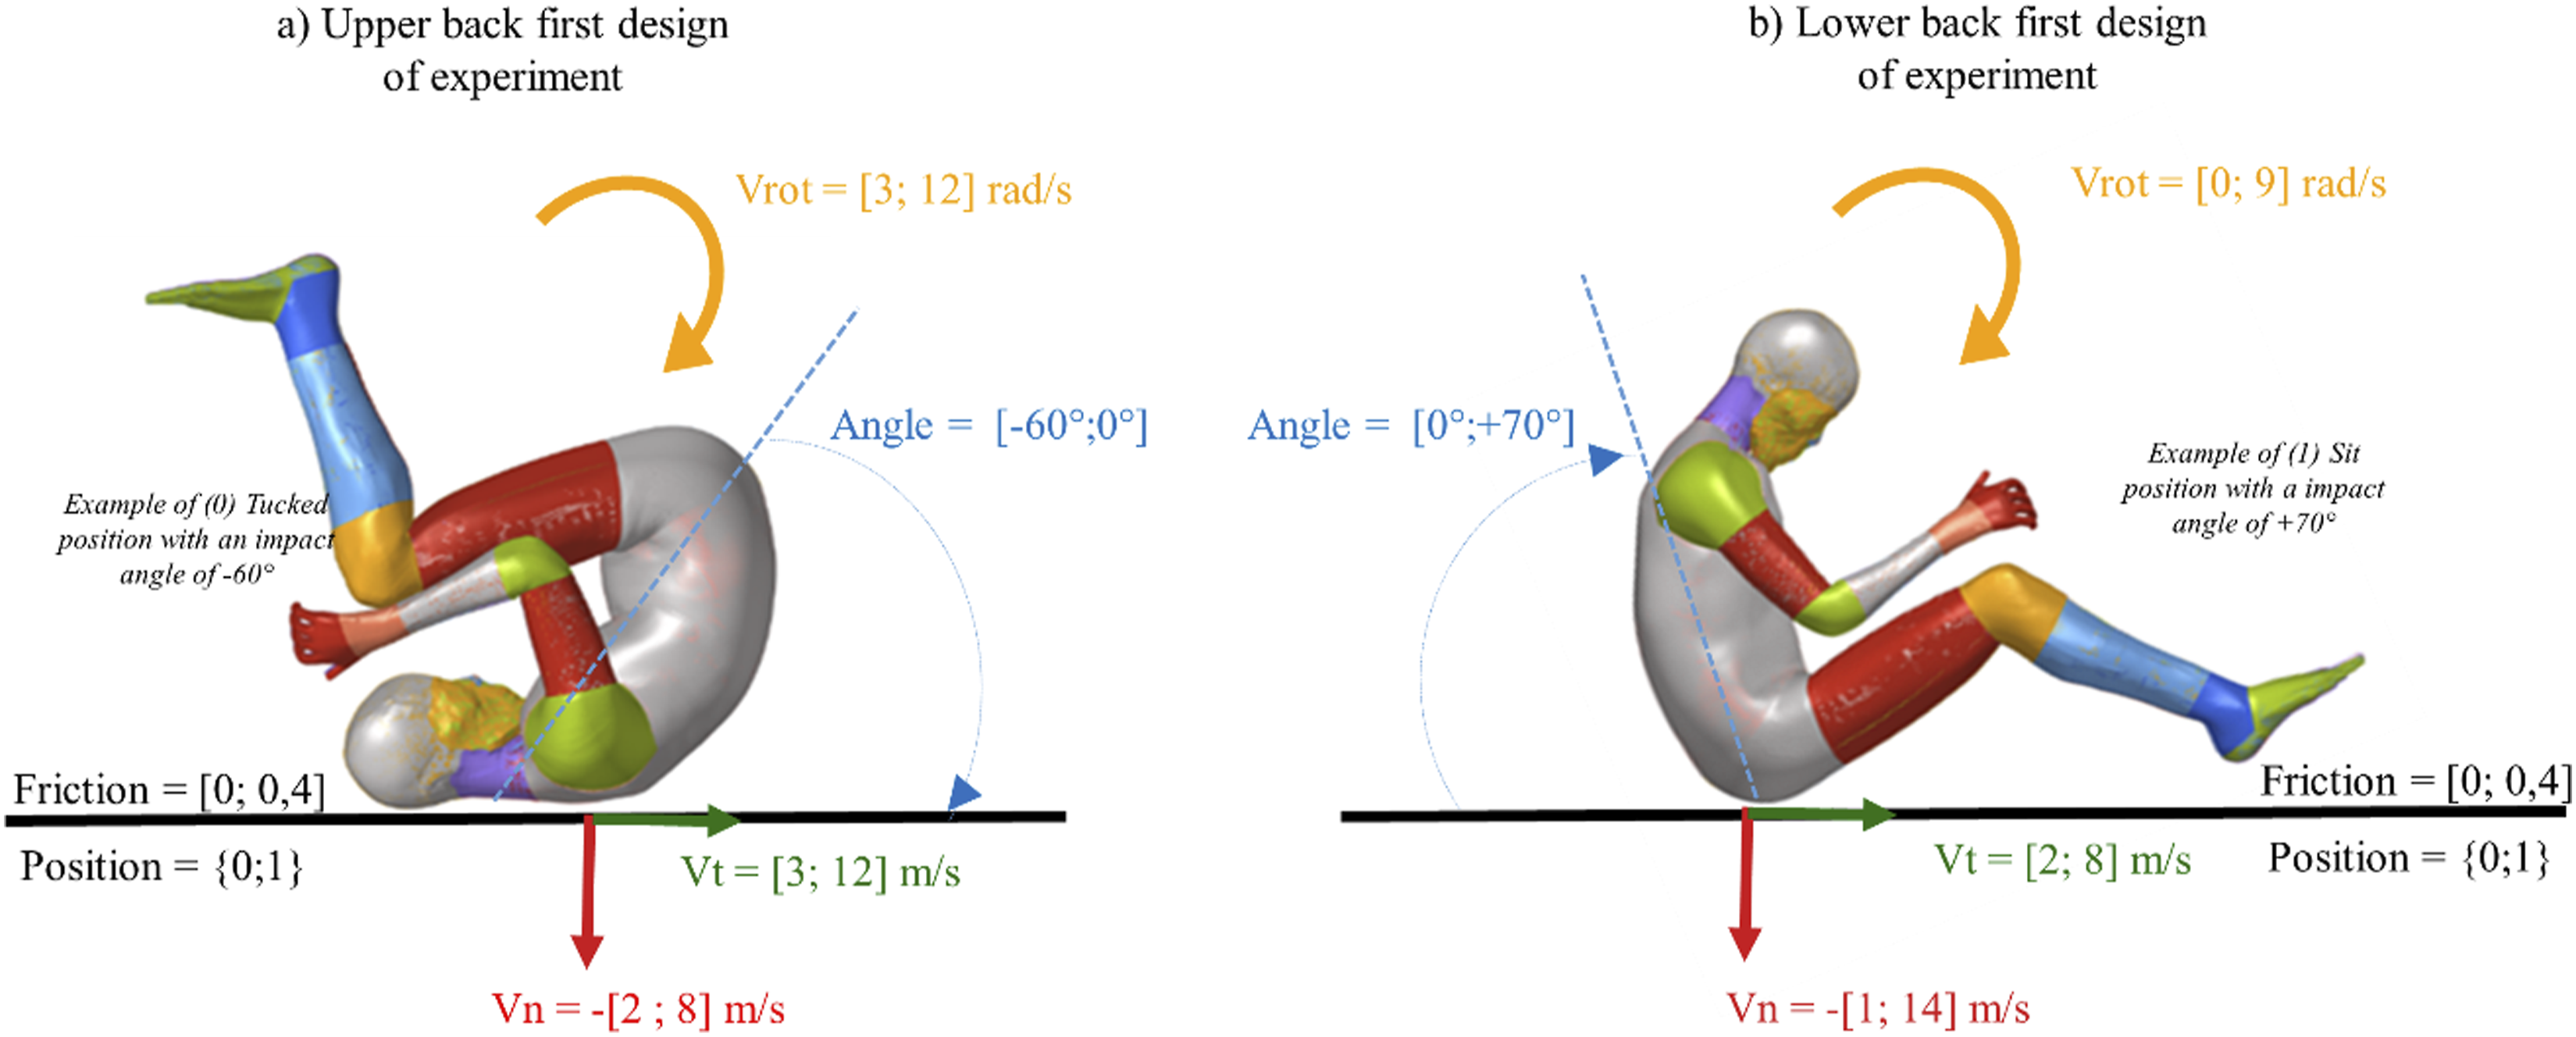
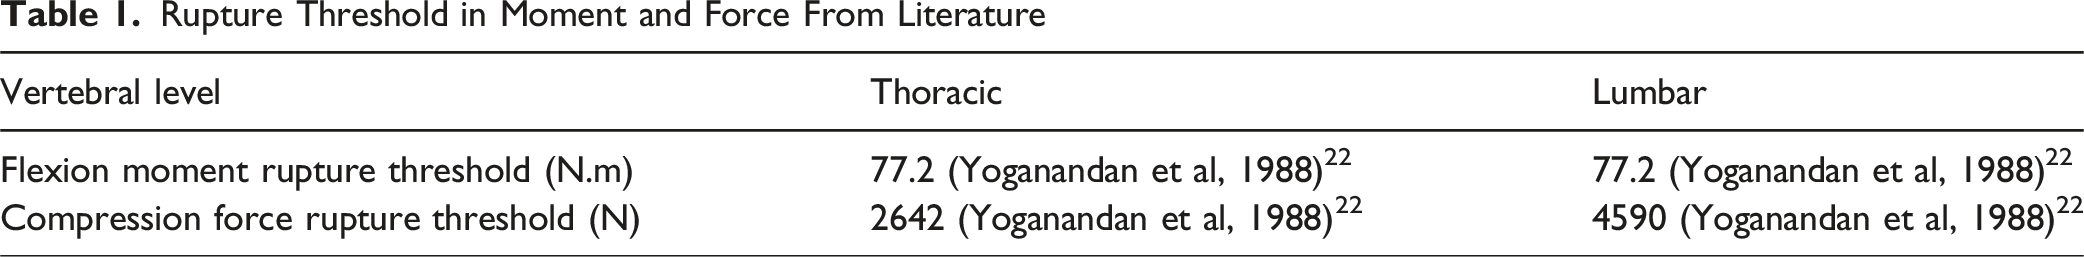
Rupture Threshold in Moment and Force From Literature
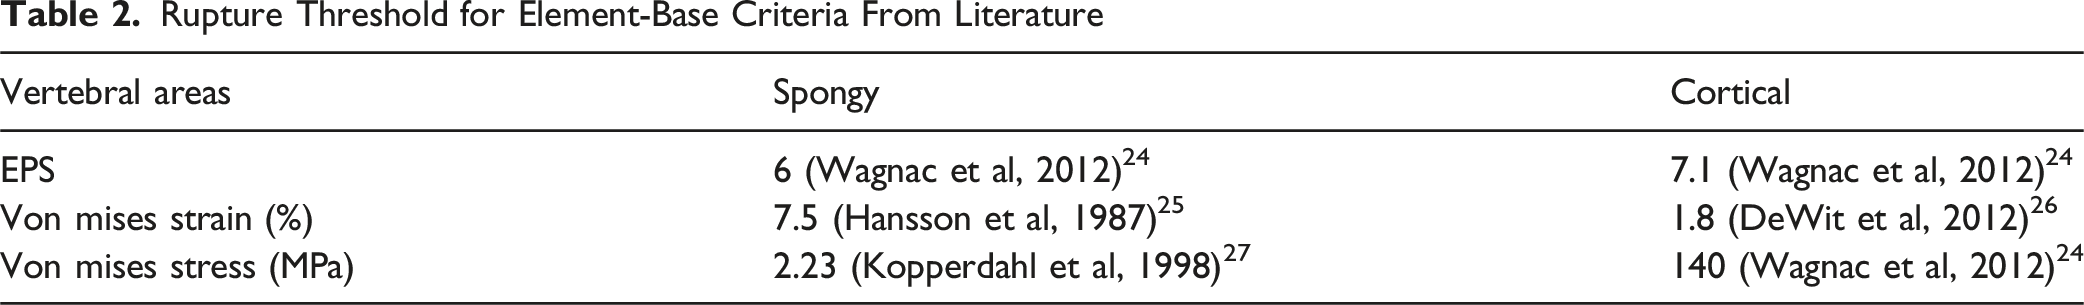
Rupture Threshold for Element-Base Criteria From Literature
Statistical Analysis
The statistical analysis aimed to examine the effect of impact conditions on injury risk and injury patterns. To simplify the analysis, three representative injury metrics were selected based on correlation analyses among the eight injury metrics: (1) maximum Von Mises strain in spongy bone (strongly correlated with EPS in both cortical and spongy bone, R2 = 0.83-0.98), (2) maximum force, used as a global indicator of loading, and (3) maximum moment, which showed moderate correlation with Von.
Mises stress (R2 = 0.63-0.76). Additionally, vertebrae were grouped into three anatomical region using hierarchical clustering, principal component analysis, and anatomical knowledge: thoracic (T1–T11), thoracolumbar junction (T12–L2), and lumbar (L3–L5).
To investigate the influence of explanatory variables (Vn,Vt, Vrot, Angle, Friction and Position) on injury metrics (maximum compression force, maximum moment, maximum von mises strain in spongy bone), separate multiple linear regression models (OLS) were run for each anatomical region (Upper Thoracic, Lower Thoracic, Thoracolumbar Junction, Lumbar). Regression coefficients (β) with 95% confidence intervals were calculated, and P-values were used to determine statistical significance (P ≤ 0.05). The relative contribution of each explanatory variable was visualized using forest plots. Analyses were conducted in Python (version 3.13.0).
Results
A total of 44 simulations were performed (22 for upper-back-first and 22 for lower-back-first impacts), with 37 (84%) predicting an injury at one or more vertebral levels. During the lower-back-first, the median ground reaction forces at impacts was 37.3 kN, which was more than double the 18.4 kN median force observed in upper-back-first impacts.
Three mechanical pathways leading to distinct patterns of compression fractures were identified through the analysis of von Mises strain in spongy bone (Figure 3). (a) Thoracolumbar compression fracture from a 45° lower-back impact (Figure 3A). Propagation of strain constraints in injury mechanisms representative cases. This figure illustrates the propagation of spongy von Mises strain in the thoracic and lumbar spine for three representative injury cases (a, b and c). An injury threshold of 7.5% is applied, highlighted in red on the graphs. Initial impact conditions are shown on the left and von mises strain in spongy spine at maximum values on the right

High-speed 45° lower-back impacts generated axial loading that propagated cranially as the body rotated. Load concentration and peak flexion at the T11–L2 region caused all injury criteria to be surpassed, resulting in a thoracolumbar compression fracture predicted at T12. (b) Upper-thoracic compression fracture from a 0° lower-back impact (Figure 3B).
Flat lower-back impacts with high normal and rotational velocities produced elevated strain at the upper thoracic spine upon ground contact. The lower-back impact, combined with the rotation of the upper torso, generated high flexion and compression in the upper thoracic region, resulting in a predicted compression fracture at T3. (c) Lumbar compression fracture from a −60° upper-back impact (Figure 3C).
Steep upper-back impacts did not surpass injury criteria at initial contact. Injury occurred during the subsequent unfolding phase, when the lower lumbar spine (L4–L5) struck the ground. Excessive flexion and localized vertebral-body loading produced a lumbar compression fracture at the sacro-lumbar junction.
The effect of impact conditions on injury assessment can be seen in Figure 4, which shows the number of injury criteria exceeded at each vertebral level for each simulated case, and in Figure 5, which illustrates the influence of impact conditions (Vn, Vt, Vrot, angle, position, friction) on maximum axial force in each region. Similar trends were found for moment and spongy Von Mises strain in Figure 8 (Appendix A). Heat maps representing the number of injury criteria exceeding their thresholds for each simulation case (rows) and each vertebral level (columns) for the DOE. Each row corresponds to a specific simulation scenario, defined by the normal (Vn), tangential (Vt), and rotational (Vrot) impact velocities, the angle of impact, friction coefficient and body position. Darker shades indicate a higher number of criteria exceeding their thresholds (maximum = 8) Forest plots of regression results for a) lower back and b) upper back first impacts. Coefficients (β) and 95% CIs show associations between six predictors (|Vn|, Vt, Vrot, Position, Angle, Friction) and maximal axial force in three spinal regions (Thoracic, Thoracolumbar, Lumbar). Filled circles indicate significant effects (P ≤ 0.05); open circles, non-significant. The dashed line at β = 0 represents no effect

Across both Lower Back (Figure 4A) and Upper Back (Figure 4B) impact scenarios, absolute normal velocity (|Vn|) emerged as the strongest predictor of overall injury risk. Statistical analysis (Figure 5) consistently showed a significant positive association between |Vn| and spinal loading (β > 0). This aligns with the heat map observations, where low normal velocities (|Vn| < 5-6 m/s) were rarely associated with injury prediction at any vertebral level; for instance, in Upper Back impacts, only 4 of 10 cases below 5 m/s exceeded injury thresholds. In contrast, rotational (Vrot) and tangential (Vt) velocities were rarely significant.
While velocity determined the magnitude of risk, the impact angle determined the location of the injury. This variable showed distinct effects between the two impact configurations. - Lower Back Impacts: A clear gradient was observed. Flat impacts (0°) produced high stress in the upper thoracic spine (peaking at T3–T4), supported by a negative β < 0 for thoracic risk in the statistical model. As the angle increased to 20-25°, injuries shifted to T6–T10, and at 45°, peak stresses concentrated at the thoracolumbar junction. The highest angles (70°) primarily affected the lumbar spine (β > 0). - Upper Back Impacts: High negative angles (−60°) combined with high normal velocities shifted injury prediction to the lumbar spine (L4–L5), despite the upper back being the primary impact site. Surprisingly, the upper thoracic spine consistently showed low injury scores in these scenarios, indicating the load was transmitted distally rather than causing local damage.
Body position showed a consistent positive association with spinal force in both configurations, indicating that the “sit” position (1) generates greater spinal loading than the “tucked” position (0). Friction exhibited wide confidence intervals, suggesting an unstable and variable influence on injury prediction.
For each simulation, the back impact force on the ground was extracted. For upper-back-first impacts, the median back impact force was 18.4 kN (25th percentile: 11.8 kN; 75th percentile: 25.0 kN). In contrast, for lower-back-first impacts, the median was 37.3 kN (25th percentile: 29.2 kN; 75th percentile: 46.7 kN). As for both DOE configurations back impact force was similarly influenced by the initial parameters, results were combined to perform a regression analysis linking back impact force to the initial parameters (|Vn|, Vt|, Vrot, angle, friction, and position). Across all simulations, Vn, Vt, angle, and position showed statistically significant effects on back impact force. Notably, Vn exhibited the strongest positive effect, indicating that higher |Vn| values substantially increase the resulting impact force (Figure 6). Regression analysis between back impact force (N) and absolute back impact normal velocity (m/s)
Finally, the correlation between back impact forces and the three main injury metrics for the vertebrae is presented in Figure 7. To capture the most critical loading condition for each simulation, only the vertebra exhibiting the highest metric value within each anatomical region was presented. Pearson and Spearman analyses showed that back impact force was positively correlated with maximum vertebral force, maximum spongy bone strain, and maximum flexion moment, particularly in the thoracic and thoracolumbar regions (R2 = 0.37-0.59, P < 0.05). In the lumbar region, back impact force remained significantly correlated with maximum vertebral force but not with the other metrics. Regression analysis of the relationship between injury metrics (maximum force (N), moment (N.mm) and spongy strain per vertebra) and maximum back impact force (N) on ground across three anatomical regions (Thoracic, thoracolumbar junction and lumbar). Each data point corresponds to a single simulation and represents the maximum value in any vertebrae within the considered anatomical region. Red dots indicate predicted injury (exceeding injury thresholds previously used), while blue dots represent non-injurious cases. Dashed lines represent linear regression trends with their associated coefficient of determination (R²). Vertical lines at 12 kN and 24 kN mark forces thresholds for the two levels defined in the back protectors standards EN1621-2
Discussion
This study is the first to investigate spinal loading and injury mechanisms in MTB crashes using FE modelling. Injuries at each vertebral level were predicted based on global (force, moment) and local (stress, strain) mechanical metrics. The effects of impact location, body position, and impact velocities on injury location and type were also evaluated. Most predicted injuries were compression fractures (Magerl type A) occurring at a distance from the impact site and associated with hyperflexion of the body. This mechanism differs substantially from those currently considered in standard back protector testing protocols. These findings provide new insights into MTB crash biomechanics and question the need to revisit current protection assessment methods.
Spinal Injury Mechanisms in MTB
Through 44 simulations of rolling impacts, we identified three primary injury mechanisms, all combining axial loading and hyperflexion. • Thoracolumbar compression fractures (T12–L2) induced by impacts to the lower back at approximately 45°. • Upper thoracic compression fractures resulting from flat (0°) back impacts. • Sacro-lumbar junction fractures (L4-L5) generated by an initial impact to the upper thoracic spine, followed by a “whiplash-like” motion of the lumbar spine against the ground.
These simulated mechanisms closely correspond to real-world injury cases. Bonte et al (2025) 10 analyzed 35 spinal injuries in MTB and found that rolling impacts frequently produced compression fractures in the thoracic and upper lumbar regions.
Our findings also highlight the critical importance of realistic impact components. Wei et al (2023), 25 who modelled impacts with only normal velocity (Vn) reported only isolated spinous process fractures. In contrast, our results show that when rotational (Vrot) and tangential (Vt) components are included, the mechanism shifts to hyperflexion, and fractures primarily affect the vertebral body. This supports the hypothesis that out-of-normal components (non-perpendicular impact directions) are essential to reproduce realistic spinal injury mechanisms, mainly by inducing hyperflexion and complex loading patterns. Although fracture typology has not been extensively documented in MTB, the identification of three mechanical pathways leading to Magerl type A fractures align with clinical observations in winter sports, where compression and burst fractures account for up to 73-78% thoracolumbar injuries.5,26 Overall, our results reinforce the understanding that MTB-related spinal injuries are dominated by compression-type fractures caused by combined translational and rotational impacts with various angle orientation rather than isolated axial loading alone.
Influence of Impact Conditions on Spinal Risk
Across all simulations, the normal component of impact velocity (Vn) consistently emerged as the primary driver of spinal injury risk. Higher absolute values of Vn were associated with a greater number of exceeded injury criteria, confirming the dominant role of axial loading in spinal trauma. However, the impact angle and initial body position also strongly influenced the regional distribution of fractures. • Steeper positive (falling on buttocks) or negative angles (falling on the upper back) tended to produce lumbar injuries. • Intermediate positive angles (falling on the lower back) most frequently affected the thoracolumbar junction. • Flatter impacts primarily caused upper thoracic fractures.
Furthermore, the sit position appeared more injurious than the tucked position. This is likely because the straighter, more rigid spine in a ‘sit’ posture is more conducive to the direct propagation of axial compression forces, whereas a ‘tucked’ posture may better dissipate energy through rotation. This finding mirrors phenomena observed in automotive safety research. Studies27,28 indicate that restraining the pelvis with a seatbelt enforces a rigid base similar to our “sit” configuration. This restraint can paradoxically increase axial force transmission to the thoracolumbar junction, thereby elevating the risk of fracture under vertical loading. Specifically, Pachocki et al (2021) 28 highlighted the critical role of vertical forces during the ‘vehicle landing’ phase following a barrier collision. They demonstrated that the axial force transmitted through the seat pan is the primary driver of injury, but crucially, that the occupant’s posture (particularly spinal flexion) at the moment of impact drastically alters the loading pattern. Collectively, these findings confirm that spinal injury mechanisms are multifactorial, arising from the interaction between axial loading, impact angle, and posture at the time of impact. The location and type of fracture depend on how these parameters combine to modify the direction and magnitude of transmitted forces through the spine.
Implications for Back Protector Design and Evaluation
In the current EN1621-2 standard, 16 a sharpened curbstone-like impactor strikes the back protector at a normal velocity of 4.4 m/s, generating an impact energy of 50 J. The transmitted force is measured directly beneath the impact site. This setup appears to represent a scenario in which the rider’s back impacts a pointed surface, causing injury primarily at the location of contact.
In our study, the normal impact speed and the resulting impact force on the back were highly correlated and both served as good predictors of injury occurrence. This confirms that reducing back impact force is a valuable objective for protective equipment design. However, our findings showed that injuries rarely occurred directly beneath the impact site but rather at some distance from it. These injuries were not associated with direct force transmission perpendicular to the back protector (sagittal loading). Instead, they were linked to spinal hyperflexion and axial loading. This mechanism was induced by a combination of normal, tangential, and rotational impact velocities, and was further influenced by impact location and body posture. These injury mechanisms are not currently assessed in existing standards, and to our knowledge, no scientific studies have evaluated back protectors under such realistic loading conditions. Future standards should evaluate protectors under rolling or multi-axial loading conditions to better reflect real-world crash kinematics.
This is problematic as in a prospective study of injured motorcyclists, Afquir et al1 17 showed that current back protectors appear ineffective in preventing compression fractures. The present study may partially explain those finding as it suggests that the compression fracture mechanisms (observed in MTB crashes) differ from those reproduced in standard motorcyclist back protector tests.
Beyond the different injury mechanisms identified, the specific impact conditions defined in the current standard also differ from those investigated in this study. • Impact surface: The standard test uses a curbstone-shaped anvil representing a pointed impact, whereas our study considered a flat surface, which applies a very different load type and contact area to the back protector. In MTB crashes, both configurations can occur, as riders may impact flat ground as well as rocks or roots.
29
These findings suggest that both curbstone and flat impacts should be considered in back protector evaluations. • Impact velocity: The standard test applies a normal impact velocity of 4.4 m/s, whereas our simulations rarely predicted fractures below 5 m/s. • Force thresholds: The standard defines force thresholds of 24 kN for Level 1 and 12 kN for Level 2 protectors. In our simulations, peak forces ranged between 4 kN and 60 kN. However, vertebral injuries were predicted even with back impact forces as low as 5 kN, well below the Level 1 or Level 2 force thresholds. This suggest that these thresholds might be too high. Suggesting that. This was particularly highlighted when assessing injury via von mises strain in spongy bone or flexion moment in lumbar spine.
Overall, the present study shows that, although the current standard evaluates important functions of back protectors, the test setup is not representative of the actual impact conditions—nor of the injury mechanisms responsible for the main types of thoracolumbar vertebral fractures in MTB. Further studies are needed to determine whether current back protectors are effective in preventing these injury mechanisms and whether the existing testing conditions provide an appropriate proxy for evaluating MTB back protection.
Limits
First, this study investigated spinal fracture risk under realistic impact conditions previously identified as frequent in MTB crashes, focusing on six impact parameters (including speed, position, and ground type). However, these simulated conditions do not capture the full range of impacts an MTB rider may experience during a fall onto the back. This study focused exclusively on transverse plane impacts (“over-the-bars “ falls), while side falls and out-of-plane rotations were not considered. Future work should consider them to capture the full spectrum of MTB-related spinal injuries. Second, this study used a 50th-percentile male model, as most injured MTB riders are male (70-92%).2,30–32However, future work should assess how differences in female spinal geometry and bone mineral density might alter the thresholds and locations of predicted fractures. Third, the model did not include muscle activation, even though riders have been shown to exhibit some protective reflexes during MTB falls. 33 While these reflexes are likely less effective during back impacts, the absence of active tension may influence spinal stiffness and the subsequent distribution of vertebral loads during the unfolding phase of a fall, which should be explored in future work. Finally, there is no clear consensus on the most appropriate metrics and thresholds for predicting vertebral fractures. This study used eight of the best predictors and their associated thresholds to estimate injury risk, but further work is needed to refine fracture prediction using finite element human body models.
Conclusion
In this study, finite element (FE) analysis was used to predict spinal injury risk under realistic impact conditions in mountain biking forward fall (MTB). Three distinct injury mechanisms were identified: flat impacts leading to upper thoracic spine injuries, 45° lower back impacts causing thoracolumbar junction compression fractures, and upper thoracic impacts resulting in lumbar spine injuries. In all three cases, the predicted injuries were compression fractures (Magerl type A) occurring at a distance from the impact site and associated with body hyperflexion. These spinal traumas arose from the combined effects of axial loading, impact angle, and rotational motion rather than from a single perpendicular impact. Normal velocity remained the dominant factor influencing injury risk, but tangential and rotational components significantly affected the regional distribution of loading. These mechanisms differ substantially from that considered in current back protector testing protocols, which rely solely on perpendicular drop tests, and suggests that future evaluation methods should incorporate more realistic loading scenarios and refined pass/fail criteria to better represent real-world crash conditions.
Footnotes
Acknowledgments
During the preparation of this manuscript, the authors used Gemini AI to generate elements of statistical code in RStudio and to aid in the synthesis of content. The authors also employed DeepL for vocabulary refinement. The authors have reviewed and edited the output and take full responsibility for the content of this publication.
Author Contributions
Conceptualization, S.B., A.T., G.O., L.T., N.B. and P.-J.A.; methodology, S.B., G.O. and N.B.; formal analysis, S.B; investigation, S.B. and G.O.; writing—original draft preparation, S.B.; writing—review and editing, S.B., A.T., G.O., L.T., N.B. and P.-J.A. All authors have read and agreed to the published version of the manuscript.
Funding
The authors disclosed receipt of the following financial support for the research, authorship, and/or publication of this article: This research was found by the ANRT grant 2022/1791 and the Innovation Committee of Decathlon.
Declaration of Conflicting Interests
The authors declared the following potential conflicts of interest with respect to the research, authorship, and/or publication of this article: S.B. and A.T. are employed by the company Decathlon, which manufactures bikes and protective equipment.
Data Availability Statement
The data presented in this study are available on request from the corresponding author.
Appendix
Forest plots of regression results for a) lower back and b) upper back first impacts Coefficients (β) and 95% CIs show associations between six predictors (Vn, Vt, Vrot, Position, Angle, Friction) and three injury criteria (maximal axial force, maximal flexion moment, maximum spongy strain) in three spinal regions (Thoracic, Thoracolumbar, Lumbar). Filled circles indicate significant effects (P ≤ 0.05); open circles, non-significant. The dashed line at β = 0 represents no effect