
Abstract
Study Design
Retrospective study and prospective cohort study.
Objective
Osteoporotic vertebral compression fracture (OVCF) is a frequent and disabling complication of osteoporosis. This study aimed to identify independent risk factors for OVCF, develop and validate a predictive model, and evaluate a risk-stratified surgical strategy comparing percutaneous vertebroplasty (PVP) and percutaneous kyphoplasty (PKP).
Methods
The study consisted of 3 stages. A retrospective cohort of 316 patients was used to identify risk factors and construct a predictive model, which was externally validated in an independent cohort of 274 patients. A prospective cohort of 206 OVCF patients was then enrolled to compare clinical and radiographic outcomes of PVP and PKP. Patients with a predicted risk score >0.5 were classified as high risk and preferentially treated with PKP. Pain, functional outcomes, radiographic parameters, and complications were evaluated preoperatively and at 1 week, 3 months, and 6 months postoperatively.
Results
Multivariate analysis identified age ≥70 years, body mass index <20 kg/m2, bone mineral density T-score ≤−3.0, history of falls, and 25-hydroxyvitamin D deficiency as independent risk factors. The predictive model showed good calibration and clinical utility. Both PVP and PKP significantly improved pain and function. Within the risk-stratified strategy, PKP was associated with greater improvements in pain relief, functional recovery, and radiographic restoration, as well as lower rates of cement leakage and refracture.
Conclusion
A validated predictive model for OVCF was established and may support individualized surgical decision-making. Risk-stratified use of PKP appears to provide superior short- to mid-term outcomes in high-risk patients.
Keywords
Introduction
Osteoporosis is one of the most common chronic diseases in aging societies worldwide, characterized by reduced bone mass and deterioration of trabecular microarchitecture. 1 One of its most severe clinical consequences is osteoporotic vertebral compression fracture (OVCF), the most common type of fragility fracture with the highest disability rate. OVCF not only causes acute and chronic back pain but also often leads to spinal deformity, functional decline, significant reduction in quality of life, and even increased mortality risk. With the rapid growth of the elderly population, the prevention and treatment of osteoporotic fractures have become urgent public health issues. 2 Early identification and timely intervention in high-risk populations are key to reducing the disease burden.
Previous studies have shown that the occurrence of osteoporotic fractures is associated with multiple factors, including advanced age, female sex, low body mass index (BMI), 3 decreased bone mineral density, previous fracture history, and bone metabolism disorders. 4 However, current knowledge of fracture risk factors remains incomplete. Most studies are limited by small sample sizes, single-center data, or simplistic statistical methods, and fail to reveal the complex interactions among multiple factors. Therefore, a systematic analysis of independent predictors of vertebral fractures in patients with osteoporosis is of great importance for optimizing prevention and clinical management.
In addition to identifying risk factors, how to effectively treat OVCF remains a major challenge in clinical practice. Traditional conservative treatments such as bed rest, analgesics, and bracing often fail to achieve satisfactory pain relief or functional recovery. Over the past 2 decades, minimally invasive vertebral augmentation techniques, including percutaneous vertebroplasty (PVP) and percutaneous kyphoplasty (PKP), have become the preferred surgical approaches for OVCF. 5 These techniques restore vertebral stability by injecting bone cement into the fractured vertebra, thereby relieving pain and improving mobility. Although both procedures are widely used, their efficacy and safety remain controversial. 6 Some studies suggest that PKP provides better vertebral height restoration and kyphosis correction, whereas PVP offers certain advantages in pain relief, operative time, and cost. However, both surgeries carry potential risks such as cement leakage, adjacent vertebral refracture, and long-term recurrence. 7
Despite increasing clinical evidence, comprehensive studies combining risk factor analysis for fractures with postoperative outcome evaluation are still lacking. Most existing literature focuses either on predictors of fracture occurrence8,9 or on comparing the efficacy of PVP 10 and PKP, without examining the link between the 2. Consequently, clinicians often lack evidence-based guidance that integrates risk stratification with surgical decision-making.
Importantly, fracture risk prediction alone does not dictate surgical choice. Rather, identifying patients at higher risk of fracture may help recognize those more likely to experience vertebral instability, progressive collapse, or refracture, in whom procedural strategies that provide better height restoration and kyphosis correction may be considered. Thus, risk stratification may serve as a supportive tool to inform individualized treatment planning, rather than as a determinant of procedural selection.
Therefore, this study aimed to: (i) systematically analyze independent risk factors for vertebral fractures in patients with osteoporosis; and (ii) compare the clinical efficacy and safety of PVP and PKP in the treatment of OVCF. By integrating risk factor analysis with postoperative outcome evaluation, this study seeks to provide a more comprehensive understanding of OVCF management. The findings are expected to facilitate early identification of high-risk patients and support the development of individualized surgical strategies, ultimately improving prognosis and reducing complication rates.
Methods
Study Design
This study was conducted in 3 stages. The first stage was a retrospective cohort study. From February 2021 to March 2023, a total of 316 patients with osteoporosis who met the inclusion criteria were enrolled, including 161 in the fracture group and 155 in the non-fracture group. Clinical and radiographic characteristics were compared between the 2 groups. Univariate analysis was used to screen potential risk factors, and significant variables were subsequently entered into multivariate logistic regression to identify independent risk factors for osteoporotic vertebral fracture. Sample size was calculated according to the events-per-variable (EPV) method. Assuming 10 covariates with 10-15 events per variable, the >150 fracture events in this stage were sufficient to ensure the statistical power of modeling analysis.
In the prospective cohort, the choice between PVP and PKP was guided by a risk-stratified clinical pathway. Patients with a predicted fracture risk score >0.5 were considered at higher risk for biomechanical instability and progressive collapse; therefore, PKP was preferentially recommended when surgical indications were met, based on its potential advantages in vertebral height restoration and kyphosis correction. However, the final procedure selection also incorporated surgeon judgment and patient preference, and was not protocol-mandated.
The second stage was an external validation study. An independent validation cohort of 274 patients was collected from the same period, including 170 fracture cases and 104 non-fracture cases. The logistic regression risk prediction model developed in the first stage was validated in this independent cohort. The model’s discrimination and calibration in the external sample were assessed using the area under the receiver operating characteristic (ROC) curve (AUC), the Hosmer–Lemeshow goodness-of-fit test, and calibration curves. Based on sample size calculation for AUC validation, assuming an AUC of 0.75, α = 0.05, and power of 0.80, at least 240 patients were required; the actual 274 cases satisfied this requirement. In addition, according to the criteria of Riley et al 1 11 and Snell et al, 1 12 the minimum sample size should allow precise estimation of both model discrimination (C-index/AUC) and calibration. Specifically, ≥100 events and ≥100 non-events are recommended to ensure stable estimation of the calibration slope and calibration-in-the-large.
The third stage was an evaluation of outcomes within a risk-stratified clinical decision pathway. From April 2023 to July 2024, 206 consecutively enrolled patients newly diagnosed with OVCF who met the inclusion criteria underwent either PVP or PKP. Patients with a risk score >0.5 according to the predictive model were classified as high-risk, and when surgical indications were met, PKP was preferentially performed (80 cases). The remaining patients underwent PVP (126 cases). All patients were followed at baseline (preoperatively), and at 1 week, 3 months, and 6 months postoperatively. Outcomes included pain [visual analog scale (VAS)], functional recovery [Oswestry Disability Index (ODI)], radiographic parameters (anterior vertebral height and Cobb angle), and complications. Sample size was calculated for repeated-measures design, assuming a standardized effect size of 0.5 for postoperative reduction in VAS, with α = 0.05 and power of 0.80, requiring at least 63 patients per group. Considering a 10% loss to follow-up, ∼70 patients per group were needed. The actual enrollment of 206 patients met these requirements.
Inclusion, Exclusion Criteria, and Study Variables
Inclusion criteria: (i) diagnosis of osteoporosis according to World Health Organization (WHO) criteria [T-score ≤ −2.5 standard deviations on dual-energy X-ray absorptiometry]; (ii) radiographically confirmed vertebral compression fracture; (iii) age ≥18 years; and (iv) complete clinical data.
Exclusion criteria: (i) pathological fractures caused by high-energy trauma, tumor, or infection; (ii) previous spinal surgery; (iii) severe cardiopulmonary dysfunction precluding surgery; and (iv) incomplete follow-up data. Patients with acute OVCF who failed conservative treatment (eg, medication and bed rest) were assigned to the PVP group (n = 126) or the PKP group (n = 80).
All procedures were performed by experienced spine surgeons under local anesthesia and fluoroscopic guidance. During PVP, polymethylmethacrylate (PMMA) bone cement was directly injected into the collapsed vertebra. During PKP, an inflatable balloon was first inserted to restore vertebral height and correct kyphosis before cement injection. Surgical parameters, including operative time, blood loss, cement volume (The volume of polymethylmethacrylate cement was determined based on vertebral body size, fracture morphology, and intraoperative fluoroscopic monitoring, aiming to achieve adequate filling without excessive leakage.), and perioperative complications, were recorded.
The volume of polymethylmethacrylate (PMMA) cement was not predetermined but was individually adjusted for each patient under continuous biplanar fluoroscopic monitoring. Cement injection was performed slowly and incrementally, with real-time assessment of cement distribution, vertebral body filling pattern, and early signs of leakage. Injection was immediately stopped when cement approached the posterior vertebral wall, cortical defects, or venous structures. This fluoroscopy-guided strategy allowed adequate vertebral stabilization while minimizing the risk of cement leakage.
The volume of bone cement injected during augmentation was determined intraoperatively under continuous fluoroscopic monitoring and tailored according to vertebral size, fracture morphology, and leakage risk. In the literature, cement volume in PVP procedures commonly ranges from approximately 3-5 mL per level, with mean volumes around 3.9 mL (range 0.1-10.8 mL). 13 Several clinical studies indicate that volumes greater than 4 mL are associated with improved clinical outcomes, and a range of approximately 4-7 mL is frequently used to balance efficacy and safety. 14 In comparative studies, PKP procedures often involve higher cement volumes, with reported means around 4.7-7.4 mL, reflecting balloon-created cavity space allowing for additional cement. 15 Biomechanical analyses further suggest that volumes in the range of 4-6 mL may optimize vertebral stability while avoiding excessive stiffness or leakage.
Primary outcomes included pain relief (VAS), functional recovery (ODI), 16 Relative vertebral height (%), and Cobb angle correction rate. Secondary outcomes included cement leakage, adjacent vertebral refracture, and overall complication rates. Risk factor analysis considered variables such as age, sex, BMI, bone mineral density, prior fracture history, smoking and alcohol history, comorbidities, and bone metabolism markers. Long-term glucocorticoid use was defined as continuous systemic administration equivalent to ≥5 mg/day of prednisone for at least 3 months.
Vertebral height was measured at the anterior margin of the fractured vertebral body on lateral radiographs. The reference height was defined as the mean anterior height of the adjacent non-fractured vertebrae. Relative vertebral height (%) was calculated as postoperative height divided by reference height × 100%. A higher value indicates greater vertebral height restoration.
Relative vertebral height (%) was calculated as:
Ethics Statement
This study was approved by the Ethics Committee of our hospital. All procedures followed the principles of the Declaration of Helsinki (revised in 2013). Before enrollment, the study purpose, methods, potential risks, and benefits were fully explained to all participants and/or their legal guardians, ensuring informed choice and voluntary participation. Written informed consent was obtained from all participants. For patients unable to provide consent due to disease condition or cognitive impairment, consent was obtained from their legal guardians. All data were used solely for research purposes, and patient confidentiality was strictly maintained.
Bias Reduction
Because the study involved 2 surgical procedures (PVP and PKP), blinding of surgeons and patients was not feasible. To minimize bias, partial blinding was applied during data collection and outcome assessment. Specifically, postoperative evaluations of pain (VAS), function (ODI), and imaging parameters (Relative vertebral height and Cobb angle) were performed by independent assessors blinded to treatment allocation. Data entry and statistical analyses were conducted independently by another group of researchers, who were also blinded to patient allocation. These measures were taken to reduce observer and analytical bias. In the prospective cohort, the predicted fracture risk score was used for risk stratification and clinical reference, but it did not mandate procedural selection. The choice between PKP and PVP was based on a comprehensive evaluation of vertebral morphology, degree of height loss, kyphotic deformity, imaging features suggestive of instability, patient preference, and economic considerations. As a result, although PKP was more frequently performed in patients with higher risk scores, PVP remained an option when clinical circumstances favored this approach.
Radiographic Assessment
Radiographic measurements (vertebral height, kyphotic angle, and cement leakage) were independently performed by 2 experienced spine surgeons who were blinded to group allocation and clinical outcomes. Interobserver discrepancies ≥2° for kyphotic angle or ≥2 mm for vertebral height were resolved by consensus. Interobserver reliability was evaluated using the intraclass correlation coefficient (ICC), which demonstrated excellent agreement(good agreement (ICC >0.80).
Statistical Analysis
All analyses were performed using SPSS version 26.0 (IBM, Armonk, NY, USA) and GraphPad Prism version 10.0 (GraphPad Software, San Diego, CA, USA). Continuous variables were expressed as mean ± standard deviation and compared between groups using independent-samples t tests or Mann–Whitney U tests, as appropriate. Categorical variables were expressed as frequencies and percentages, and compared using χ2 tests or Fisher’s exact test. Multivariate logistic regression was used to identify independent risk factors for fractures, with odds ratios (ORs) and 95% confidence intervals (CIs) reported. Kaplan–Meier survival analysis with log-rank tests was used to evaluate fracture-free survival. ROC curves were used to assess the discriminatory performance of the prediction model. A two-tailed P value <0.05 was considered statistically significant.
Results
Baseline Characteristics Between Fracture and Non-fracture Groups
Comparison of Baseline Characteristics Between Fracture and Non-Fracture Groups

Note. Continuous variables are expressed as mean ± SD and compared using independent-samples t-test; categorical variables are expressed as n (%) and compared using χ2 test.
Univariate Analysis of Fracture Risk Factors
Univariate Analysis of Risk Factors Associated With Fracture Occurrence

Note. Data are presented as n (%) and compared using χ2 test. P < 0.05 was considered statistically significant. Age ≥70 years is generally regarded as a threshold for markedly increased osteoporosis and fracture risk and is commonly used in guidelines or epidemiological stratification. A T-score ≤−2.5 is diagnostic for osteoporosis, while ≤−3.0 indicates severe osteoporosis with higher fracture risk. In osteoporosis studies, BMI <20 kg/m2 is typically defined as “low BMI.” Clinically, vitamin D deficiency is defined as <20 ng/mL, insufficiency as 20-30 ng/mL, and sufficiency as ≥30 ng/mL.
Multivariate Logistic Regression Analysis
Multivariate Logistic Regression Analysis of Independent Risk Factors for Fracture

Note. The binary predictor was coded as 1 = high-risk status and 0 = reference; the outcome was coded as 1 = event. An OR>1 indicates an increased probability of event occurrence. Multivariate logistic regression was performed with fracture as the dependent variable (fracture = 1, non-fracture = 0). Odds ratios (ORs) with 95% confidence intervals (CIs) were calculated to identify independent risk factors for fracture.
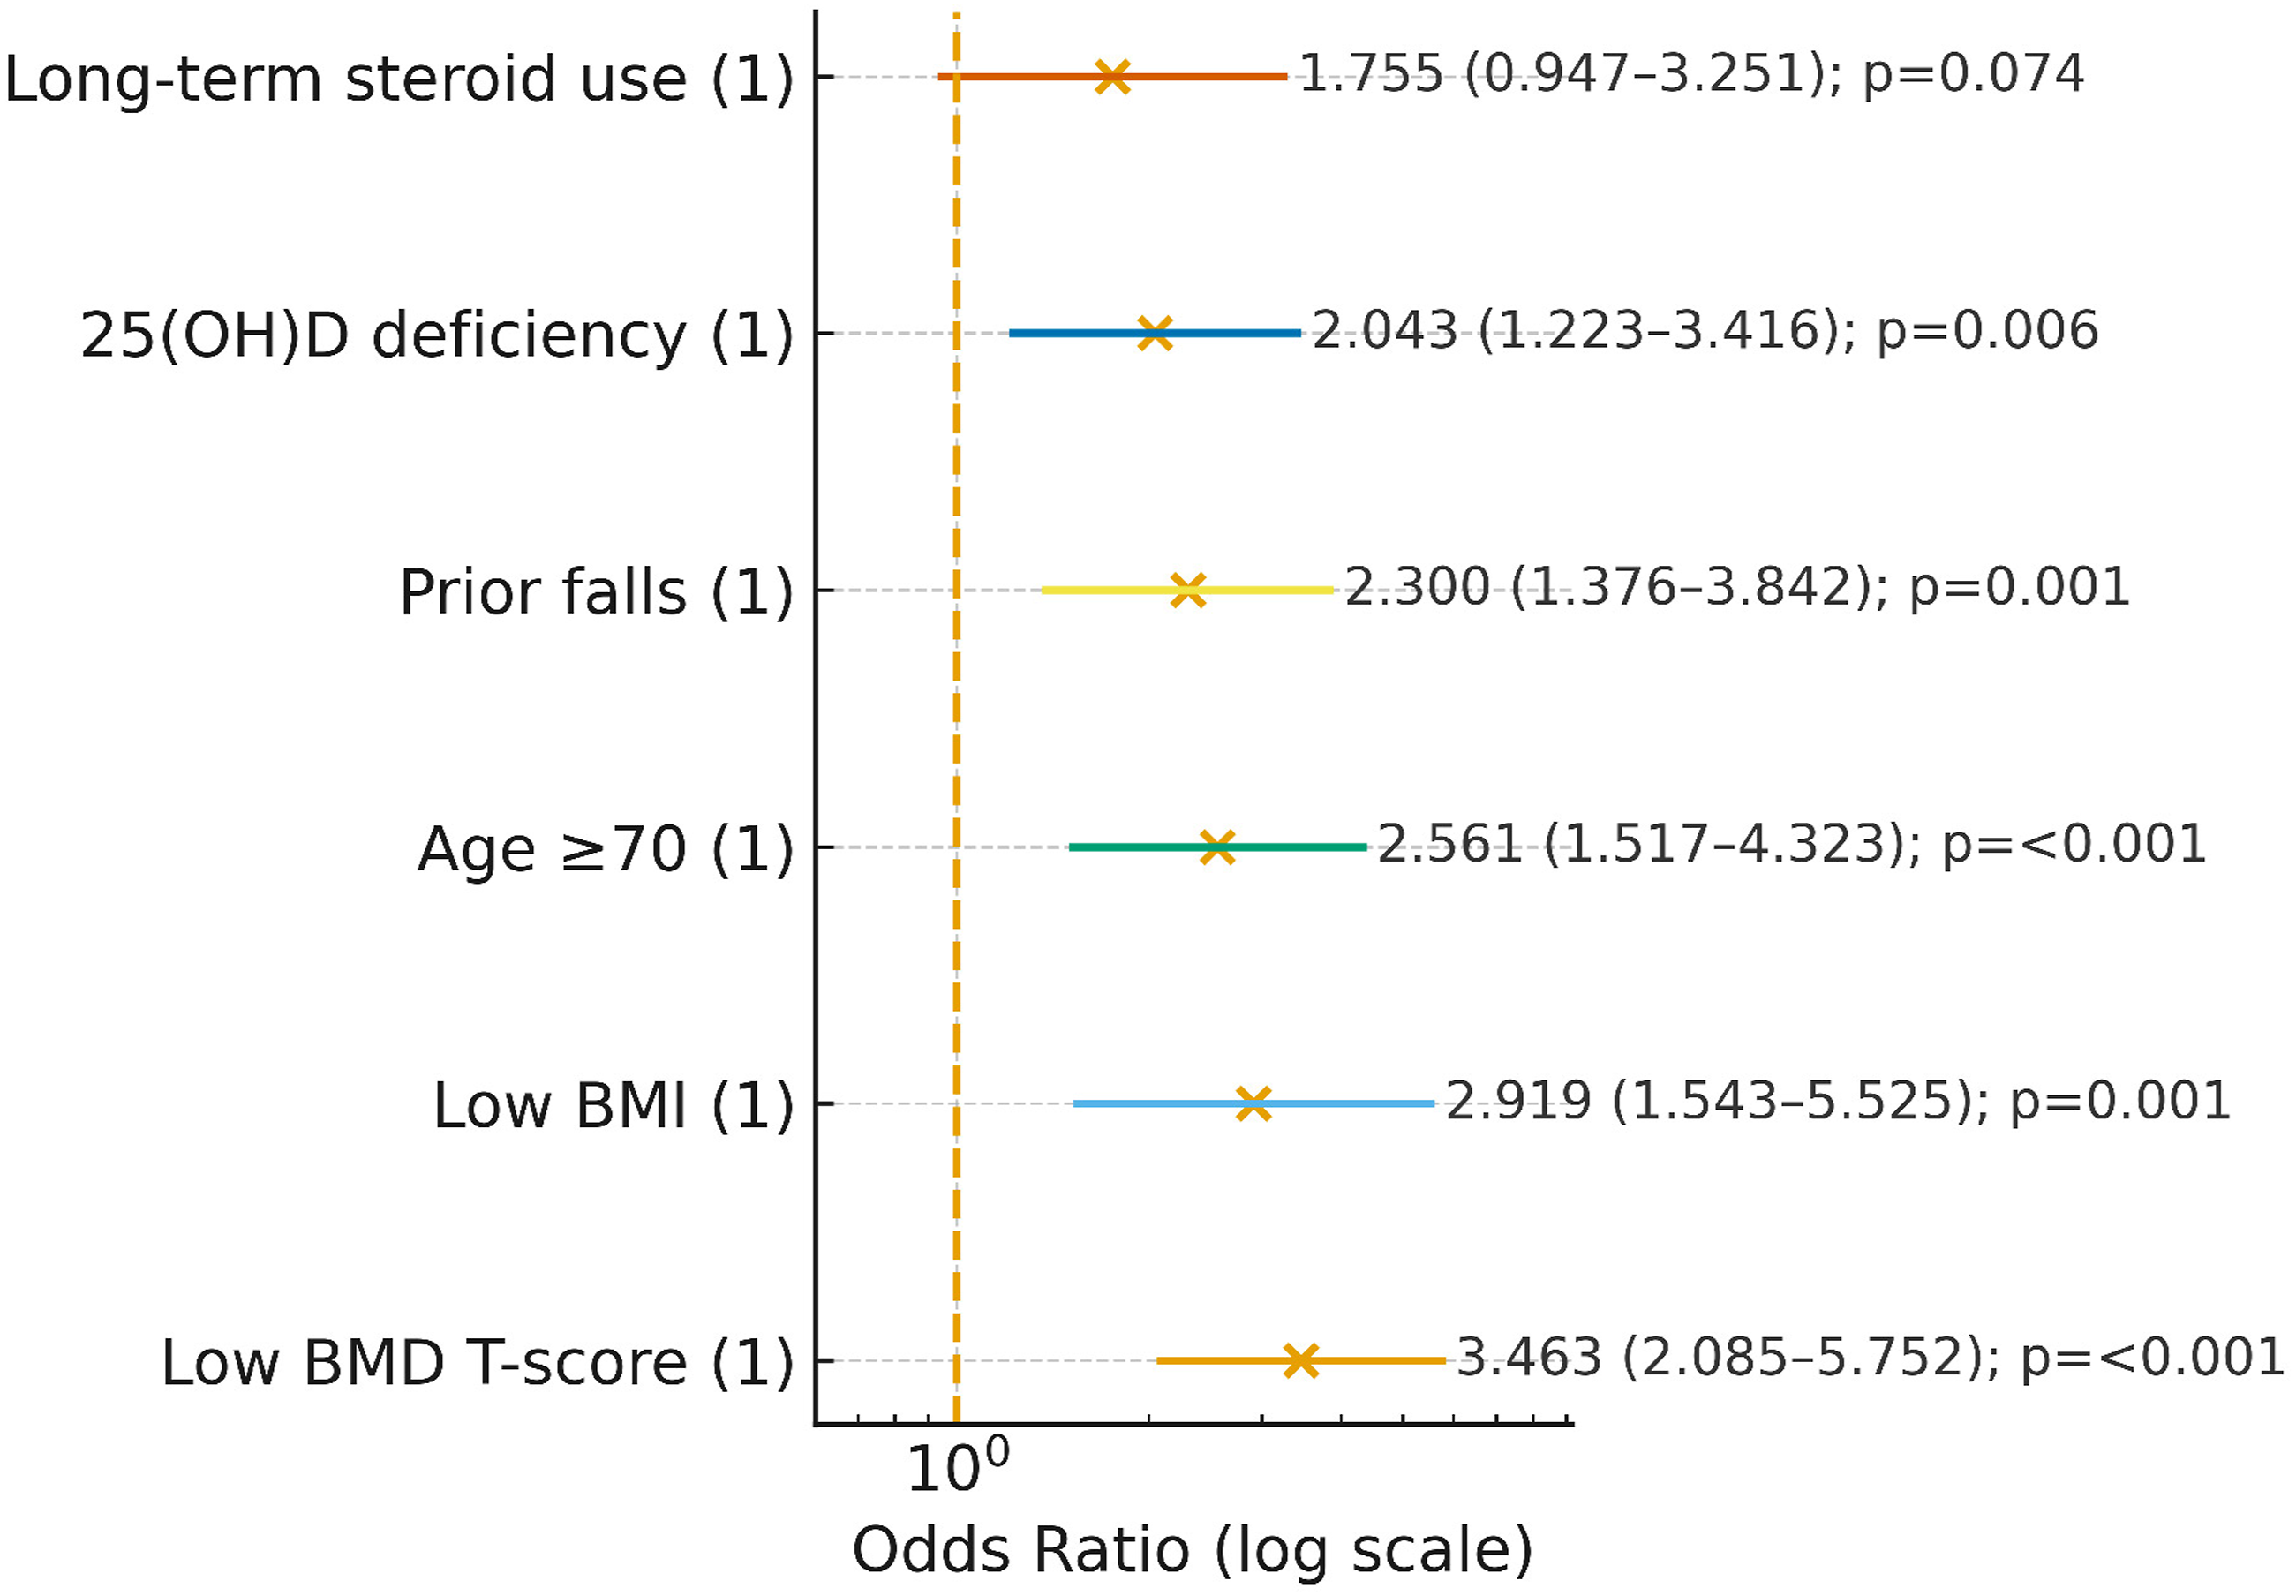
Forest plot of independent risk factors for osteoporotic vertebral fracture. The forest plot displays odds ratios (ORs) and their 95% confidence intervals (CIs) on a logarithmic scale. All variables were uniformly coded as binary indicators (1 = high-risk or exposure present; 0 = reference). The vertical dashed line represents OR = 1. Among the identified predictors, low bone mineral density (BMD T-score ≤ −3.0) showed the largest effect size, followed by low body mass index (BMI <20 kg/m2) and age ≥70 years. A history of falls and 25-hydroxyvitamin D [25(OH)D] deficiency were also significantly associated with fracture risk, whereas long-term glucocorticoid use demonstrated a borderline association
ROC Curve Analysis
ROC Curve Analysis of Individual Risk Factors and Combined Prediction Model for Fracture

Note: AUC = area under the curve; S.E. = standard error; 95% CI = 95% confidence interval. Sensitivity and specificity were calculated at the optimal cutoff determined by the Youden index.

ROC curves of individual risk factors and combined prediction model for fracture
Risk Prediction Model Construction
Based on multivariate logistic regression (Table 3), the final fracture risk model was established as follows: Logit(P) =
The predicted probability of fracture was calculated using the following equation:
All predictors were coded as binary variables (1 = presence, 0 = absence).
To facilitate clinical application, we provide a practical example. Consider a 75-year-old patient with BMI <20 kg/m2, BMD T-score ≤ −3.0, a history of falls, and vitamin D deficiency, but without long-term glucocorticoid use. Substituting these values (coded as 1 or 0) into the regression equation yields a predicted fracture probability exceeding 0.70, indicating high fracture risk. In contrast, a younger patient without these risk factors would have a substantially lower predicted probability. This example illustrates how the model may assist clinicians in individualized risk estimation and shared decision-making.
External Validation, Discrimination, Calibration, and DCA
In an external validation cohort (fracture n = 170, non-fracture n = 104), the model achieved an AUC of 0.8385 (95% CI: 0.7879-0.8890, P < 0.0001; Youden index = 0.5533), with sensitivity 87.06% and specificity 68.27%, indicating strong discrimination (Figure 3). Hosmer–Lemeshow test showed χ2 = 10.39, P = 0.239, suggesting good calibration. Calibration plots demonstrated close agreement between predicted and observed risks (Figure 4A–B). Additional indices were: calibration-in-the-large = +0.12, calibration slope = 1.27, Brier score = 0.20, reflecting mild risk overestimation and moderate predictive accuracy (Figure 4C). DCA confirmed net clinical benefit across threshold probabilities of 0.1-0.7 compared with “treat all” or “treat none” strategies (Figure 4D). ROC curve of the fracture risk prediction model in the external validation cohort. The model achieved an AUC of 0.8385 (95% CI: 0.7879-0.8890, P < 0.0001), sensitivity of 87.06%, and specificity of 68.27% Calibration and DCA of the fracture risk prediction model in external validation. (A) Hosmer–Lemeshow test assessing overall calibration. The blue line represents observed event rate, and the orange line represents predicted event rate. (B) Calibration curve showing agreement between predicted and observed probabilities. The black dashed line represents ideal calibration. (C) Bar chart of calibration metrics. (D) DCA

Clinical Validation of the Model
A prospective study was conducted in 206 patients with OVFs admitted between April 2023 and July 2024 who underwent PVP or PKP. According to the risk model, patients with predicted risk >0.5 and surgical indication underwent PKP (n = 80), while others received PVP (n = 126).
Pain Relief (VAS Scores)
Comparison of VAS Scores Between PKP and PVP Groups

Note. Baseline VAS scores followed normal distribution and are expressed as mean ± SD, compared using independent-samples t-test. Follow-up VAS scores followed skewed distribution and are expressed as median (IQR), compared using Mann–Whitney U test. P < 0.05 was considered statistically significant.

Trends in VAS score changes between PKP and PVP groups
Functional Recovery (ODI Scores)
Comparison of ODI Scores Between PKP and PVP Groups

Note. Baseline ODI scores followed normal distribution and are expressed as mean ± SD, compared using independent-samples t-test. Follow-up ODI scores followed skewed distribution and are expressed as median (IQR), compared using Mann–Whitney U test. P < 0.05 was considered statistically significant.
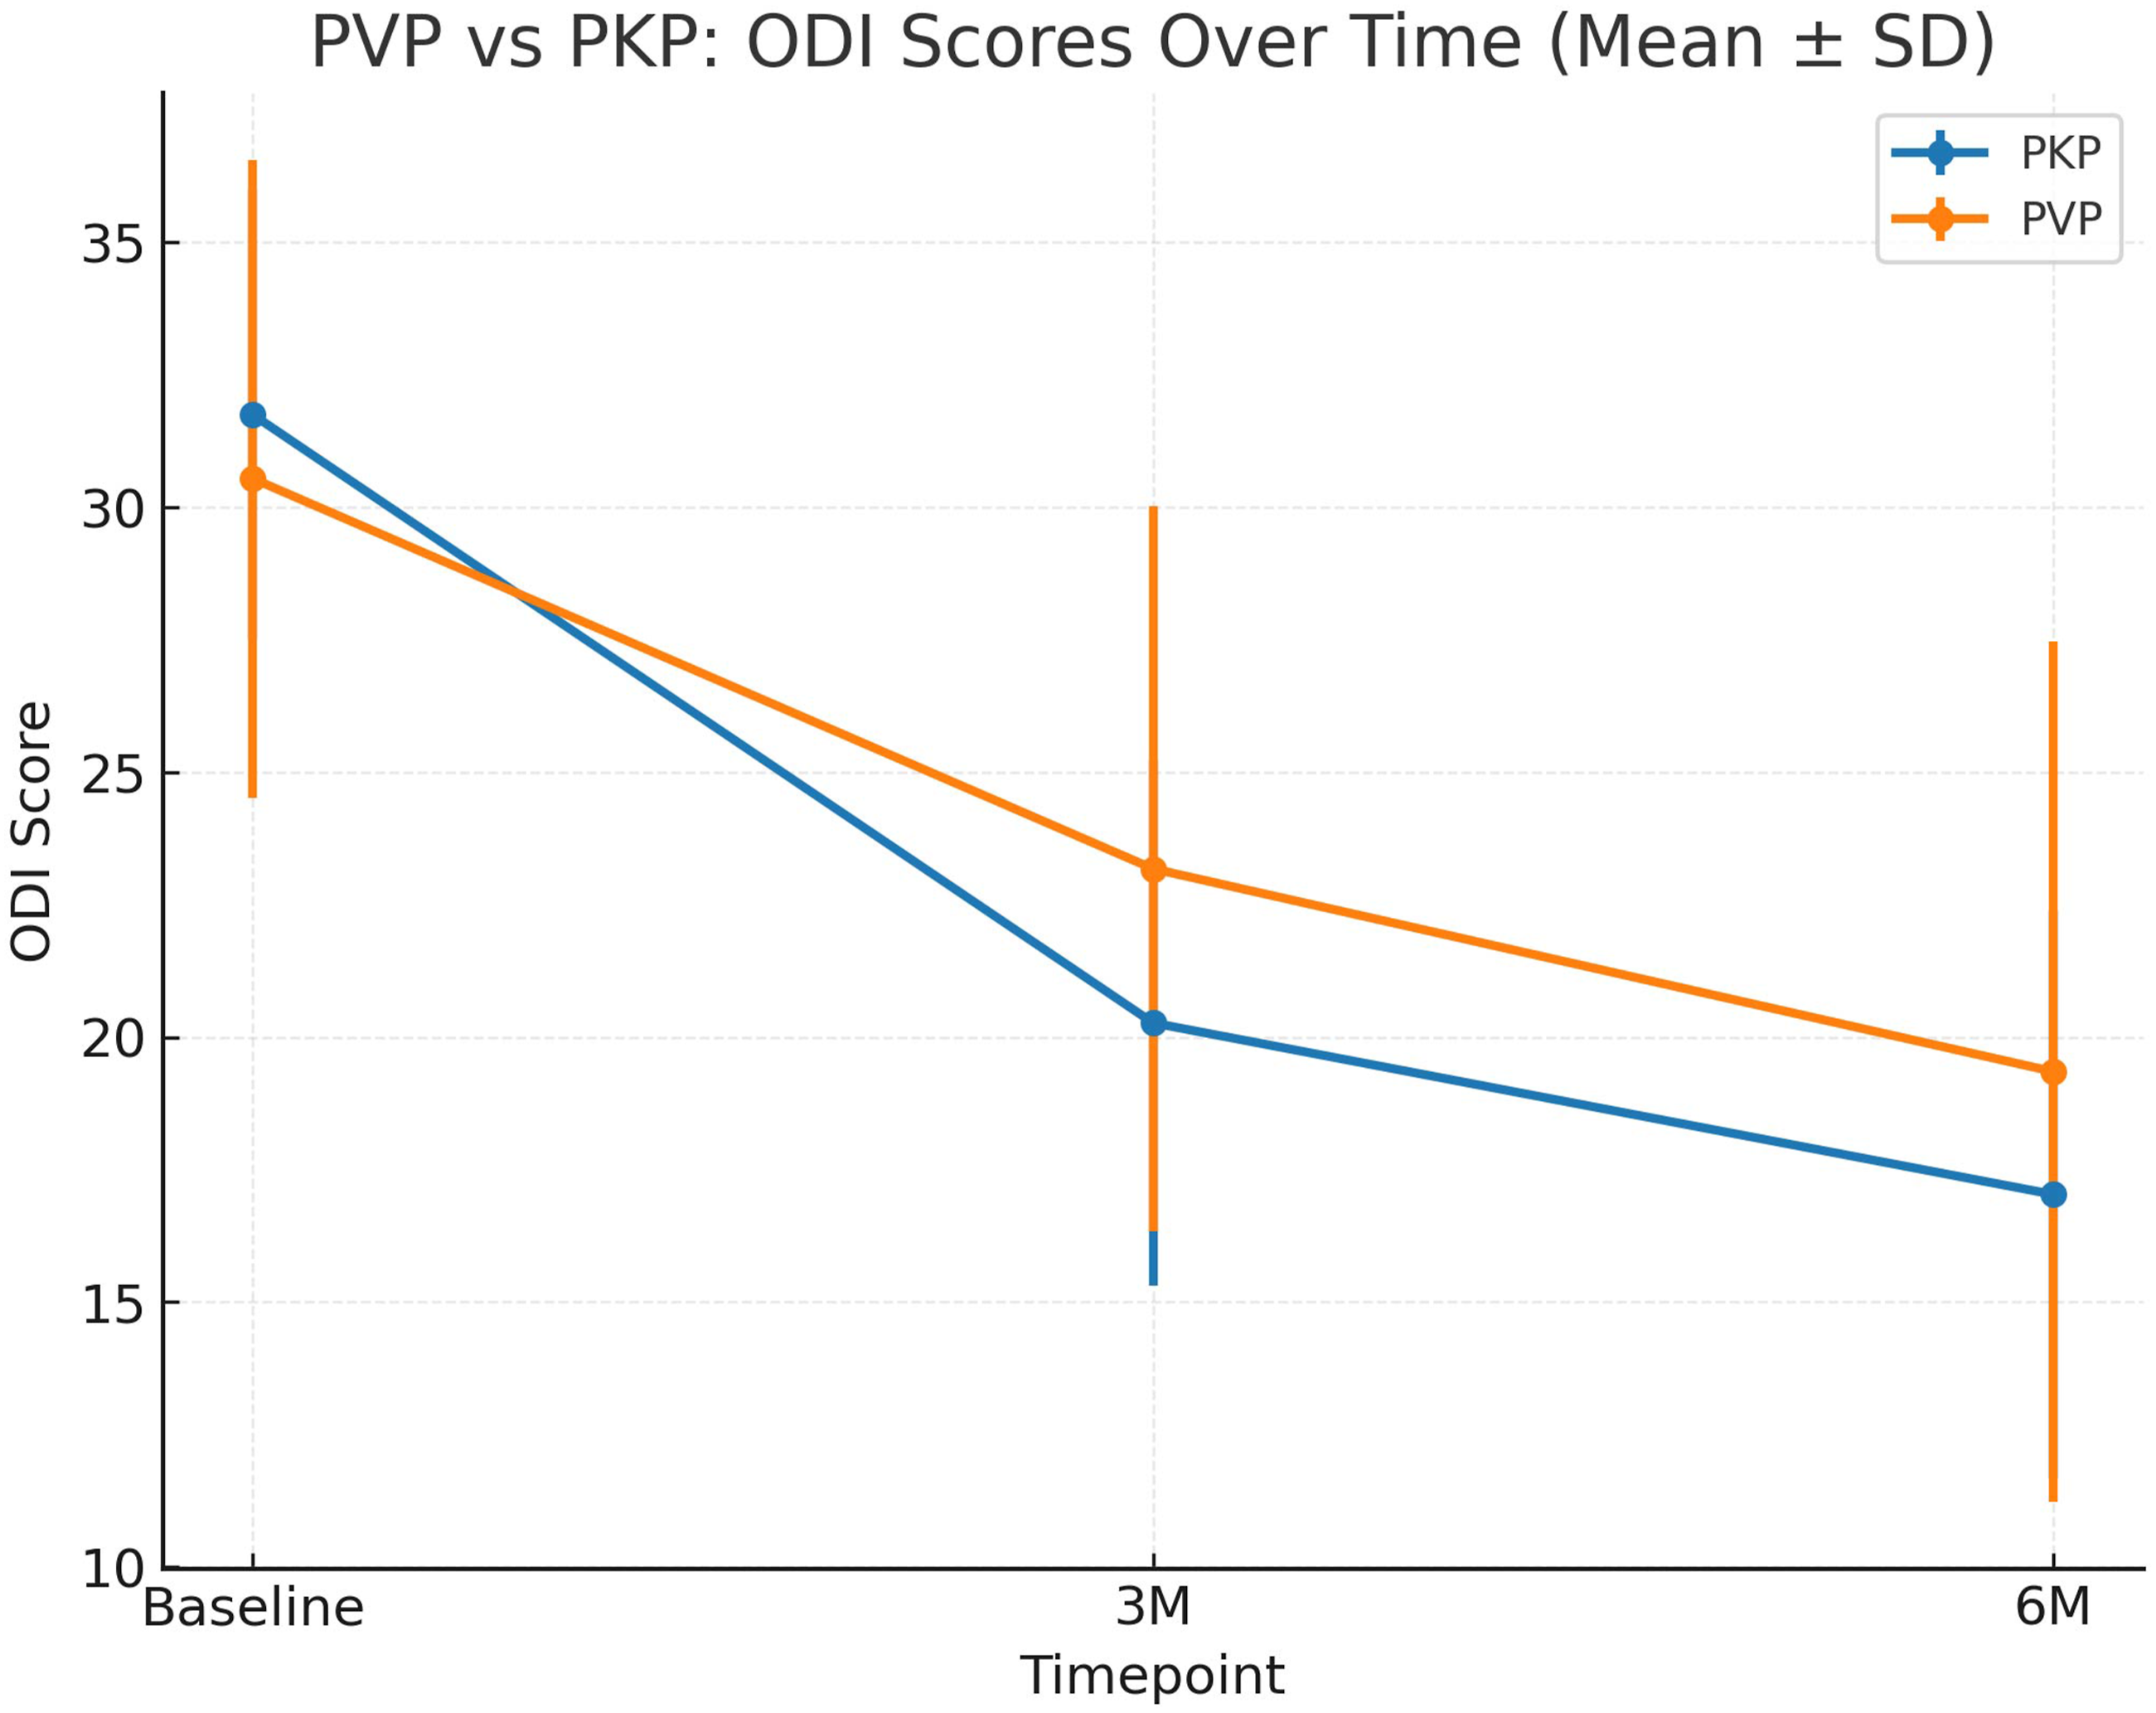
Trends in ODI score changes between PKP and PVP groups. Error bars represent standard deviation
Radiological Outcomes (Relative Vertebral Height, Cobb Angle)
Comparison of Radiological Parameters Between PKP and PVP Groups

Note. Relative vertebral height (%) [A higher value indicates better vertebral height restoration rather than increased compression]. And Cobb angle are expressed as mean ± SD. Between-group comparisons were performed using independent-samples t-test; within-group comparisons were performed using paired t-test. P < 0.05 was considered statistically significant.
Complications and Refracture
Comparison of Complications and Refracture Rates Between PKP and PVP Groups

Note. Categorical variables are expressed as n (%) and compared using χ2 test. P < 0.05 was considered statistically significant.

Kaplan–Meier curves for refracture and cement leakage in PKP and PVP groups
Discussion
OVCF is one of the most common and burdensome types of fragility fractures in the context of global population aging, seriously affecting patients’ quality of life, functional independence, and long-term survival. 17 Therefore, identifying its risk factors and exploring optimal treatment strategies have important clinical and social implications. In this study, through a design combining retrospective cohort analysis with prospective observation, we not only systematically analyzed the independent risk factors of vertebral fractures in patients with osteoporosis but also constructed and validated a risk prediction model.18,19 Meanwhile, we compared the clinical efficacy and complications of 2 commonly used minimally invasive surgical techniques, PVP and PKP, thereby forming a complete research chain of “risk prediction-surgical selection-efficacy validation.”
This study yielded 3 major findings. First, among osteoporotic patients, age ≥70 years, BMI <20 kg/m2, BMD T-score ≤−3.0, history of falls, and 25(OH)D deficiency 20 were confirmed as independent risk factors for vertebral fracture. Second, a multivariate logistic regression–based risk prediction model incorporating these variables demonstrated good discrimination and calibration in both the training and external validation cohorts, suggesting stable predictive performance. Third, in prospective observation, using this risk model to guide the choice of PVP/PKP showed that PKP was superior to PVP in postoperative pain relief, functional improvement, vertebral height restoration, and kyphosis correction, with lower rates of cement leakage and refracture.
Compared with previous domestic and international studies, the main risk factors identified here (advanced age, low BMD, low BMI, history of falls, and 25(OH)D deficiency) are largely consistent with published findings. 21 Large-scale epidemiological data indicate that a BMD T-score ≤−2.5 SD is diagnostic of osteoporosis, while a further reduction to ≤−3.0 SD markedly increases fracture risk. Similarly, low BMI and vitamin D deficiency have been repeatedly confirmed to be closely associated with fracture. 20 The present findings are consistent with these reports, 22 further strengthening the robustness of the evidence. However, regarding the role of long-term glucocorticoid use, our results differ from some international studies: after multivariate adjustment, glucocorticoid use was not identified as an independent risk factor. This discrepancy may be related to differences in dosage, indications, and duration of glucocorticoid exposure across study populations. Although long-term glucocorticoid use was associated with fracture risk in univariate analysis, it did not retain statistical significance in the multivariable model, suggesting that its effect may be partly confounded or mediated by other variables such as bone mineral density and age.
Regarding fracture risk prediction models, 23 several tools for osteoporosis or vertebral fracture risk stratification have been developed,19,24 but most lack external validation, limiting their clinical applicability. In the present study, the model was externally validated in an independent cohort, achieving an AUC of 0.84 with good calibration. DCA further indicated consistently high net clinical benefit across various thresholds. These findings align with recent methodological guidelines for prediction model research, which emphasize both discrimination and calibration, and further support the feasibility of applying this model for clinical risk stratification.
Although statistically significant differences in VAS and ODI scores were observed between the PKP and PVP groups, their clinical relevance should be interpreted in the context of established minimal clinically important difference (MCID) thresholds. Previous studies suggest that a reduction of approximately 1.5-2.0 points on the VAS and an improvement of 8-10 points on the ODI are generally required to represent a clinically meaningful benefit. In the present study, the between-group differences in VAS at early postoperative follow-up, particularly at 1 week, approached or exceeded these MCID thresholds, indicating clinically relevant early pain relief with PKP. However, at 3 and 6 months, although differences remained statistically significant, their magnitude was smaller and may not consistently reach MCID criteria. Therefore, PKP appears to offer more rapid symptomatic improvement, while longer-term functional differences should be interpreted cautiously.
Therefore, although PKP was associated with favorable trends in pain relief, functional recovery, and radiographic outcomes, these findings should not be interpreted as definitive evidence that PKP is universally superior to PVP based solely on patient-reported outcomes. Rather, the selection of PKP vs PVP should be guided by a risk-stratified and patient-centered approach, taking into account fracture severity, vertebral height loss, kyphotic deformity, risk of cement leakage or refracture, as well as patient preference and cost considerations.
As for treatment, the comparison between PVP and PKP remains controversial.25,26 Our prospective results demonstrated that PKP was superior to PVP during short- and mid-term follow-up, 27 especially in pain relief and ODI improvement. Imaging outcomes also showed greater efficacy of PKP in vertebral height restoration and Cobb angle correction, along with lower complication rates. These findings are in line with prior reports suggesting that balloon expansion in PKP improves vertebral collapse and reduces cement leakage, thereby lowering the risk of refracture. Nonetheless, it should be noted that PKP requires longer operative time and higher costs; thus, clinical decision-making must weigh patient risk stratification against economic burden.
The clinical significance of this study lies in proposing an integrated strategy of “risk prediction plus surgical guidance.” By using the model for risk assessment, high-risk patients can be identified early, and PKP can be preferentially recommended when indicated, thereby reducing refracture risk and improving long-term outcomes. For low-risk patients, PVP may be prioritized, achieving individualized and precision-based treatment. Presenting the model in probability form facilitates direct estimation of individual patient risk and supports its translation into clinical decision-making tools.
This study also has several strengths. First, the relatively large sample size and the combination of retrospective analysis with prospective validation enhanced the robustness of the findings. Second, inclusion of an independent external validation cohort increased the generalizability of the model. Third, the study not only focused on risk factors and modeling but also incorporated a surgical efficacy comparison, establishing a complete evidence chain from prediction to intervention.
Nevertheless, limitations should be acknowledged. (i) This was a single-center study, with potential regional bias; multicenter data are required for further validation. (ii) The follow-up duration in the prospective arm was limited to 6 months, precluding assessment of long-term efficacy and refracture risk. (iii) Potential influencing factors such as bone turnover markers, inflammatory mediators, and lifestyle variables were not included, leaving possible residual confounding. (iv) Although external validation was conducted, the applicability of the model in different populations and healthcare settings requires further testing. Importantly, the use of a predicted risk score to guide treatment selection reflects routine clinical practice but may also introduce confounding by indication. Although this strategy enhances individualized care, it limits causal inference when comparing PKP and PVP. Accordingly, our results should be interpreted in the context of a risk-guided treatment framework rather than as a head-to-head comparison of surgical techniques.
Future research directions include: (i) extending follow-up to evaluate long-term outcomes and refracture risk; (ii) conducting external validation across multiple centers and diverse populations to enhance generalizability; (iii) integrating biomarkers, AI-based imaging, and multimodal data to optimize prediction performance; and (iv) exploring individualized, risk-stratified intervention pathways to achieve precision management of osteoporotic fractures.
In conclusion, this study is the first to integrate a risk prediction model with a comparative evaluation of PVP and PKP efficacy, proposing a novel strategy of “risk prediction–guided surgical selection.” The findings demonstrate that the model performs well in fracture risk prediction, and that stratified intervention based on the model enhances the therapeutic value of PKP while reducing complication risk. Therefore, the model served as a clinical decision support tool for risk stratification, rather than a directive for procedural selection. This strategy provides new evidence for individualized management of OVCF and has important implications for clinical practice.
Footnotes
Ethical Considerations
This study was approved by the Ethics Committee of The Second Affiliated Hospital of Shandong First Medical University (No. 2021-024).
Consent to Participate
Written informed consent was obtained from all participants. For patients unable to provide consent due to disease condition or cognitive impairment, consent was obtained from their legal guardians.
Author Contributions
Zhuang Zhu, Ying Li designed the study. Jixiang Chen, Shuang Su prepared figures and tables. Ru Tao, Defeng Wang wrote the main manuscript text. All authors reviewed the manuscript.
Funding
The authors disclosed receipt of the following financial support for the research, authorship, and/or publication of this article: This work was supported by grants from the Tai’an Science and Technology Innovation and Development Project (policy guidance) (No. 2020NS270) and Shandong Medical and Health Science and Technology Development Project (No. 202002081477).
Declaration of Conflicting Interests
The authors declared no potential conflicts of interest with respect to the research, authorship, and/or publication of this article.
Data Availability Statement
The data supporting the findings of this study are available from the corresponding author upon reasonable request.