
Abstract
Study Design
Retrospective cohort study.
Objectives
Postoperative surgical site infections (SSI) remain a major cause of morbidity and cost in spine surgery. Existing risk calculators have limited applicability in this population. This study introduces a literature-informed, point-based SSI calculator designed to complement standard preoperative assessment. GPT-4 (OpenAI, San Francisco, CA) was used solely for structured literature synthesis and preliminary variable weighting.
Methods
Adult patients undergoing spine surgery at a single academic center (2019-2025) were retrospectively reviewed. A 29-variable AI-assisted risk calculator integrating demographic, clinical, laboratory, and surgical factors was developed. SSI was defined using CDC/NHSN criteria with a 90-day window. Risk calculator performance was evaluated using receiver operating characteristics (ROC) curve analysis, bootstrap optimization correction, and calibration and decision curve analyses. A stratified analysis was performed comparing performance by procedure types and spinal regions.
Results
A total of 338 patients were included (SSI: 177; controls: 161). Median risk scores were significantly higher in infected vs non-infected patients (18 vs 10; P < .001). Discrimination was strong (AUC 0.7978, 95% CI 0.7521-0.8427). The optimal threshold was 17 points, yielding 61.0% sensitivity, 84.2% specificity, and 72.1% accuracy. Bootstrap validation showed minimal optimism (corrected AUC 0.7974). Calibration was excellent (calibration-in-the-large <0.001; slope 1.045; Brier score 0.1833). At the study prevalence (52.3%), PPV was 0.8106 and NPV 0.6540, with expected PPV reduction at real-world prevalence. Patients with scores ≥17 had significantly higher infection risk (RR 2.42; OR 8.31; P < .001). Stratified analyses showed consistent performance across procedure types and spinal regions.
Conclusion
This internally validated, AI-assisted SSI calculator demonstrated strong discrimination and calibration. Prospective external validation is needed to determine clinical utility.
Introduction
The number of spine surgeries performed globally has steadily increased over the last 20 years. Concomitant increase in post operative complications is an important concern that can be mitigated1-3 One complication of particular concern is surgical site infection (SSI), with rates of deep SSI ranging from 1% to 4% in spine surgery. 4 SSI can significantly affect patient outcomes resulting in increased morbidity, prolonged hospital stays, higher reoperation rates, and increased rates of pseudoarthrosis in fusion procedures.4-8
To mitigate SSI, many healthcare organizations use preoperative risk assessment tools which allow for surgical optimization based on addressing patient-specific risk factors. 5 By evaluating variables like obesity, diabetes, smoking, and surgery duration, clinicians can flag and create tailored interventions for patients who are at higher risk of developing a SSI.9-11 Widely used preoperative screening methods such as the Revised Cardiac Risk Index (RCRI) assessment tool and the ACS National Surgical Quality Improvement Program (NSQIP) risk calculator have played a crucial role in optimizing patients for surgery12-15
While artificial intelligence (AI) has gained momentum in healthcare, its application in surgical risk prediction, particularly through the integration of large-scale clinical literature, remains relatively underexplored. Generative AI, such as GPT-4 (OpenAI, San Francisco, CA), potentially offers a novel capability: the rapid synthesis of heterogeneous sources of clinical evidence. This approach enables the development of models that are both literature-informed and scalable, offering a promising complement to traditional methodologies that rely heavily on manual data curation or expert consensus.
AI implementation in spine surgery has largely focused on imaging diagnostics, robotics, or postoperative outcome prediction using structured datasets.16-22 Few effective risk calculators exist for spine surgery. SpineSage, developed in 2014, is one of the only tools available that provides preoperative risk assessments for patients undergoing spine surgery. 23 This study aims to expand the conceptual framework provided by previous SSI risk calculators by creating and validating a weighted, point-based infection risk calculator constructed with the assistance of generative AI. We hypothesize that generative AI will identify meaningful patient comorbidities and operative characteristics that can effectively stratify SSI risk. This new model represents a modern and effective method for determining infection risk in spine surgery patients.
Materials and Methods
Study Design and Population
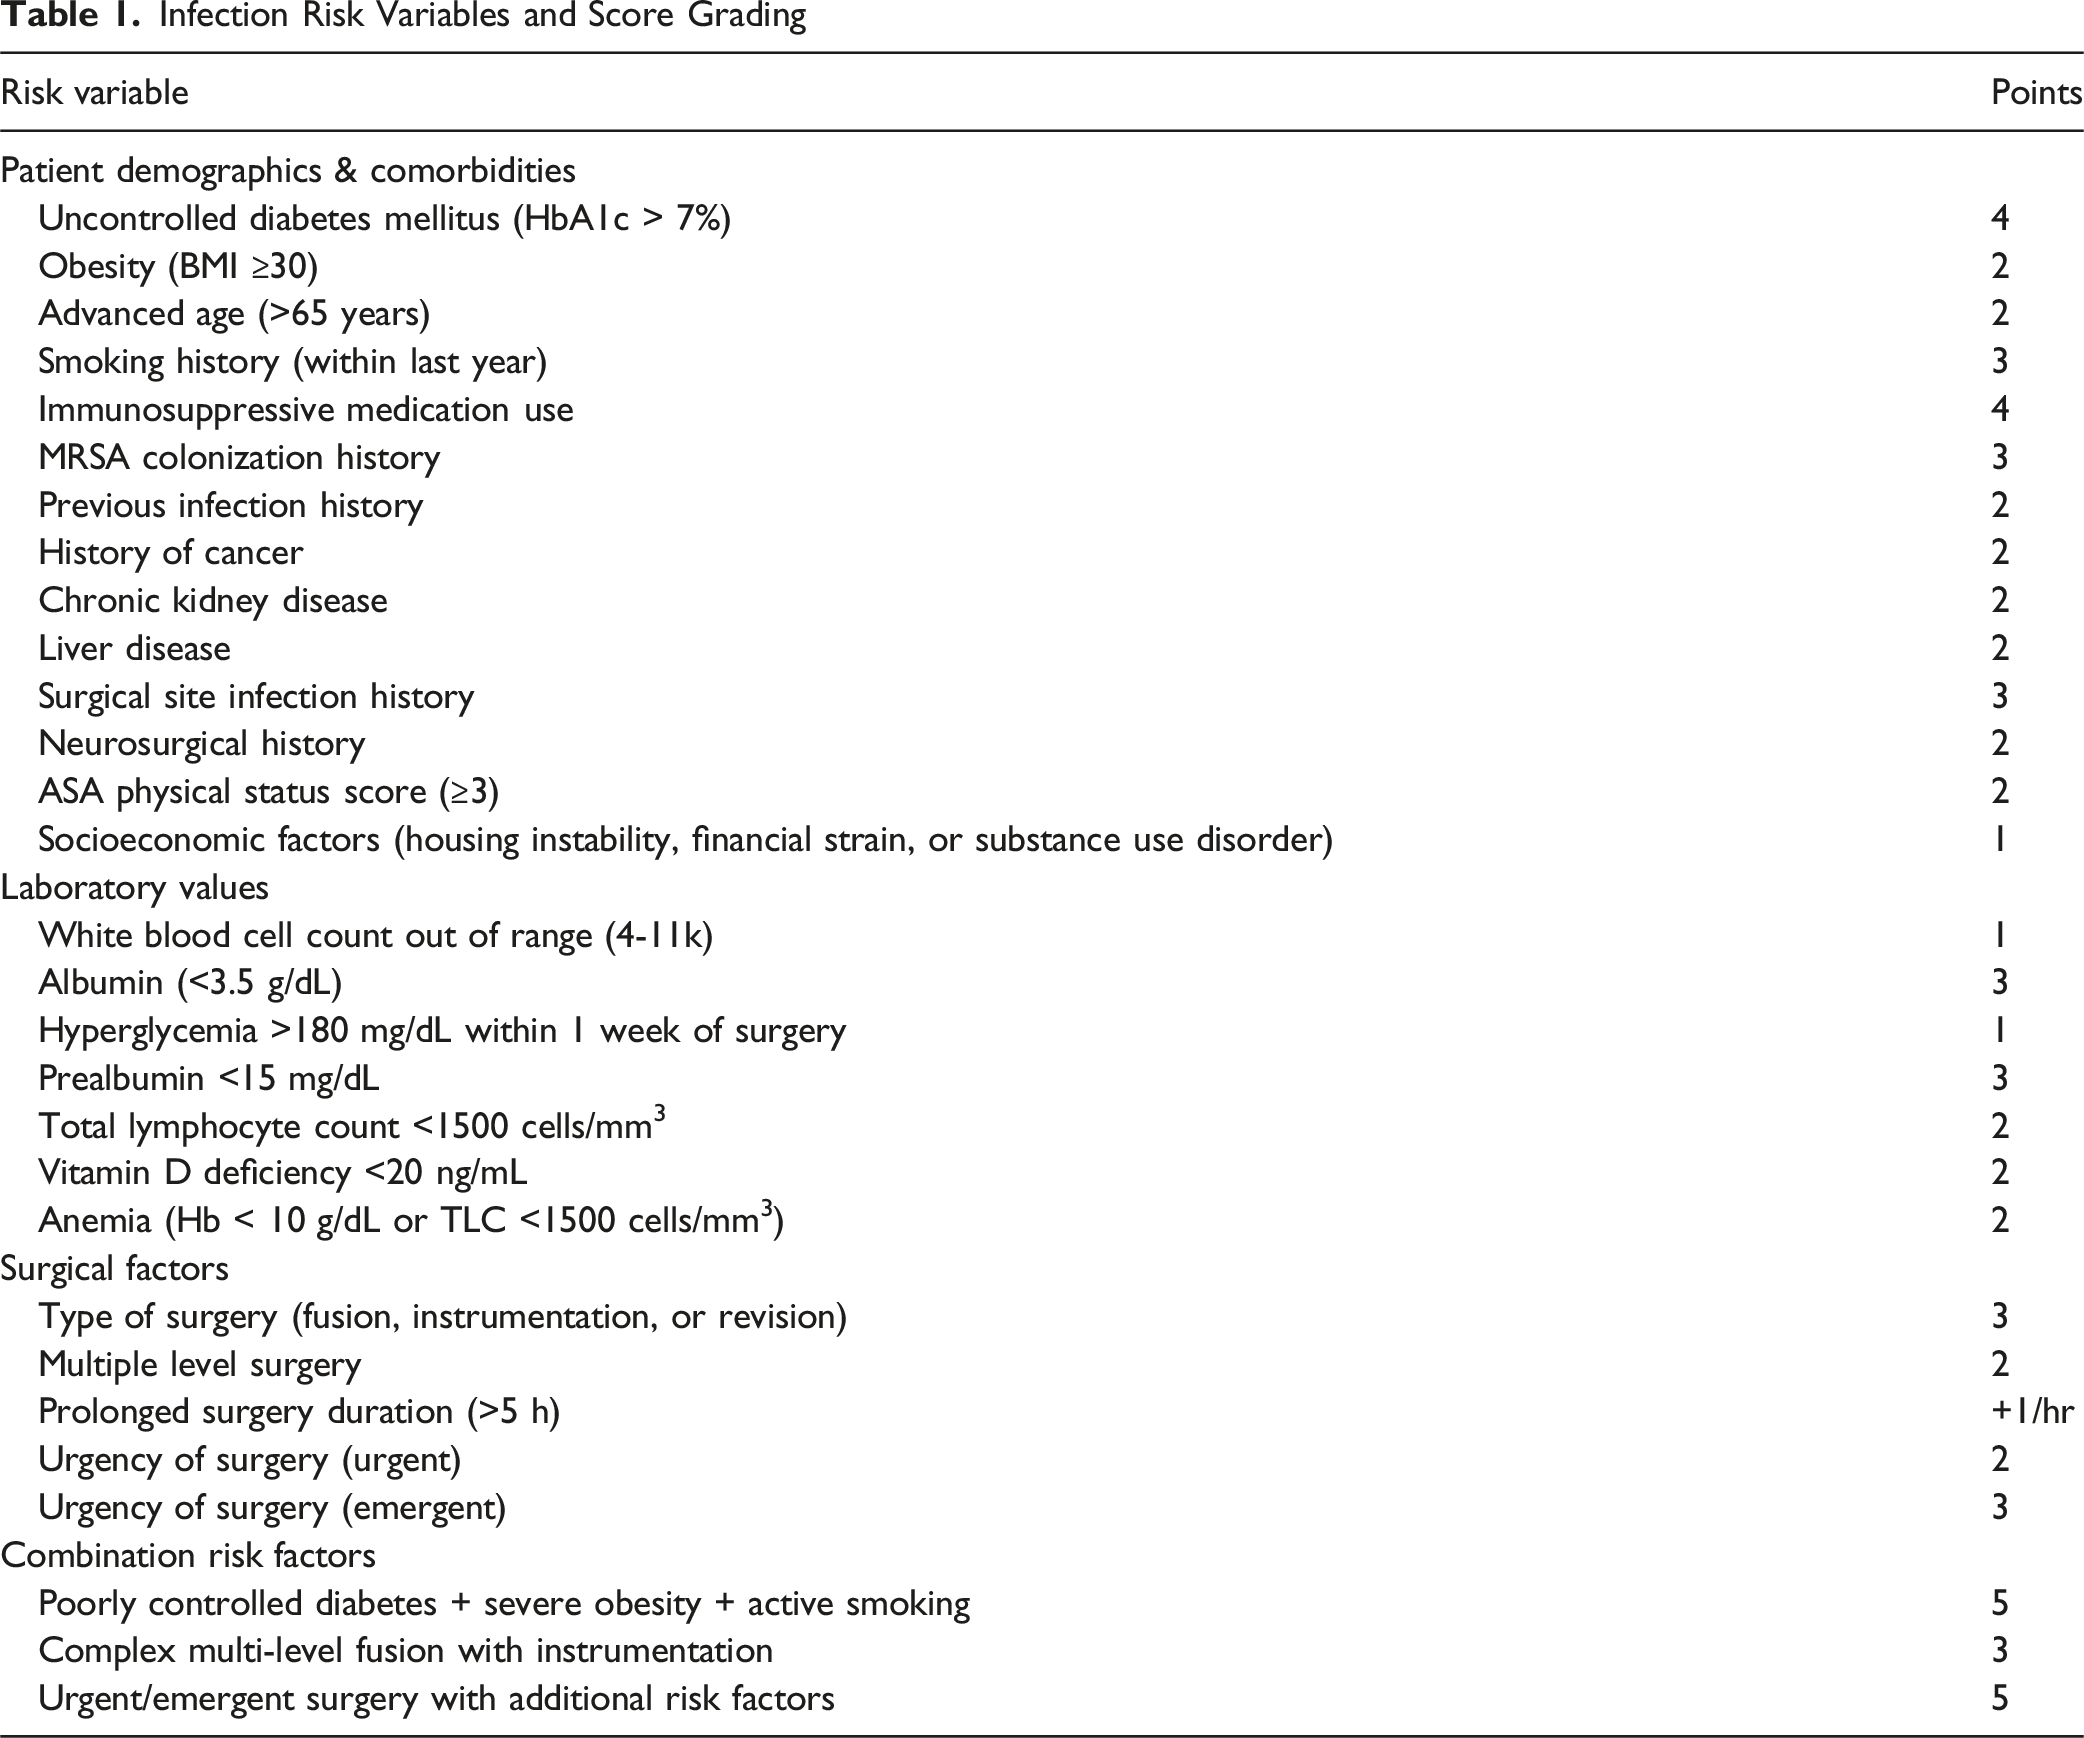
Infection Risk Variables and Score Grading
Inclusion and Exclusion Criteria
Adult patients ≥18 years old were included if they had received spine surgery for degenerative spine disease or deformity correction, had complete demographic data for all risk factors, and had at least 30 days of post operative follow-up for SSI assessment. Patients were excluded if they developed an infection unrelated to their spine surgery.
Missing Data, Laboratory Timing, and Censoring
A complete-case approach was used for all analyses. Variables that were clinically unobtainable, not documented in the electronic record, or collected outside the defined pre-operative window were coded as missing and excluded from regression-based analyses. No imputation methods were applied. Laboratory values (albumin, prealbumin, HbA1c, white blood cell count, lymphocyte count, hemoglobin, serum glucose, vitamin D) were abstracted if obtained within 30 days prior to surgery, which reflects standard institutional optimization practices. Postoperative SSI surveillance followed CDC/NHSN criteria. Patients were followed and censored at 90 days post-operatively, corresponding to CDC definitions for deep incisional and organ/space surgical site infections in procedures involving implanted hardware. 25
AI Generated Risk Calculator
A comprehensive risk calculator was developed using AI assistance with GPT-4 (OpenAI, San Francisco, CA) to identify and weight risk factors for SSI. The calculator was developed through AI-assisted literature synthesis. GPT-4 functioned as a knowledge-engineering tool used to extract and summarize evidence-based risk factors for postoperative infection from peer-reviewed spine-surgery literature. GPT-4 aided in organizing and weighting clinical variables according to the strength and consistency of published associations. All outputs were reviewed and adjudicated by the study authors to ensure clinical plausibility and alignment with existing evidence. The exact GPT-4 prompts and their intended functions are detailed in Supplemental Table 2, which provides a transparent record of the AI-assisted literature synthesis process consistent with TRIPOD-AI guidance. GPT-4 was not exposed to any patient-level data during this process and was used exclusively for structured synthesis of published literature. No machine-learning model was trained on clinical data; rather, GPT-4 functioned as a knowledge-engineering tool to assist variable selection and point-weight derivation.
AI-Assisted Variable Derivation
Prompts directed the model to: (1) extract risk factors consistently supported across peer-reviewed studies; (2) summarize typical effect sizes or qualitative evidence strength; and (3) propose fixed integer point weights reflecting the magnitude and consistency of each factor’s reported association with infection. All outputs were independently reviewed by two study authors (D.C. and A.K.) with experience in spine surgery and infection research. Discrepancies in inclusion or weighting were resolved by consensus with senior author review. Final weights were determined through this adjudicated process, ensuring clinical plausibility and interpretability, as detailed above. A representative summary of GPT-4 prompts, exemplar citations, and the full rationale for each variable’s assigned point value is provided in (Supplemental Table 1). This approach follows TRIPOD-AI recommendations for transparent reporting of AI-assisted knowledge-engineering steps. 26
Composite Risk Variables
Composite risk variables (eg, poorly controlled diabetes with severe obesity and active smoking; complex multilevel fusion with instrumentation; urgent or emergent surgery with additional risk factors) were included to represent clinically recognizable synergistic constellations described across the SSI literature. These composite variables were conceptualized as heuristic, face-valid groupings rather than statistically modeled interaction terms. They were incorporated to preserve interpretability and clinical usability within a point-based framework and were not entered as independent predictors in any regression-based analyses. Each component risk factor within these composites has been individually associated with increased SSI risk in prior literature, as summarized in Supplemental Table 1.
Infection Risk Variables and Score Grading
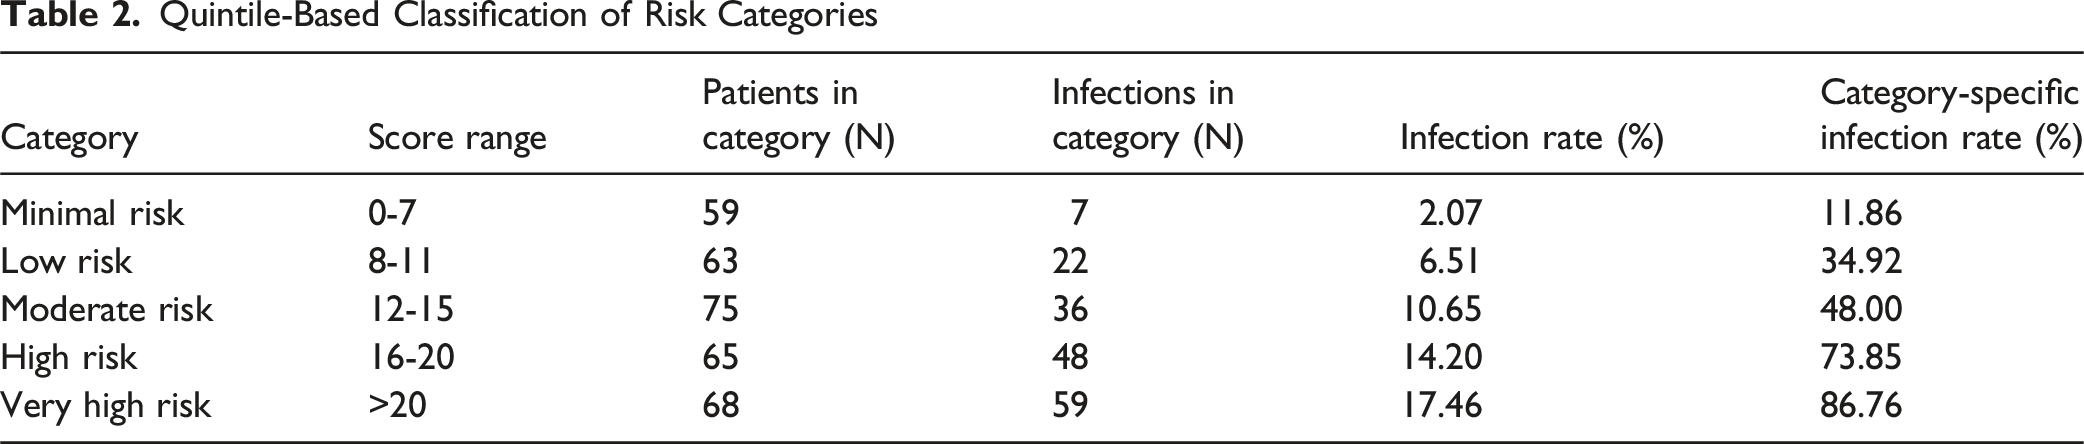
The calculator incorporates 29 distinct risk factors across four domains: patient demographics, comorbidities, laboratory values, and surgical factors. The total risk score ranges from 0 to 75, with higher scores indicating increased infection risk. Initial risk categories were established using GPT-4 to guide clinical decision-making: Minimal Risk (0-5 points); Low Risk (6-10 points); Moderate Risk (11-15 points); High Risk (16-20 points); and Very High Risk (>20 points). GPT-4-derived categories were then compared using a quintile-based classification of the risk score distribution.
Statistical Analysis
Descriptive statistics were calculated for continuous variables using median and interquartile range (IQR) due to non-normal distribution, as confirmed by Shapiro-Wilk tests. Categorical variables were presented as frequencies and percentages. The Mann-Whitney U test was used to compare risk scores between infected and non-infected patients due to non-normal data distribution. Effect size was calculated using Cohen’s d, with values >0.8 considered large effects. Descriptive analyses were also performed for operative regions (cervical or thoracolumbar) and surgery types (decompression, fusion, revision, or muscle flap) stratified by infection status. Chi-square tests or Fisher’s exact tests were used to compare categorical variables between subgroups.
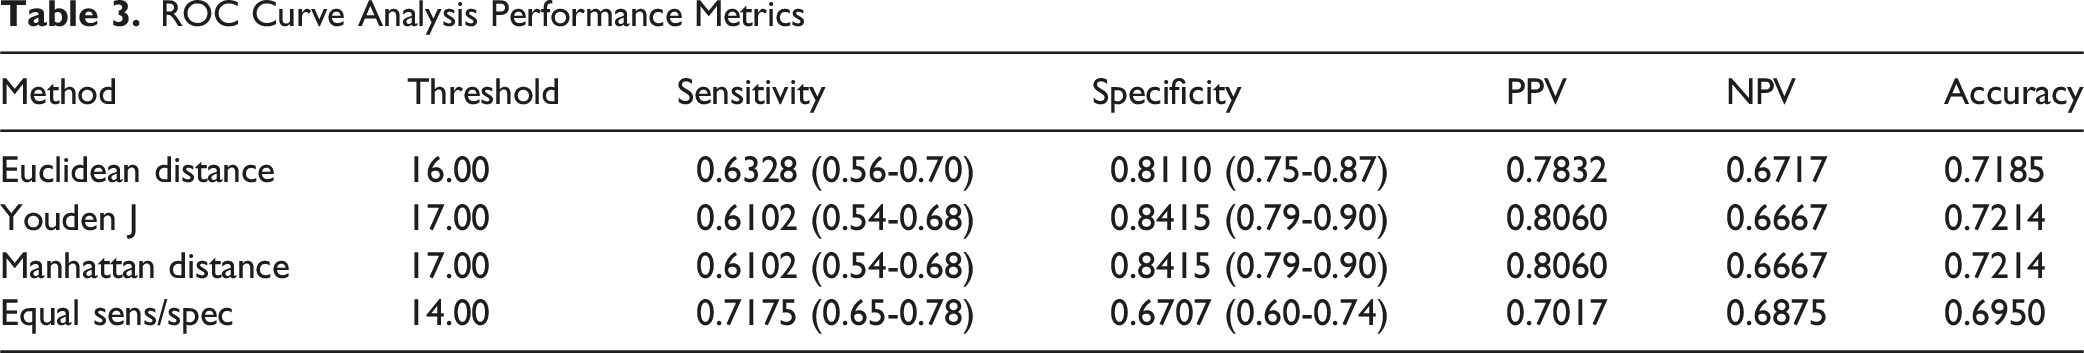
Receiver operating characteristic (ROC) curve analysis was performed to determine optimal cutoff thresholds for clinical decision-making. Four distinct methodological approaches were employed: (1) Euclidean distance calculation to identify the point closest to perfect classification (0,1), (2) Youden’s J statistic to maximize sensitivity plus specificity minus one, (3) Manhattan distance calculations as an alternative distance metric, and (4) identification of the threshold where sensitivity and specificity were approximately equal.
The discriminative ability of the risk calculator was assessed using the area under the receiver operating characteristic curve (AUC), with values ranging from 0.5 (no discrimination) to 1.0 (perfect discrimination), where AUC ≥0.7 indicates acceptable discrimination, ≥0.8 indicates excellent discrimination, and ≥0.9 indicates outstanding discrimination. Performance metrics including sensitivity, specificity, positive predictive value (PPV), negative predictive value (NPV), and overall accuracy were calculated for each threshold. Confidence intervals (CIs) for all performance metrics were calculated to quantify uncertainty. The AUC CI was estimated using bootstrap resampling. Bootstrap optimism correction was performed using 1000 iterations to estimate and correct for over-optimism in model performance metrics. Optimism was calculated as the difference between apparent and test performance, and corrected performance metrics were obtained by subtracting the average optimism from the original metrics. The final recommended threshold was selected based on the method yielding the highest overall accuracy and optimizes the trade-off between sensitivity and specificity for infection prediction. Given the study prevalence of SSI is artificially balanced and does not reflect real-word prevalence, PPV and NPV were adjusted for different prevalence levels using Bayes’ theorem.
Model calibration was assessed using multiple metrics: (1) calibration-in-the-large, calculated as the difference between mean predicted probability and observed prevalence, (2) calibration slope, representing the relationship between predicted and observed probabilities, and (3) Brier score, a measure of overall prediction accuracy ranging from 0 (perfect) to 1 (worst). A logistic regression model was fitted to convert risk scores to predicted probabilities, and calibration curves were generated to visualize the relationship between predicted and observed probabilities. Decision curve analysis (DCA) was also performed to evaluate the clinical utility of the risk calculator across different threshold probabilities and real-world SSI prevalence.
To address potential procedure heterogeneity, model performance was evaluated across subgroups defined by procedure type and operative region. Subgroups with fewer than 5 patients were excluded from stratified analysis.
Infection rates were calculated for each predefined risk category using the total cohort as the denominator. Risk ratios and odds ratios were calculated comparing patients above vs below the optimal threshold, with statistical significance assessed using chi-square tests. The number needed to harm (NNH) was calculated to quantify the clinical impact of elevated risk scores. All statistical analyses were performed using Python 3.12.7 with scikit-learn, SciPy, pandas, and NumPy libraries. A two-sided alpha level of 0.05 was used to determine statistical significance. Reporting followed TRIPOD-AI recommendations for transparent reporting of AI-assisted model development, and a PROBAST risk-of-bias summary is provided in Supplemental Table 3.
Results
Descriptive Analysis
Of the total 338 patients included in the study, 177 (52.3%) were in the SSI cohort while 161 (47.6%) were in the control cohort. Of these, 48.8% were female (SSI: 51.4%, control 45.9%). Additionally, 41.3% of patients were ≥65 years old (SSI: 44.1%, control: 46.0%), and 66.8% of patients received either fusion, instrumentation, or revision surgeries (SSI: 75.7%, control: 57.3%). Cervical procedures comprised 23.7% of the cohort (SSI: 22.6%, control: 24.8%), while thoracolumbar procedures comprised 75.4% (SSI: 79.1%, control: 71.4%). Decompression procedures were performed in 76.0% of patients (SSI: 59.9%, control: 93.8%, P < .001), fusion in 63.6% (SSI: 66.7%, control: 60.2%), revision in 19.8% (SSI: 19.8%, control: 19.9%), and muscle flap procedures in 6.5% (SSI: 7.3%, control: 5.6%).
Quintile-Based Classification of Risk Categories
ROC Curve Analysis and Optimal Threshold
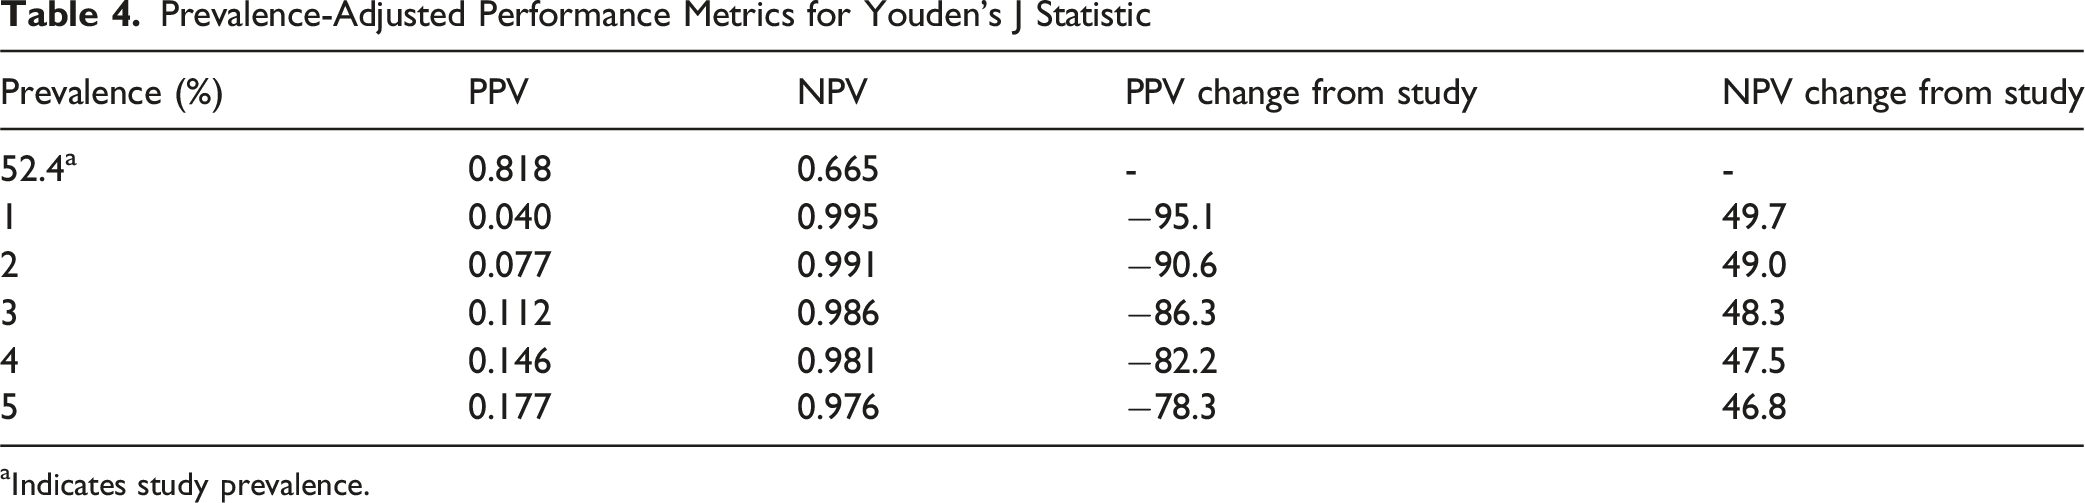
ROC curve analysis demonstrated strong discriminative ability with an AUC of 0.7978 (95% CI: 0.7521-9.8427). Optimization methods identified optimal thresholds ranging from 14 to 17 points. The Youden’s J statistic performed the best, identifying 17 points as the optimal threshold and achieving 61.0% sensitivity, 84.2% specificity, and 72.1% accuracy (Figure 1, Table 3). Bootstrap optimism correction revealed minimal optimism in model performance. The optimism-corrected AUC was 0.7968 (correction: −0.001), indicating excellent model stability. Optimism-corrected sensitivity was 0.6003 (correction: −0.0098) and specificity was 0.8375 (correction: −0.0134). At the study prevalence of 52.3% SSI, the optimal threshold achieved a PPV of 0.8106 and NPV of 0.6540. When adjusted to real-world prevalence levels, PPV decreased substantially while NPV remained high (Table 4). ROC curve analysis determining optimal threshold ROC Curve Analysis Performance Metrics Prevalence-Adjusted Performance Metrics for Youden’s J Statistic aIndicates study prevalence.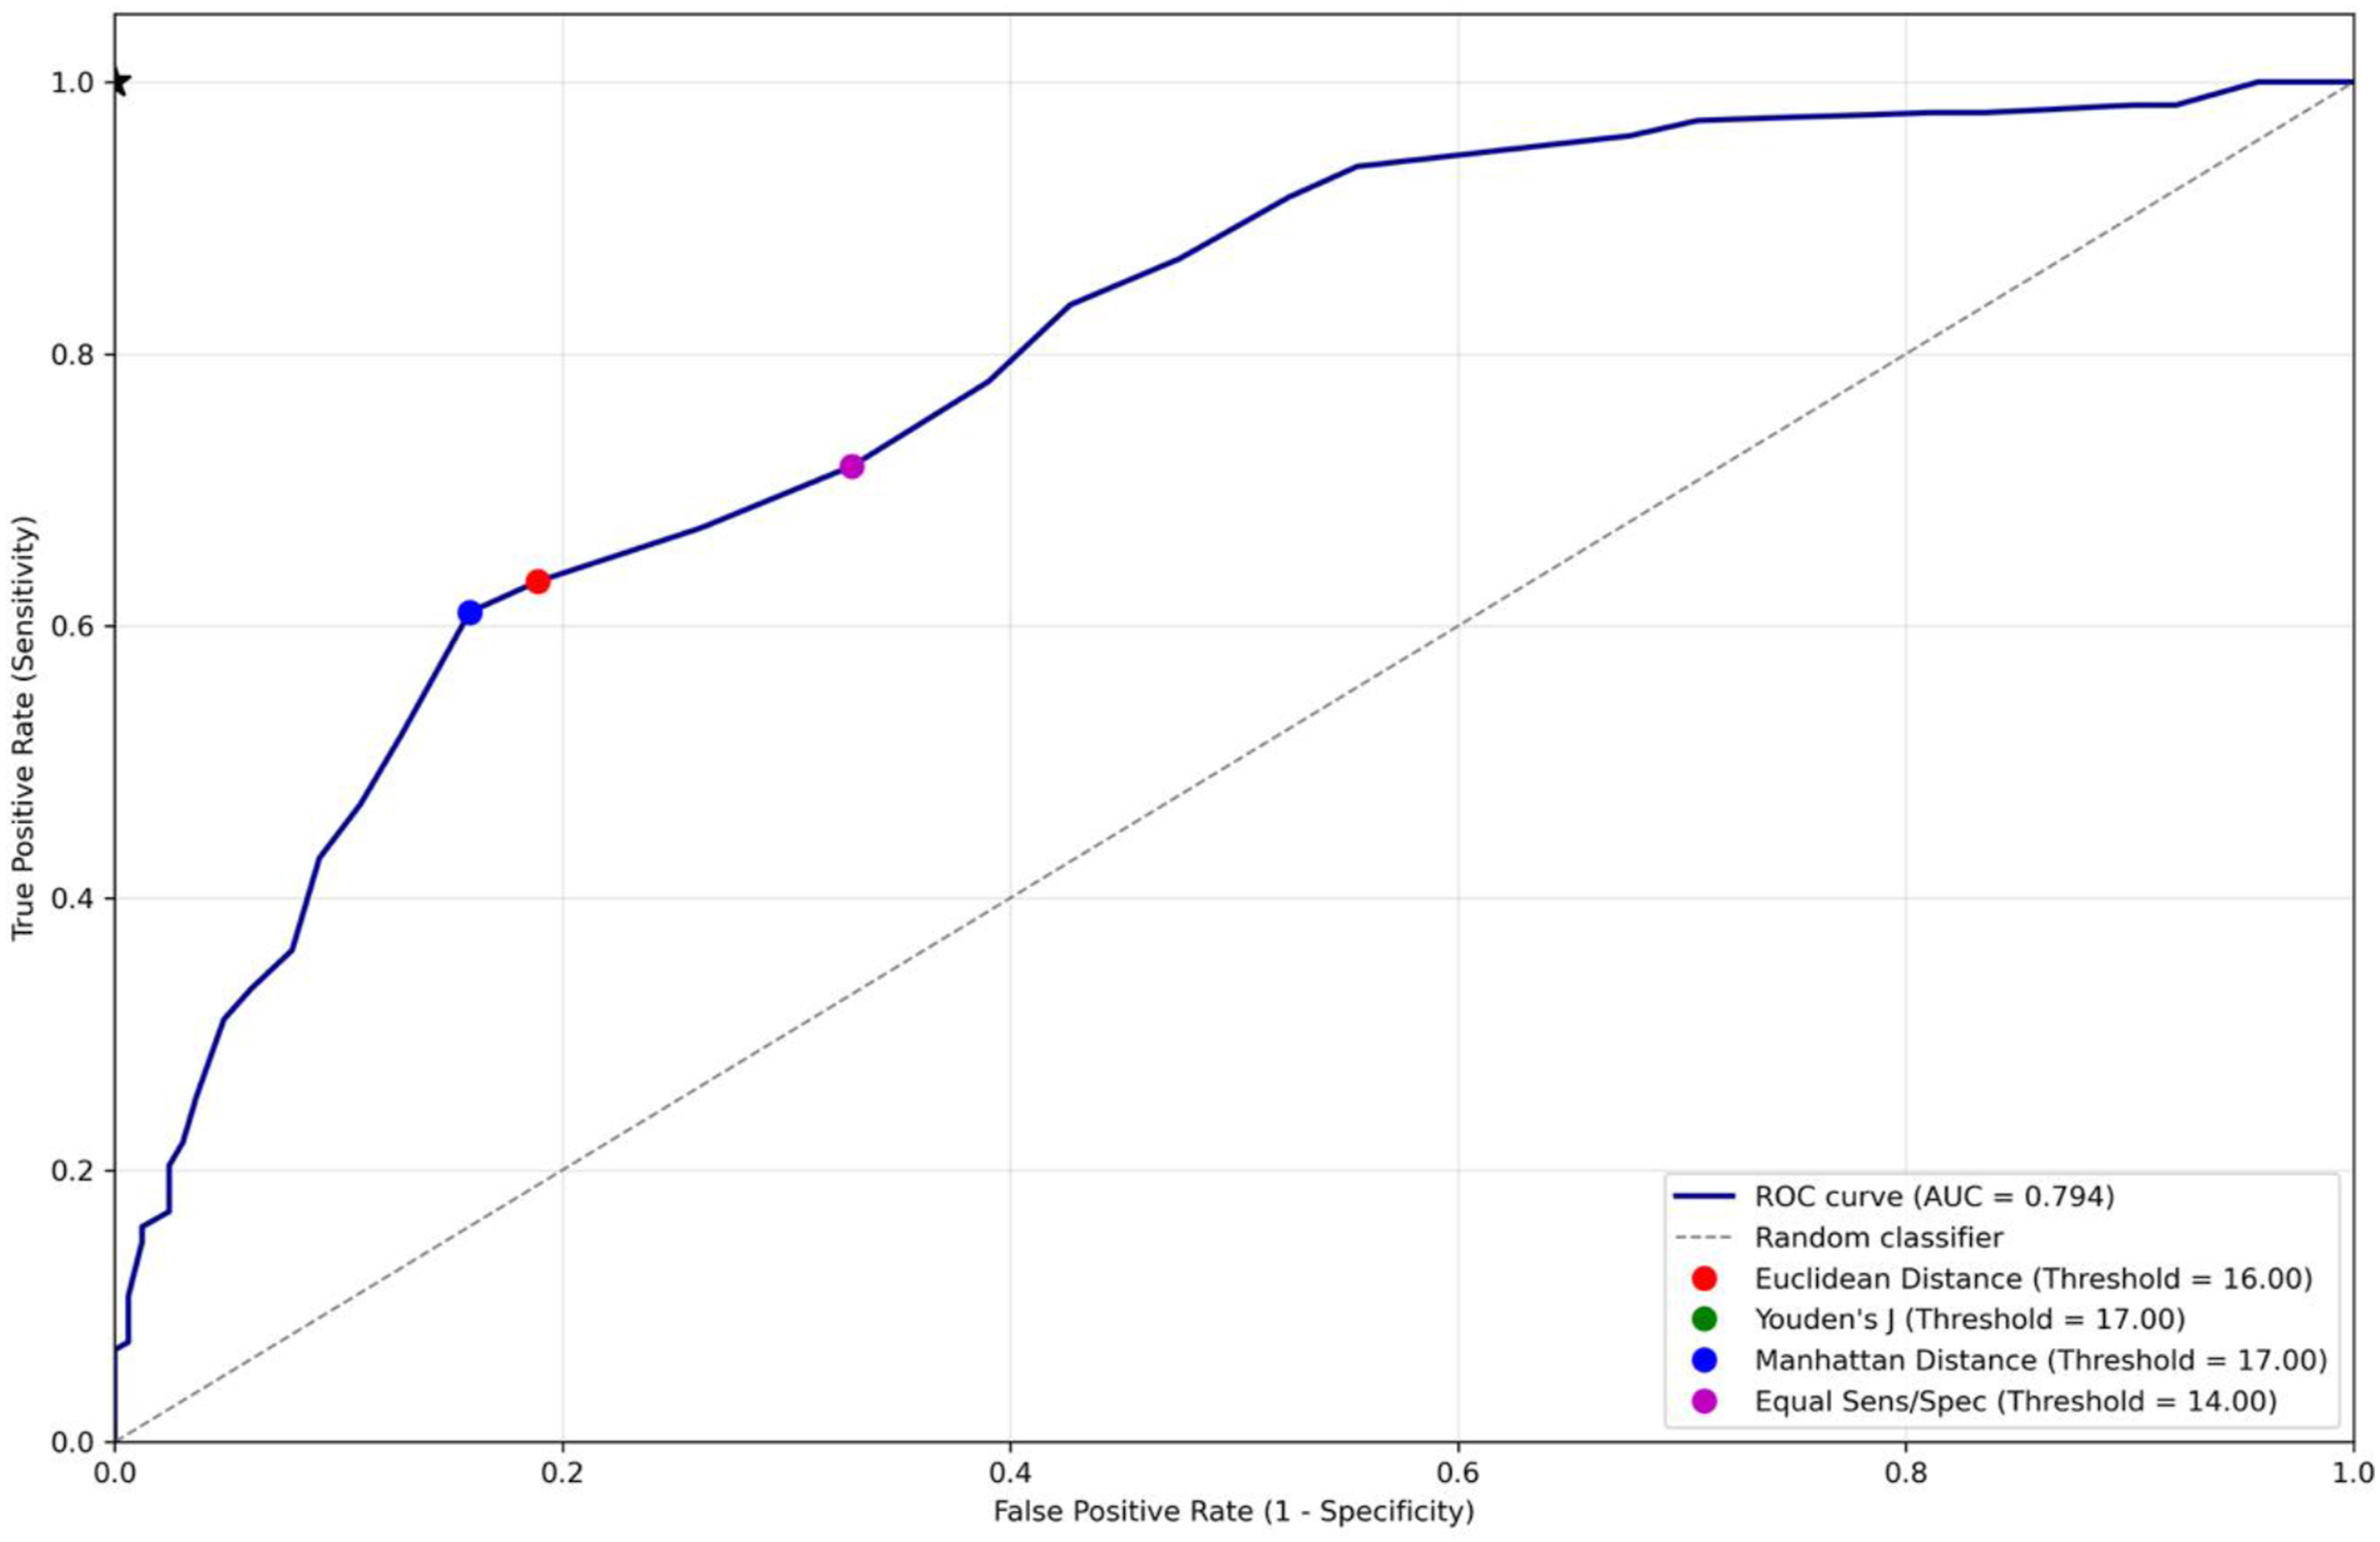
Calibration analysis revealed good model calibration. The mean predicted probability was 52.36%, closely matching the observed prevalence of 52.37%, resulting in calibration-in-the-large <0.001 (ideal: 0). The calibration slope was 1.045 (ideal: 1.0), indicating appropriate calibration. The Brier score was 0.1833, suggesting good overall prediction accuracy. The calibration curve demonstrated close alignment from idea calibration line (Figure 2A and B). DCA demonstrated that the risk calculator provides net benefit over “treat all” and “treat none” strategies across a range of threshold probabilities from 0.00% to 52.37%. The optimal threshold probability was 1.00%, with a maximum benefit of 0.5189 (Figure 2C). Prevalence-adjusted DCA demonstrated that the risk calculator provides meaningful net benefit across real-world SSI prevalence levels (1-4%). At 1% prevalence, the score ≥17 threshold achieved optimal net benefit (0.3305), equivalent to the maximum achievable. At higher prevalence levels (2-4%), the score ≥17 threshold remained clinically useful (net benefit 0.27-0.32) though not optimal, suggesting that lower thresholds may provide additional benefit in higher-prevalence settings (Supplemental Figure 1). (A, B) Calibration curve analysis displaying (A) calibration plot, and (B) distribution of predicted probabilities, and (C) decision curve analysis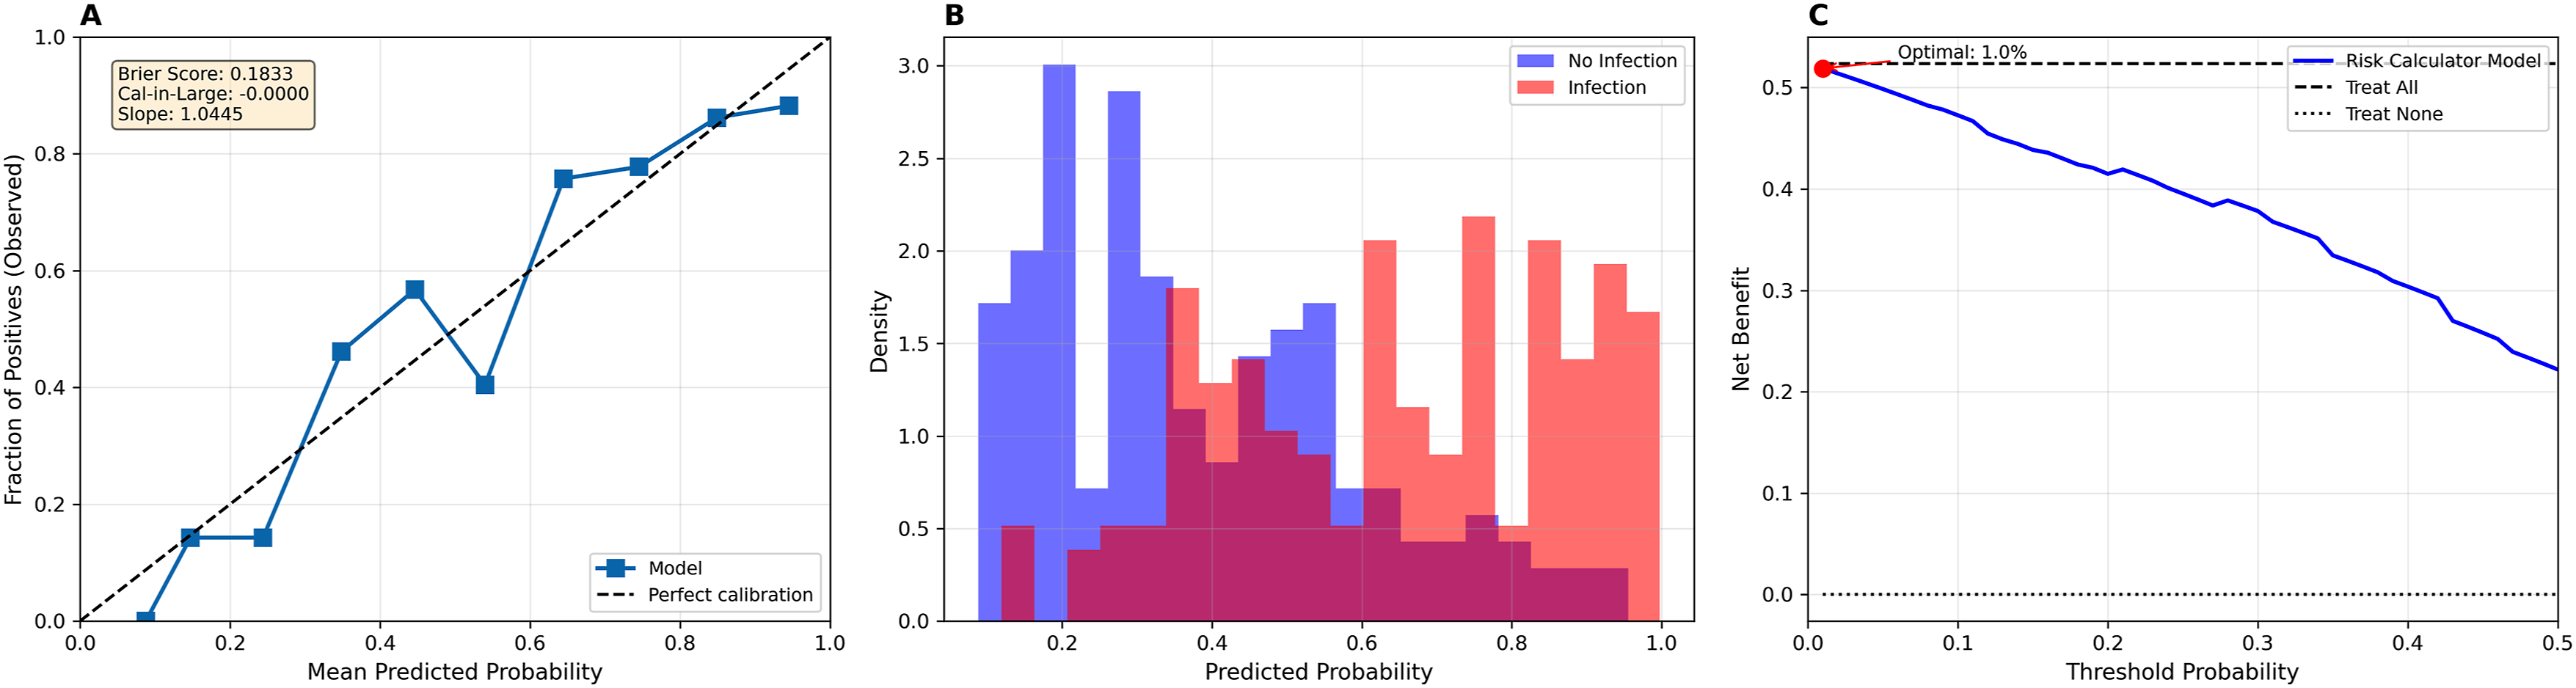
Patients with risk scores ≥17 points demonstrated significantly elevated infection risk compared to those below this threshold. The risk ratio was 2.42 (95% CI: 1.96-2.98), indicating that patients above this threshold had 2.4 times higher infection risk. The odds ratio was 8.31 (95% CI: 4.96-13.93), and the absolute risk difference was 47.3 percentage points. The NNH was 2.1 (95% CI: 1.7 - 2.6), indicating that for every 2.1 patients with scores ≥17, one additional infection occurred. This association was statistically significant (χ2 test, P < .001).
Stratified Analysis by Procedure Type and Region
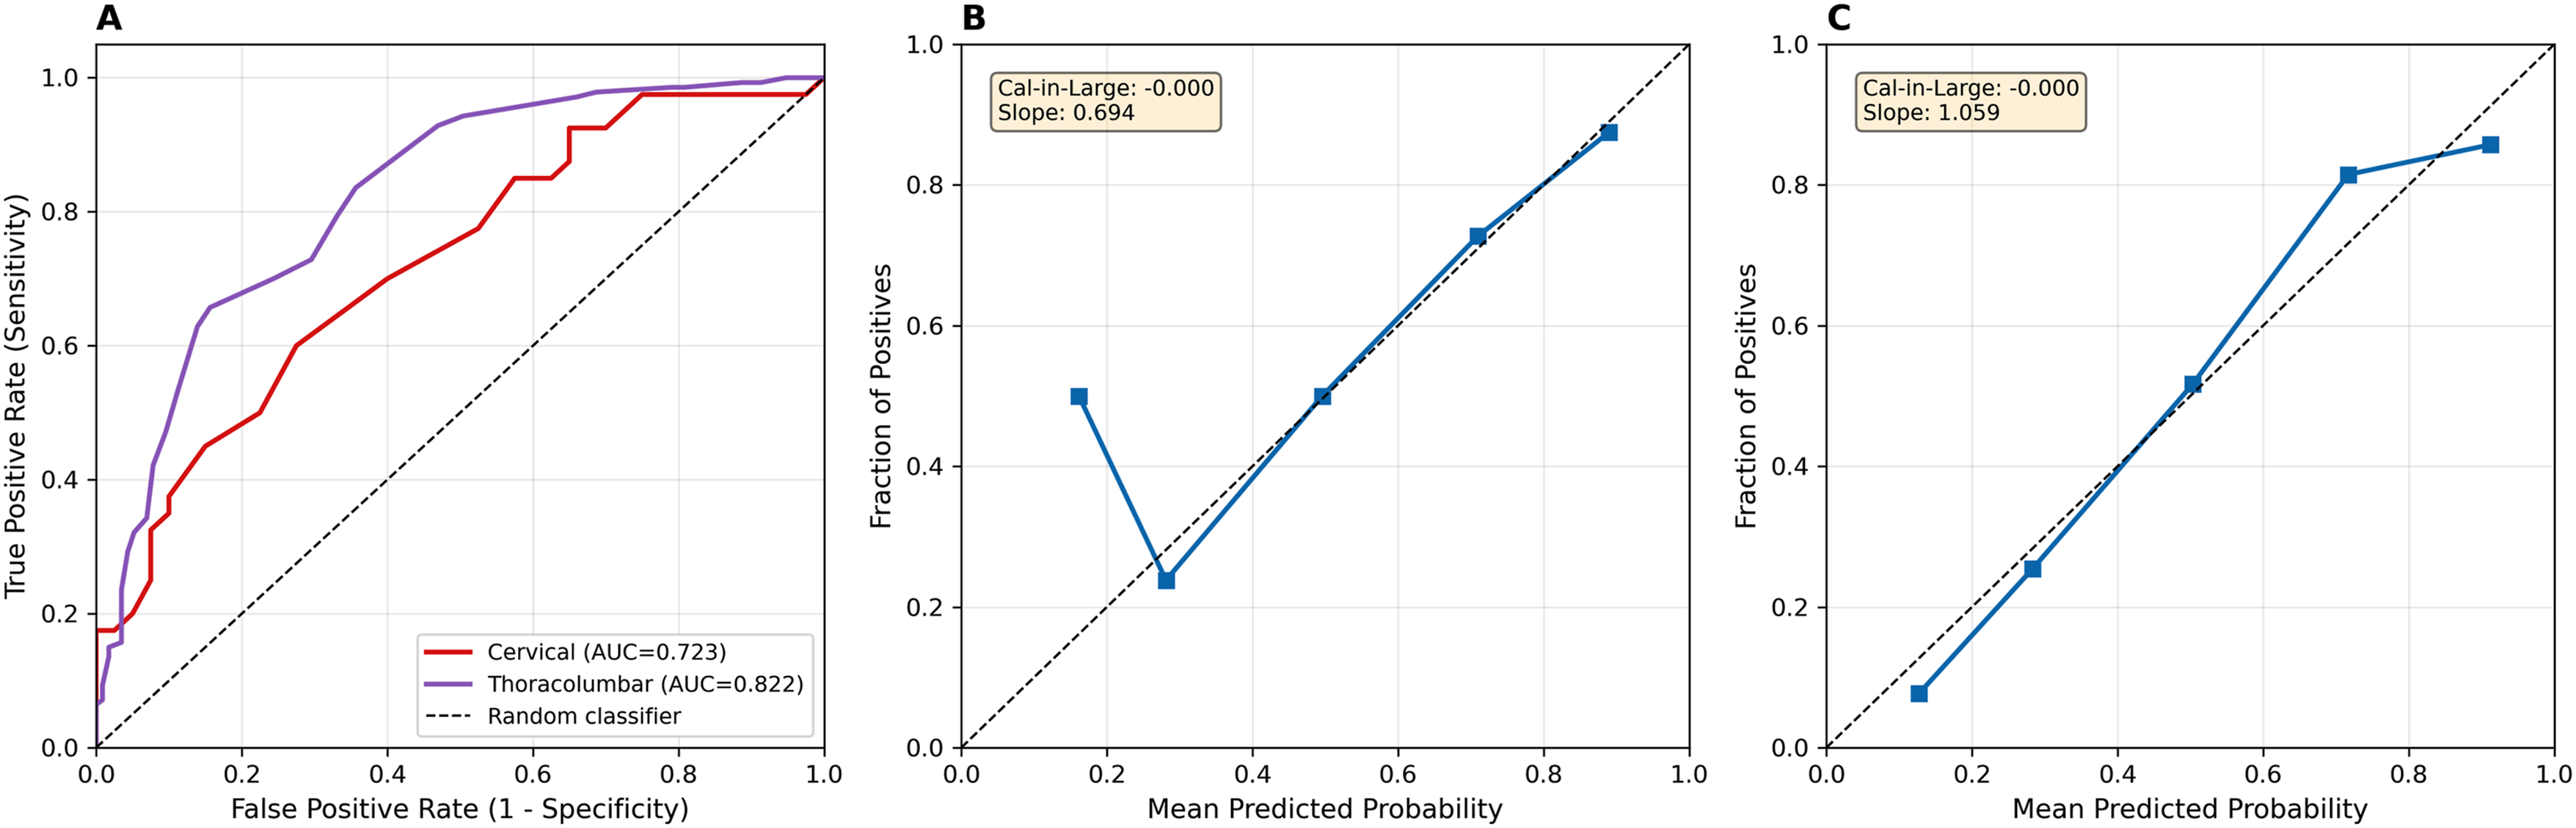
Stratified analysis revealed consistent model performance across different procedure types and operative regions. For decompression-only procedures, the AUC was 0.796, achieving a sensitivity of 55.7% and specificity of 86.8%. For fusion procedures, the AUC was 0.796 with a sensitivity of 68.6% and specificity of 80.4%. Cervical procedures demonstrated an AUC of 0.723, while thoracolumbar procedures had an AUC of 0.822 (Figures 3 and 4). Stratified analysis according to procedure type. (A) ROC curves by procedure type, (B-D) calibration plots for (B) decompression only, (C) fusion only, and (D) revision only Stratified analysis according to procedure location. (A) ROC curves by procedure location, (B, C) calibration plots for (B) cervical, and (C) thoracolumbar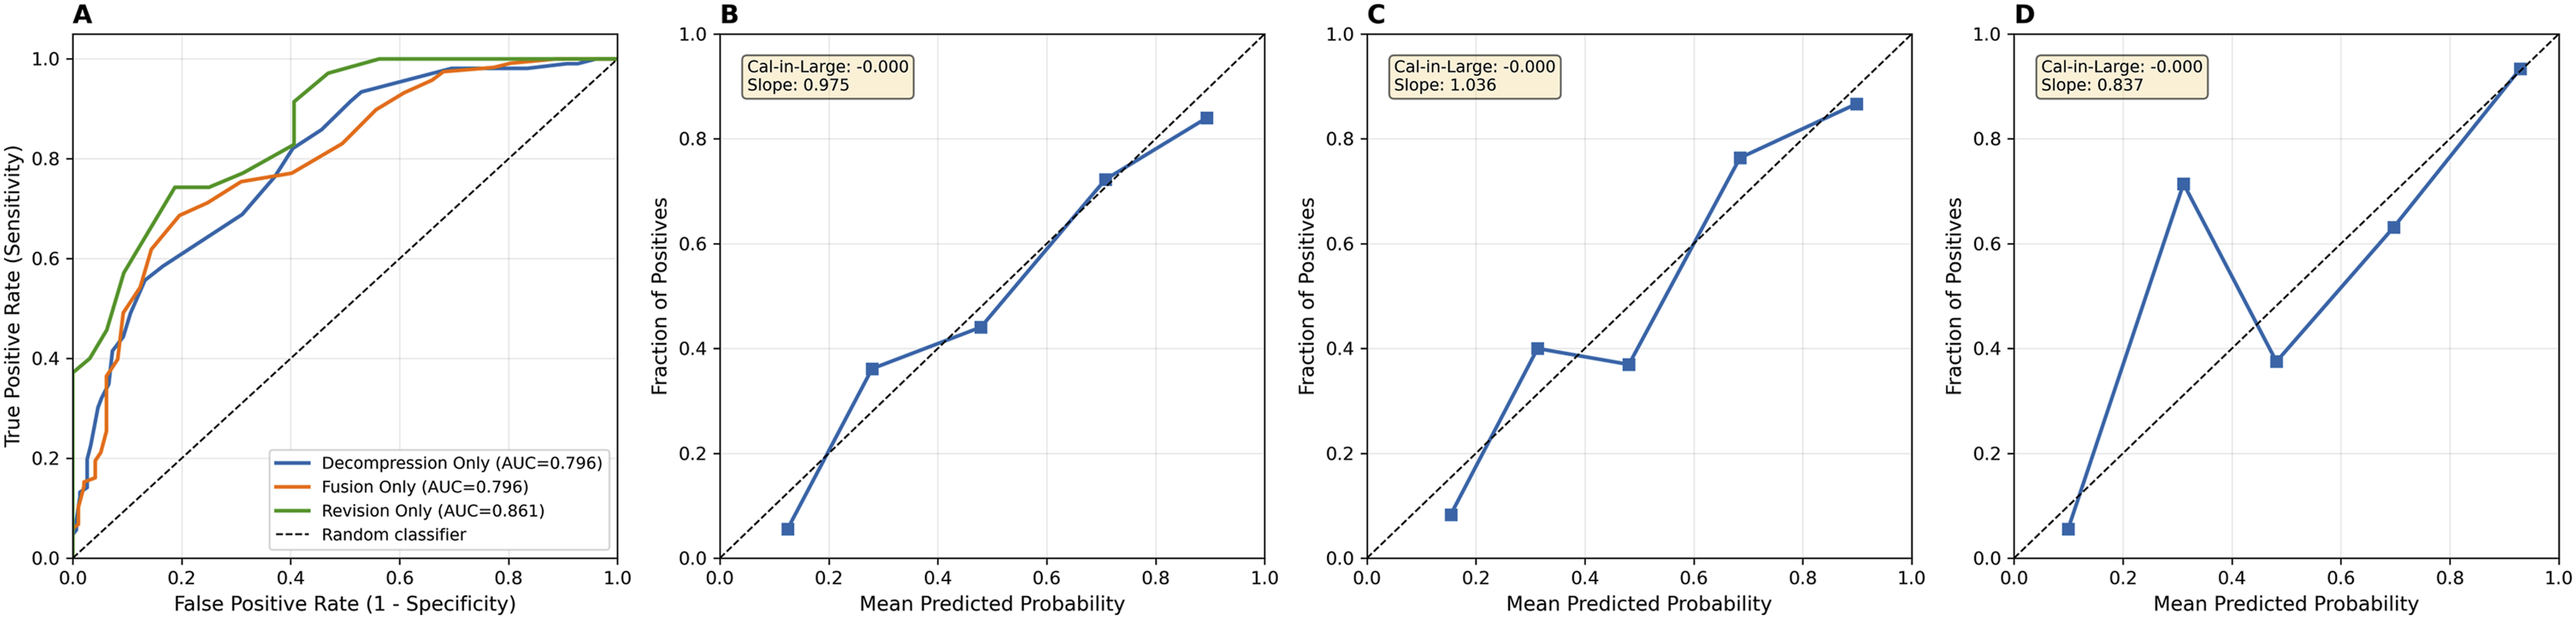
Discussion
This study introduces a novel, AI-assisted infection risk calculator developed to stratify patients undergoing spine surgery. Postoperative SSI can have severe consequences yet remains difficult to predict with existing tools. SpineSage, though a valuable predecessor, has not seen widespread adoption and lacks updates that incorporate recent literature or broader comorbidity profiles. 23 By synthesizing a diverse array of clinical risk factors with the assistance of generative AI, this study sought to modernize infection risk prediction through a transparent, interpretable scoring system. An optimal threshold of 17 points was identified through Youden’s J statistic, yielding balanced performance metrics in internal validation, including over 72% overall accuracy. Furthermore, the developed risk calculator demonstrated statistically significant discriminative ability between infected and non-infected patients.
While definitive comparisons require external validation, the present study’s internally validated calculator performed equally if not better in ROC analysis compared to existing risk-calculating tools. For reference, the RCRI, a widely used tool for estimating cardiac complication risk after surgery, has a reported ROC analysis AUC of 0.77, while SpineSage has an ROC analysis AUC of 0.72.23,27,28 These findings support the tool’s potential to enhance preoperative counseling, inform postoperative surveillance, guide antimicrobial stewardship, and contribute to broader infection mitigation strategies. The implications of this study are far reaching and may extend beyond patient care. Surgeons and hospitals increasingly operate within environments where postoperative infection rates influence quality-reporting and institutional benchmarking. In this context, a point-based system may support quality-improvement and reporting efforts by providing a transparent framework for identifying patients with elevated baseline risk, although any specific financial or policy implications remain uncertain and require further study. If risk stratification were to be incorporated into institutional quality initiatives, the relative impact could vary when comparing a patient with a “very high risk” score of 25 vs a “minimal risk” score of 2, for example.29-31
Another future implication of this study lies in its utilization of AI. Through GPT-4, vast amounts of heterogeneous spine surgery literature were synthesized to create the variables and point-values used in this infection risk calculator. This use of AI offers a novel, more efficient way of sorting through literature and may be used in future studies to rapidly generate evidence-based clinical tools, automate risk stratification across other surgical domains, and support precision medicine initiatives in spine care.
This study has several strengths including the creation of a robust infection risk assessment calculator that includes 29 weighted variables. A thorough statistical evaluation of this calculator was utilized to evaluate its efficacy and accuracy in predicting post operative SSI. Additionally, the 341 included patients are larger than prior studies evaluating infection risk in patients undergoing spine surgery.5,23 To enhance reproducibility and transparency, a detailed documentation of the GPT-4 prompting framework and human expert adjudication process has been included (Supplemental Table 1), outlining representative prompts, citations, and the rationale for each variable’s inclusion and assigned weight.
This study is not without limitations that may impact the application of this infection risk calculator into the clinical setting. One limitation lies in the interpretability of the AI-assisted design process. While GPT-4 was instrumental in synthesizing literature and generating proposed risk factors and point assignments, its outputs are not accompanied by an explicit or traceable rationale. As a result, it is challenging to retrospectively assess the model’s internal logic for selecting and weighting specific variables. Although the final scoring system demonstrated statistically significant discrimination between infected and non-infected patients, further work is needed to validate the clinical justification and reproducibility of these assignments. Another limitation of this study involves the heterogeneity of procedures and surgical approaches that were included in the cohorts, especially since procedures such as ACDF are known to have particularly low infection rates. 4 Notably, only 6.2% of SSI patients in this study underwent ACDF procedure. Future iterations of this calculator should include more granular details regarding specific surgical approaches to apply infection risk more accurately.
A third limitation applies to the creation of score ranges for the five infection risk categories, which were also derived using AI support. Future studies may benefit from combining AI-generated frameworks with traditional expert consensus or data-driven optimization to enhance both transparency and clinical trust. The accuracy of this predictive model would also be improved with a larger sample size as a patient population of 341 may limit the power of this study. Furthermore, statistical validation of this study was done internally, and external validation would be needed to further confirm efficacy of this risk calculator. Several continuous predictors were dichotomized to improve interpretability and allow manual bedside scoring. While this approach enhances usability, it inevitably reduces information and may reduce calibration around clinically relevant thresholds. Future analyses performed during the external validation phase will examine continuous functional relationships, explore data-driven threshold selection, and evaluate whether nonlinear modeling improves performance prior to reconciling these results with a simplified point-based calculator.
The calculator also incorporates several composite risk clusters that were designed to reflect commonly observed clinical constellations rather than empirically modeled interaction terms. While these groupings may enhance bedside interpretability and capture clinically intuitive combinations of metabolic, vascular, and perfusion-related factors, they also introduce the possibility of partial collinearity, double-counting across related predictors, and oversimplifying risk interactions. These composites should therefore be viewed as heuristic rather than definitive interaction effects. As part of the ongoing external validation phase, we aim to formally test statistical interactions and evaluate whether these clusters improve, have a neutral effect on, or detract from model calibration, and whether they should be retained, modified, or removed in future iterations. Additionally, since controls were randomly selected rather than propensity matched, some degree of residual confounding is possible. Lastly, because our case–control design yielded an artificially elevated SSI prevalence, predictive values should be interpreted using the prevalence-adjusted PPV and NPV already provided.
Ultimately, this study presents an internally validated spine infection risk calculator and predictive model constructed with the aid of generative AI. Retrospective application of this study’s infection risk calculator on our institution’s spine surgery patients yielded statistically significant differences between infected and control groups. Furthermore, an optimal risk-score threshold was determined, enabling the prediction of SSI with fair accuracy, specificity, and positive predictive value. Further research with larger patient populations must be done to test the efficacy of this calculator prospectively using a similar predictive model.
Supplemental Material
Supplemental Material - AI-Assisted, Literature-Informed Development and Retrospective Validation of a Point-Based Surgical Site Infection Risk Calculator for Spine Surgery
Supplemental Material for AI-Assisted, Literature-Informed Development and Retrospective Validation of a Point-Based Surgical Site Infection Risk Calculator for Spine Surgery by Amrit Khalsa, Julian Peregoff, Ryan W. Turlip, Justus Zemberi, Gustavo Capone, Michelle Kwon, Amanda Moser, Obinna Uzosike, Ziad Hassan, Nathaniel M. Cieplik, Tensae Assefa, Nnaemeka Okorie, and David Casper in Global Spine Journal
Footnotes
Consent for Publication
Informed consent was not required to gather the data to publish this paper.
Author Contributions
Amrit Khalsa: Supervision, calculator creation. Julian Peregoff: Writing, data collection, calculator creation. Ryan Turlip: Statistical analysis, writing. Justus Zemberi: Data collection. Gustavo Capone: Data collection. Michelle Kwon: Data collection. Obinna Uzosike: Data collection. Amanda Moser: Data collection. Ziad Hassan: Data collection. Nathaniel M. Cieplik: Data collection. Tensae Assefa: Manuscript review. Nnaemeka Okorie: Manuscript review. David Casper: Manuscript review, supervision.
Funding
The authors received no financial support for the research, authorship, and/or publication of this article.
Declaration of Conflicting Interests
The authors declared no potential conflicts of interest with respect to the research, authorship, and/or publication of this article.
Institutional Review Board Statement
This study was approved by the University of Pennsylvania Institutional Review Board 832364 on 08-04-2025.
Supplemental Material
Supplemental material for this article is available online.
References
Supplementary Material
Please find the following supplemental material available below.
For Open Access articles published under a Creative Commons License, all supplemental material carries the same license as the article it is associated with.
For non-Open Access articles published, all supplemental material carries a non-exclusive license, and permission requests for re-use of supplemental material or any part of supplemental material shall be sent directly to the copyright owner as specified in the copyright notice associated with the article.