
Abstract
Study Design
Retrospective Cohort.
Objectives
This study aims to evaluate the relations between facet joint degeneration (FD) and sagittal spinopelvic parameters. Second, the association of FD with degenerative disc disease (DDD) and lumbar disc herniations (LDH) was assessed.
Methods
The radiologic data of 192 patients was retrospectively analyzed. Total, proximal, and distal lumbar lordosis (LL, PLL, and DLL), pelvic incidence (PI), pelvic tilt (PT), sacral slope (SS), and sacral table angle (STA) were measured on lumbar x-ray plates. DDD and FD was graded on the MRI images. The apex of lumbar lordosis and PI-LL imbalance were noted in each patient. Correlation analyses were performed.
Results
Age and body mass index (BMI) were correlated with FD. LL and DLL are positively associated with upper-level FDs (L1-2 and L2-3) (P < 0,05). PLL were positively associated with lower level FD (L5-S1) (P < 0,05). A significant increase in PI was associated with FD in L2-3 and L4-5. A larger PT was found in FD in L4. The PI-LL imbalance was not correlated with the FD. Correlation between DDD and LDH and FD was observed in each level (P < 0,01). The level of FD is not affected by the apex of the curve.
Conclusion
Age and BMI have a direct impact on FD. However, spinopelvic parameters influence the severity of FD rather than its occurrence. In addition to the effects of lumbar lordosis as a single entity, it is essential to consider separately the effects of proximal and distal lumbar lordosis at the FD level.
Keywords
Introduction
Low back pain (LBP) is the most prevalent pain condition that affects people of all ages worldwide. The lifetime prevalence of LBP in adults in the United States is estimated to range from 65 to 80%. 1 The prevalence of lumbar facet joint (FJ)-related LBP is estimated to range between 15 and 45%, indicating that facet degeneration (FD) is a potential cause of LBP. 2
Osteoarthritis is the most prevalent form of facet pathology and a frequent cause of pain.3,4 Furthermore, arthritic degeneration of the lumbar FJs has even been cited as a potential cause of persistent LBP in patients with lumbar disc herniation (LDH) who have undergone minimally invasive discectomy.
5
According to Eubanks et al., degenerative changes are universal, with the highest prevalence at the L4-5 and L5-S1 spinal level.
6
The FJ’s play a crucial role in load transmission by providing a posterior load-bearing aid and stabilizing the motion segment in flexion and extension. By limiting axial rotation, they participate in the mechanism of rotational kinematics.
7
Although there are few publications in the literature investigating the relationship between FD, degenerative disc disease (DDD), and spinopelvic parameters, the correlative relationships between them are still unclear. The aim of this study is to elucidate the possible correlative relationships between these parameters (
Methods
This study was a retrospective data analysis conducted at a single center between March and September 2021. The Institutional Review Board of our institution approved this research (Protocol No. 2022-45). Informed consent was obtained from all participants. The medical records of 192 patients who reported low back pain were retrospectively examined. Inclusion criteria were the following:
1
Outpatients over the age of 18 suffering from symptomatic low back pain
2
patients with lateral upright standing radiographs displaying both the thoracic 12 vertebrae and the femoral heads, in addition to lumbar magnetic resonance imaging (MRI)s. The exclusion criteria were the following:
1
patients undergoing pelvic, spinal, or lower extremity surgery;
2
patients suffering from spinal deformities such as scoliosis and isthmic spondylolisthesis.
3
Patients suffering from inflammatory and neuromuscular conditions
4
patients with hip or knee arthroplasty or other lower limb realignment surgery.
5
patients with limb length disparities. Of the 248 subjects, 56 patients who met the exclusion criteria and had inadequate radiographs or no MRIs were excluded. The remaining 192 patients meeting the inclusion criteria were recruited for this study. First, spinopelvic parameters including total lumbar lordosis (LL), proximal lumbar lordosis (PLL), distal lumbar lordosis (DLL), pelvic incidence (PI), pelvic tilt (PT), sacral slope (SS), and sacral table angle (STA) were measured on the lateral upright standing radiographs using Surgimap® Software (Nemaris Inc., New York, NY, USA) by two spine surgeons simultaneously. When measuring spinopelvic parameters, it has been demonstrated that standing upright lateral radiographs yield comparable results to standing whole spine radiographs.
11
All measurements were performed with the joint decision of both experts. LL is the angle between the lines drawn parallel to the lower endplate of the T12 vertebrae and the upper-endplate of the S1 vertebrae. PLL is the angle between the lines drawn parallel to the lower endplate of the T12 vertebra and the lower endplate of the L3 vertebra. DLL is the angle between the lines drawn parallel to the upper endplate of the L4 vertebra and the upper endplate of the S1 vertebra. So, the sum of PLL and DLL is equal to LL. PI is the angle between the line perpendicular to the midpoint of the sacral plate and the line drawn from this point to the bicoxofemoral line. PT is the angle between the vertical plane and the line joining the midpoint of the sacral plate and the bi-coxo-femoral axis. SS is the angle between the sacral endplate and the horizontal axis. STA is the angle between a line parallel to the sacral endplate and a line drawn to parallel the posterior aspect of the S1 vertebral body (Figure 1). In the sagittal plane, the apex (of lumbar lordosis) was defined as the most anterior lumbar vertebra or intervertebral disk.
12
L1 through L5 vertebrae were assigned numbers ranging from 1 to 5 to facilitate data collection and correlation analysis. When the apex was located on a disc between two vertebrae, the superior vertebra number was increased by .5. For instance, the apex was recorded as 4.5 when it was located on the disc between L4 and L5. Measurement of Spinopelvic parameters.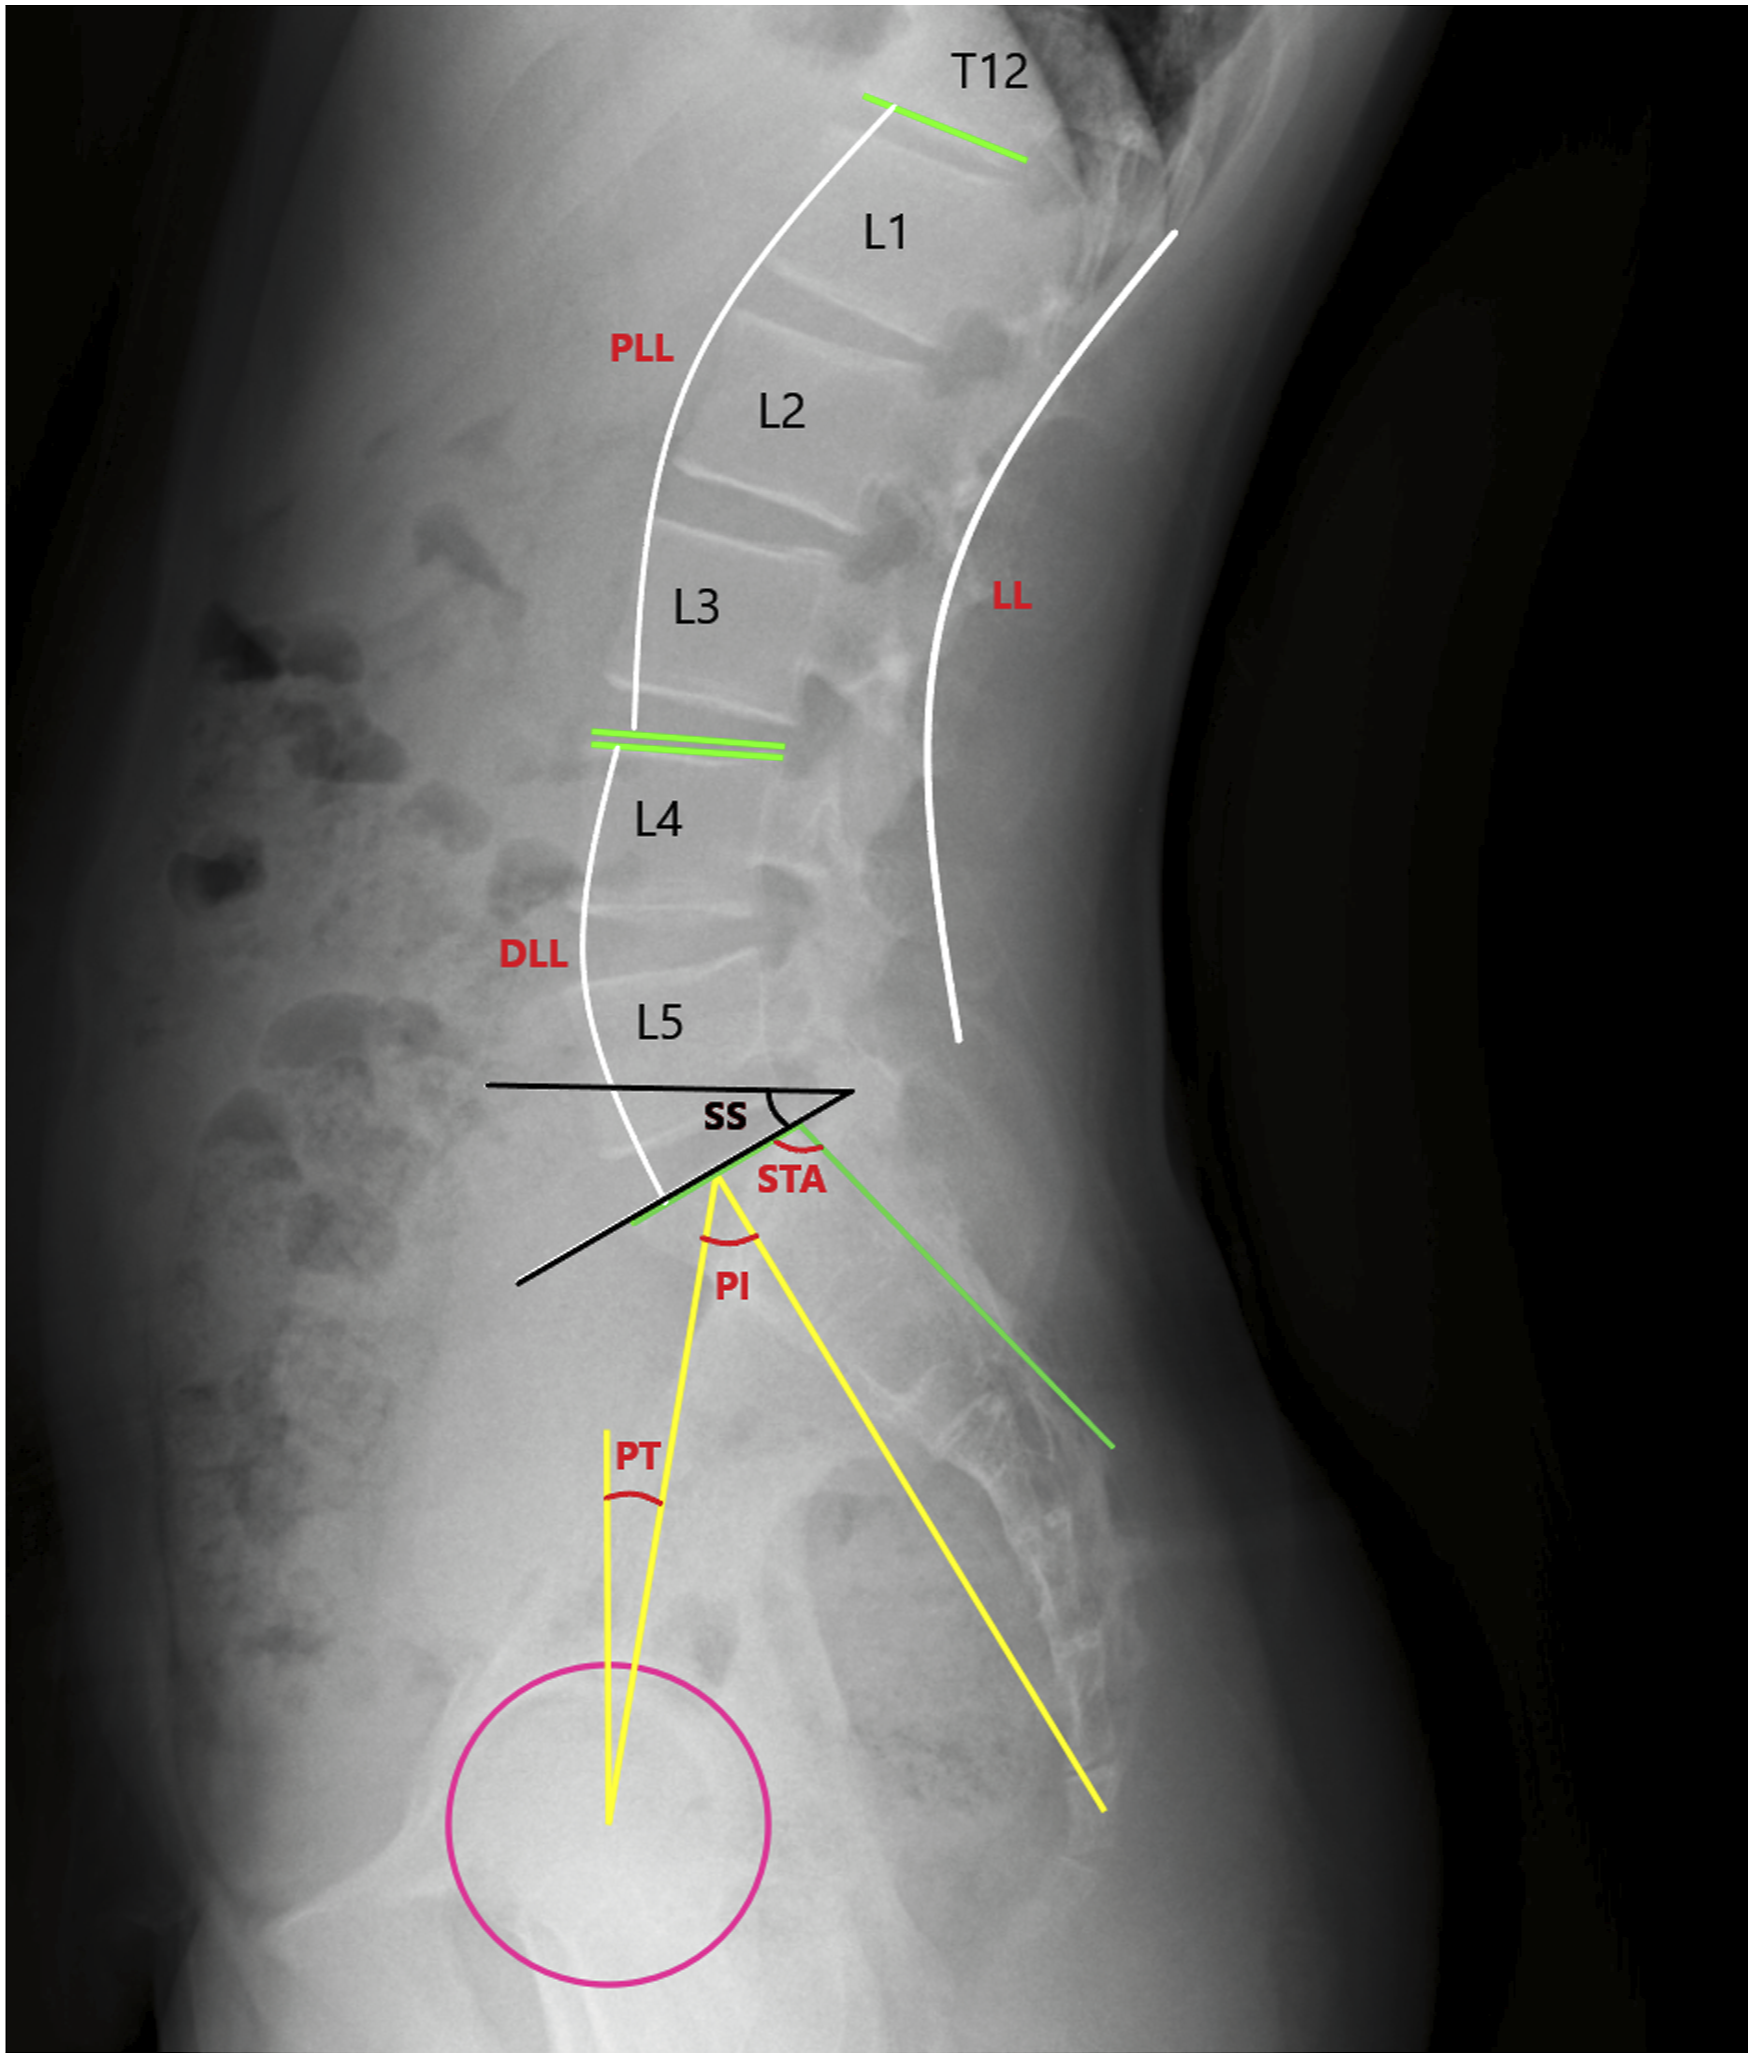
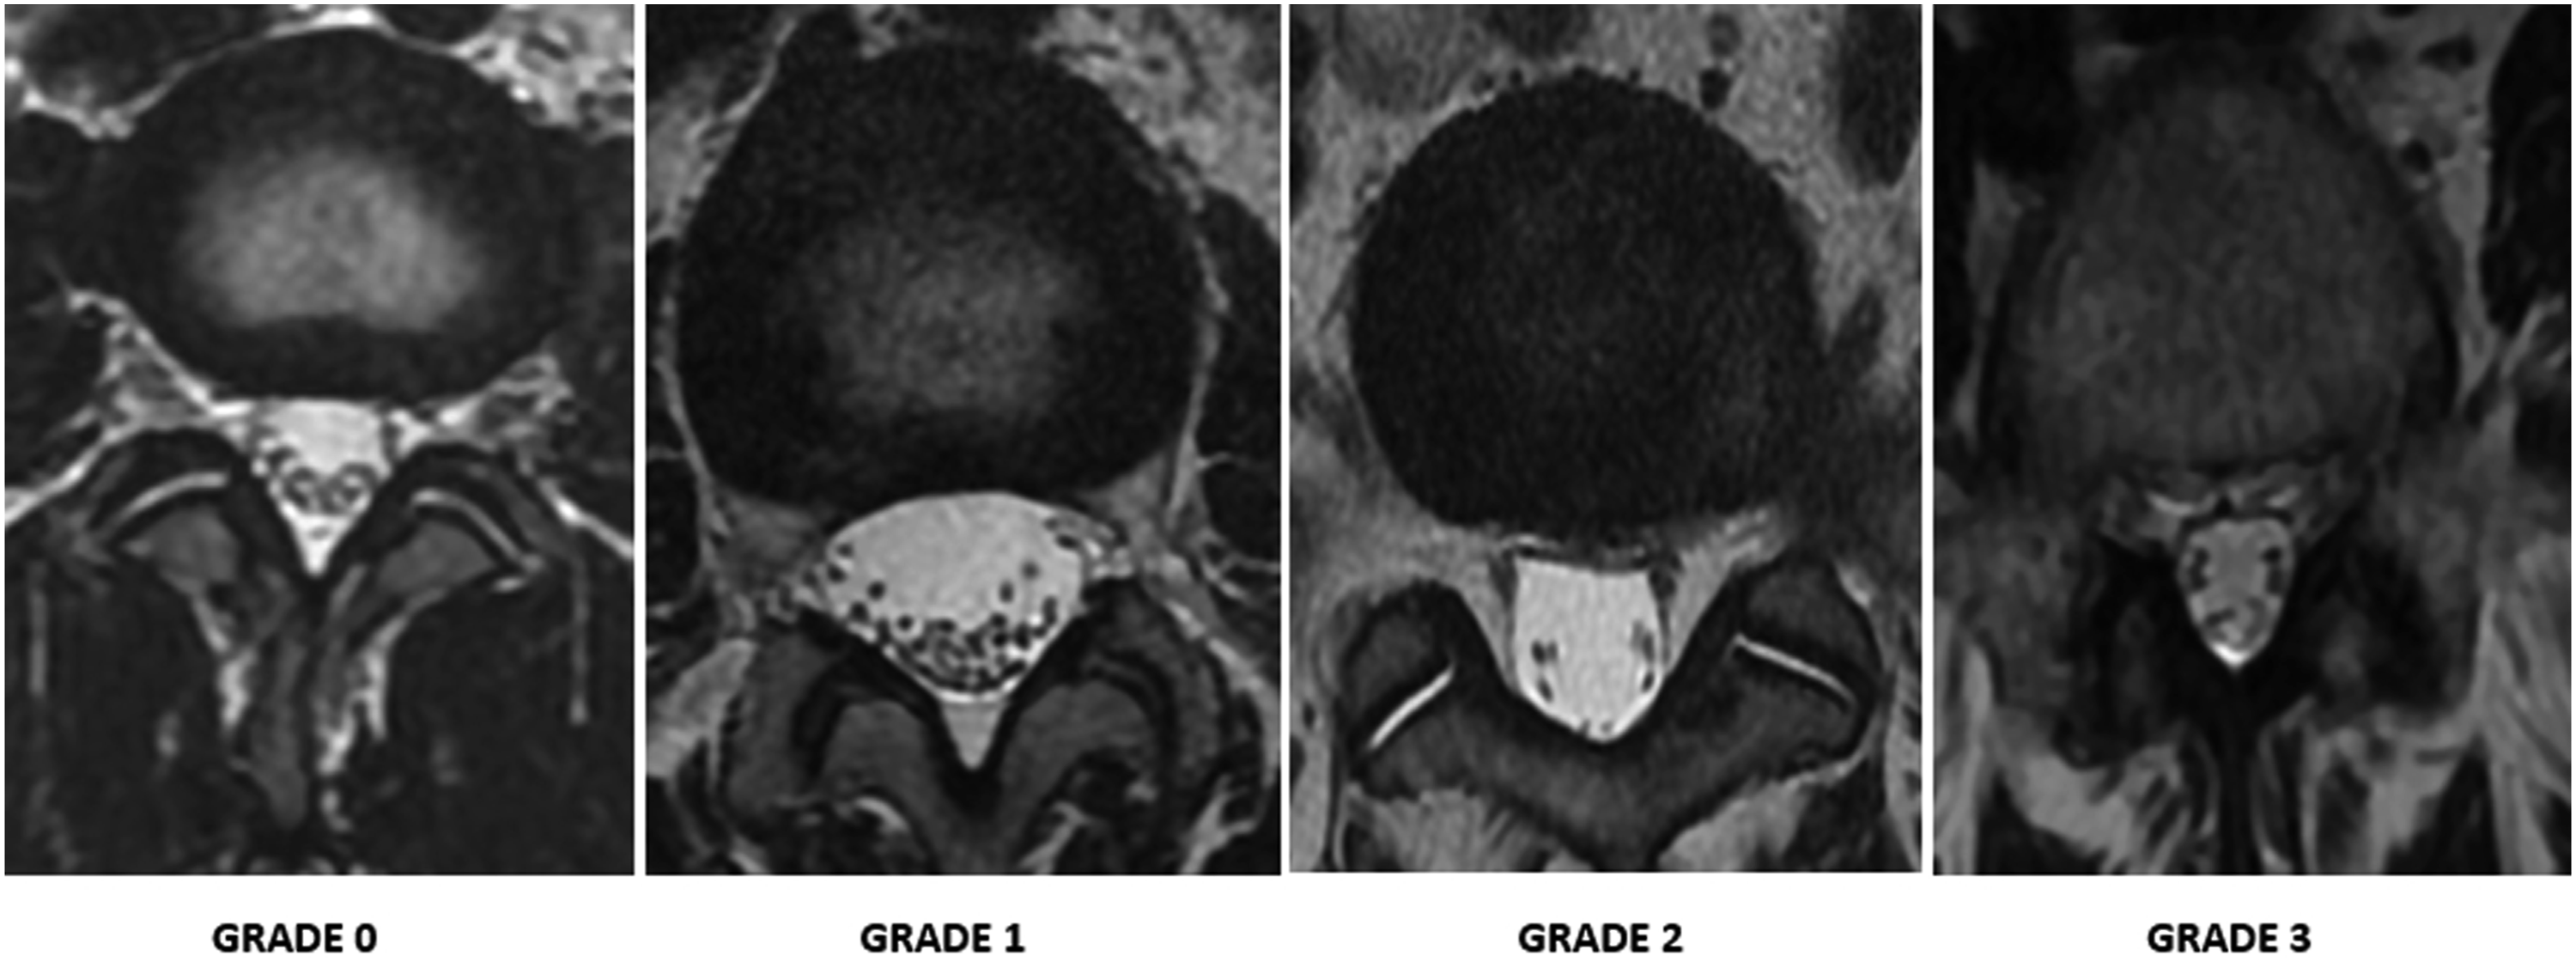
Second, based on axial T2 MRI sections, FD was graded at all lumbar levels in all patients according to the Weishaupt classification.
13
Grade 0 and 1 facets were accepted as non degenerated (FD-) (n = 80), while grade 2 and 3 facets were accepted as degenerated (FD+) (n = 112). (Figure 2). Thus, patients were stratified into two groups according to the presence of FD. Facet joint evaluation. The Weishaupt system classifies facet joint degeneration into four grades: normal (0) to severe.
3
Third, the degree of degeneration of each disc was evaluated according to the Pfirrmann classification. 14 Then, the patients were stratified into 3 groups: the non-degenerative (ND) group (n = 44), the DDD group (n = 89), and the LDH group (n = 59). Grade 1 and 2 discs were defined as non-degenerating and included in the ND group. Grade 3-4-5 discs were accepted as degenerating and included in the DDD group. Patients with grade <3 and having disc herniation on MRI were included in the LDH group. Both FJ and disc evaluations were performed by the joint decision of a spine surgeon and radiologist with 10 years of experience. Then, statistical analyses were performed to investigate the differences between the groups.
Statistical Analysis
For statistical analysis, SPSS 26 (Statistical Package for the Social Sciences) was utilized. The study data were evaluated using descriptive statistical methods (mean, standard deviation, median, frequency, percentage, minimum, and maximum). The Shapiro-Wilk test and graphical analysis were used to examine the quantitative data’s conformity to a normal distribution. The Student t test was utilized to compare two groups of normally distributed quantitative variables, whereas the Mann-Whitney U test was utilized to compare two groups of non-normally distributed quantitative variables. For comparisons of quantitative variables with normal distribution between more than two groups, one-way analysis of variance was used, whereas Games-Howell test and Bonferroni corrected pairwise evaluations were used for pairwise comparisons. The Kruskal-Wallis and Dunn-Bonferroni tests were used to compare quantitative variables that lacked a normal distribution across more than two groups. Using the Pearson chi-square test, qualitative data were compared. Using Spearman’s correlation analysis, the relationships between quantitative variables were evaluated. Acceptable statistical significance was P < .05.
Results
DDD and FD were more frequently observed at distal lumbar levels. Distributions in level basis are given in Figure 3. DDD and FD rates in level basis.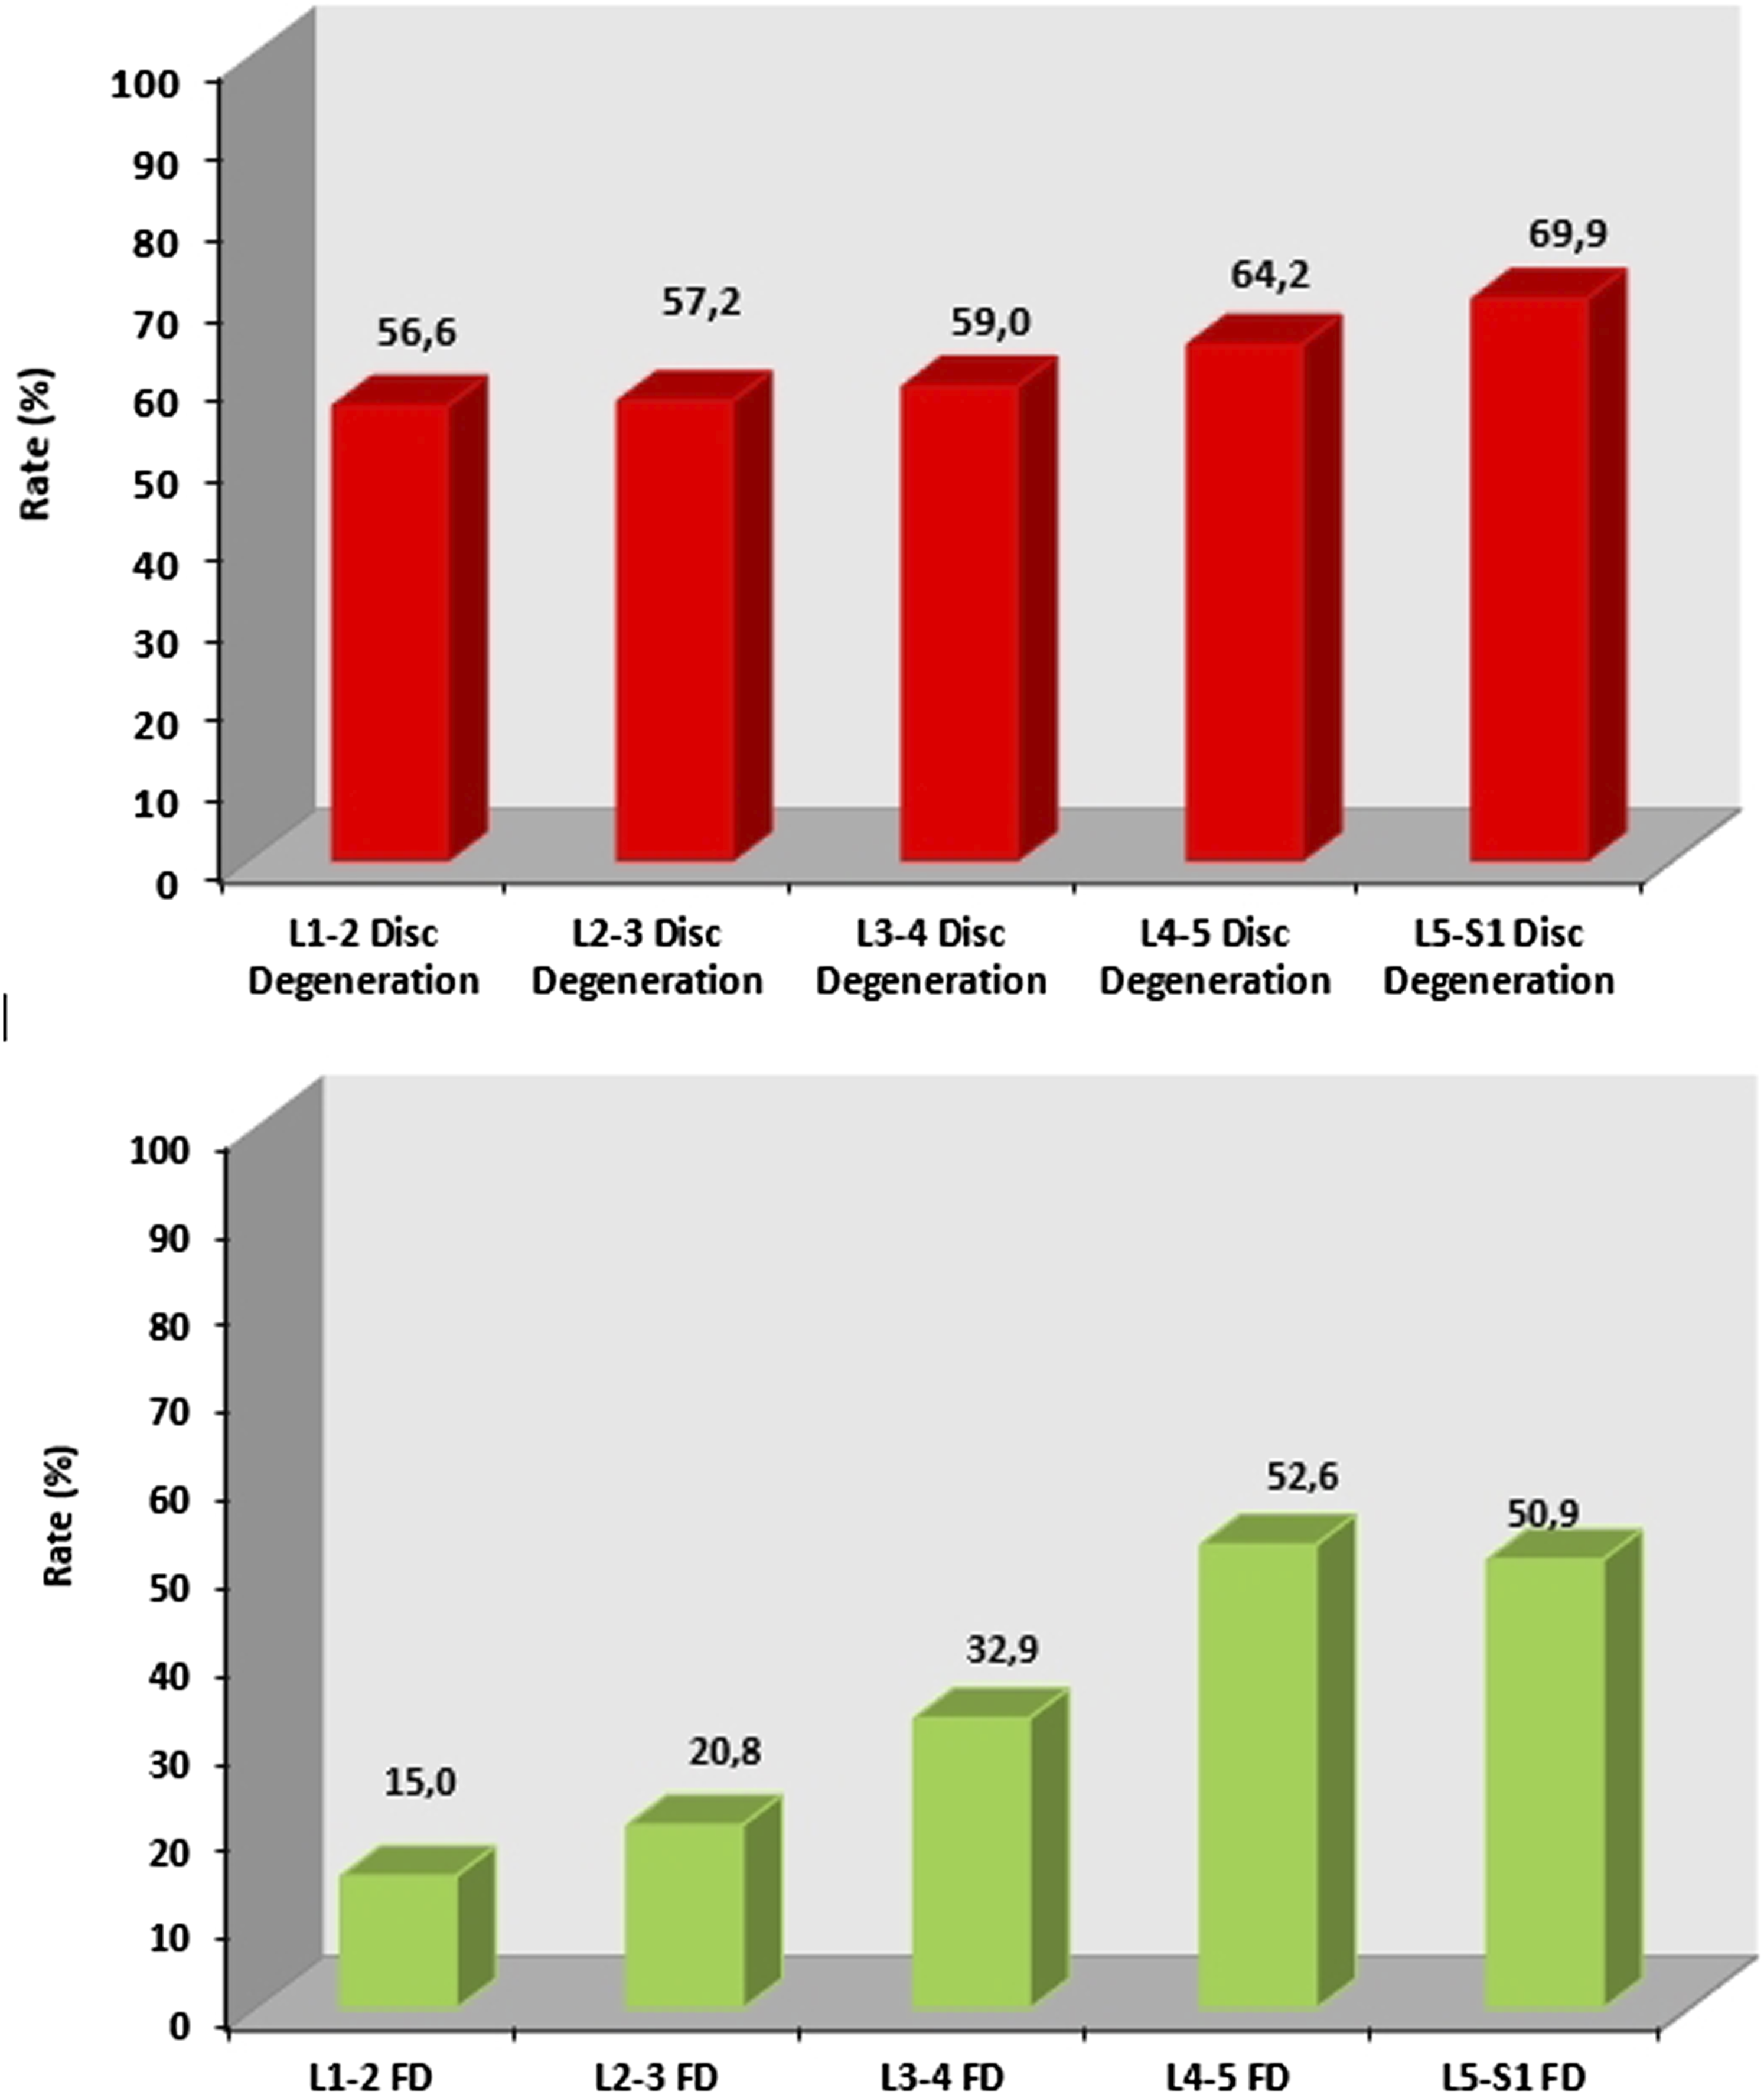
Comparison of Spinopelvic Parameters according to Facet Degeneration.
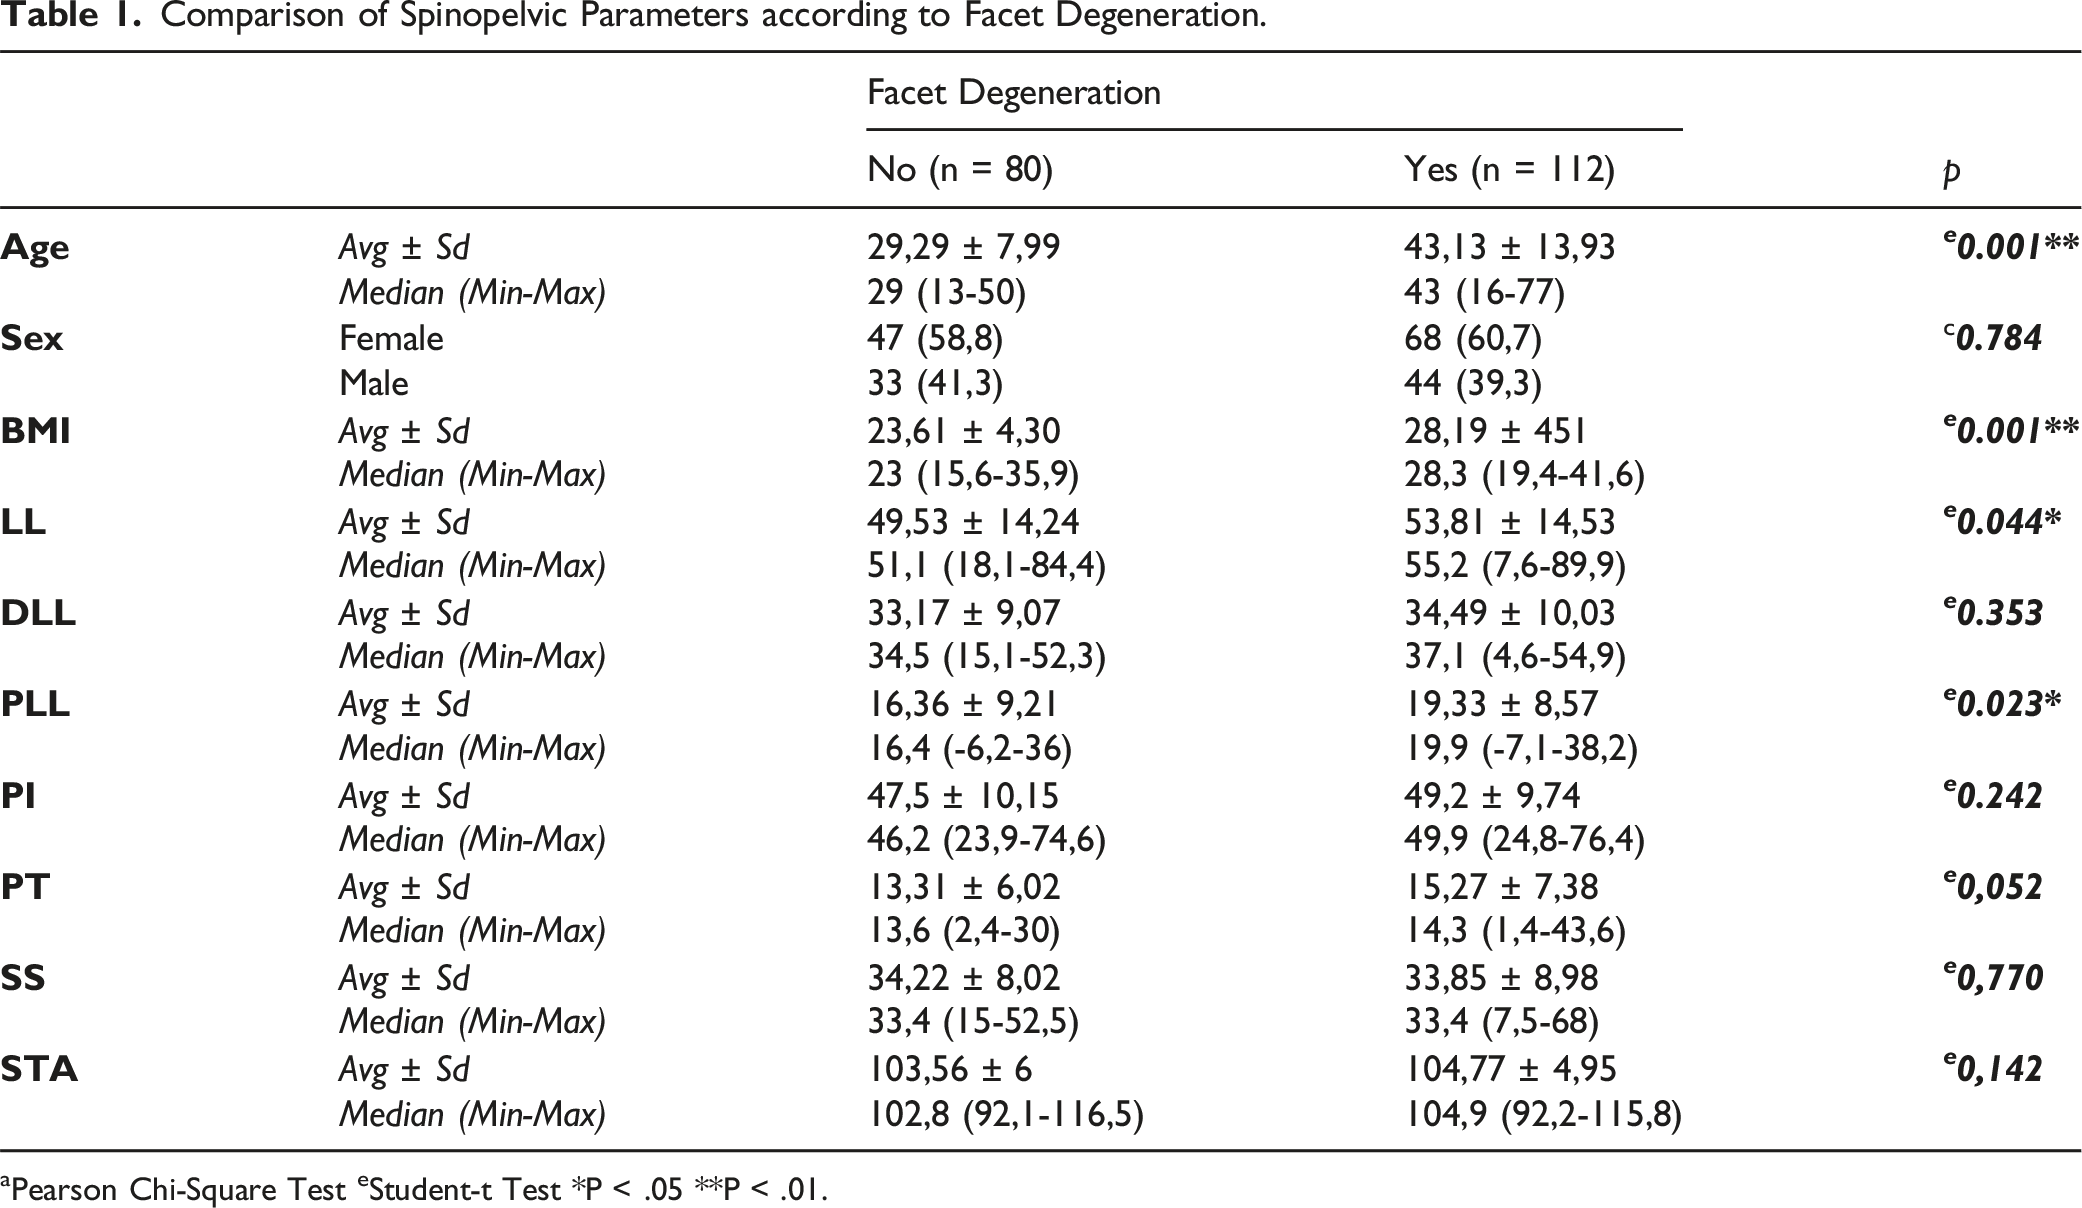
aPearson Chi-Square Test eStudent-t Test *P < .05 **P < .01.
Statistical comparison of spinopelvic parameters and facet degeneration at each level.
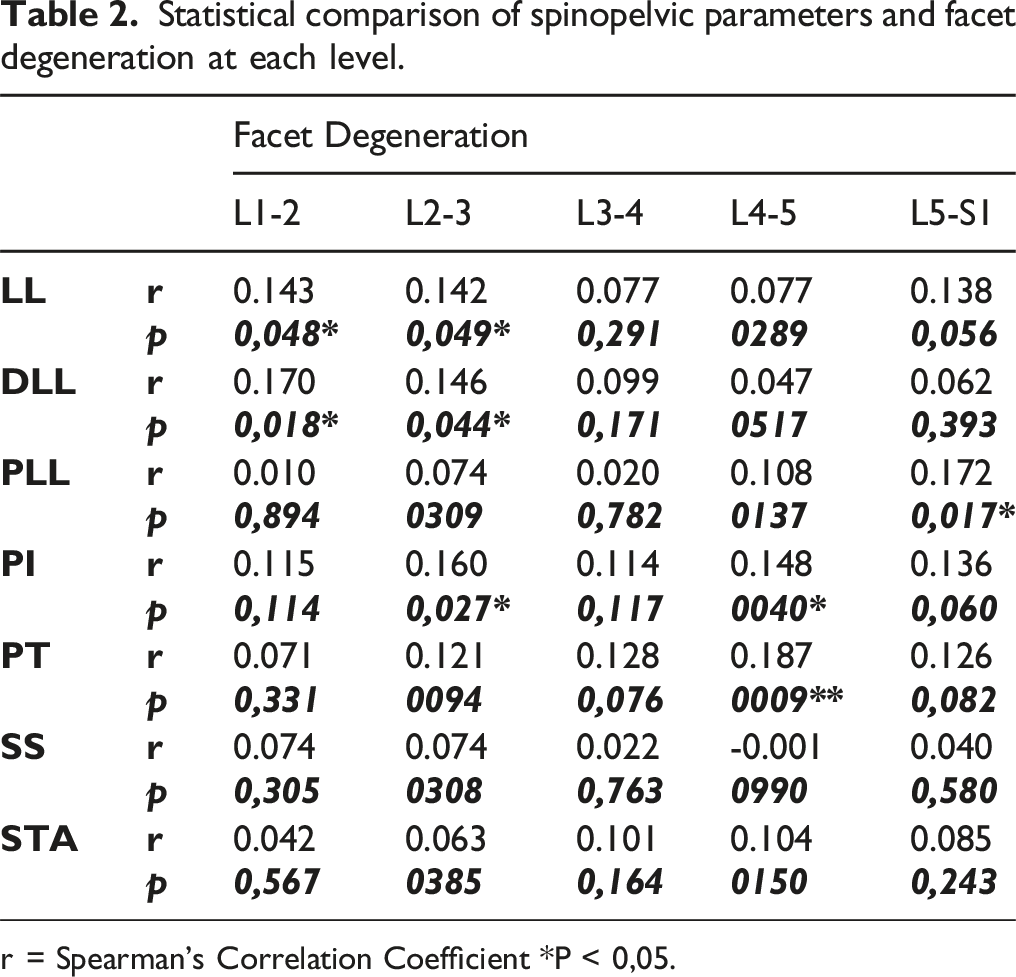
r = Spearman’s Correlation Coefficient *P < 0,05.
The level-based effect of the apex of the lumbar curve and the PI-LL mismatch on facet degeneration.
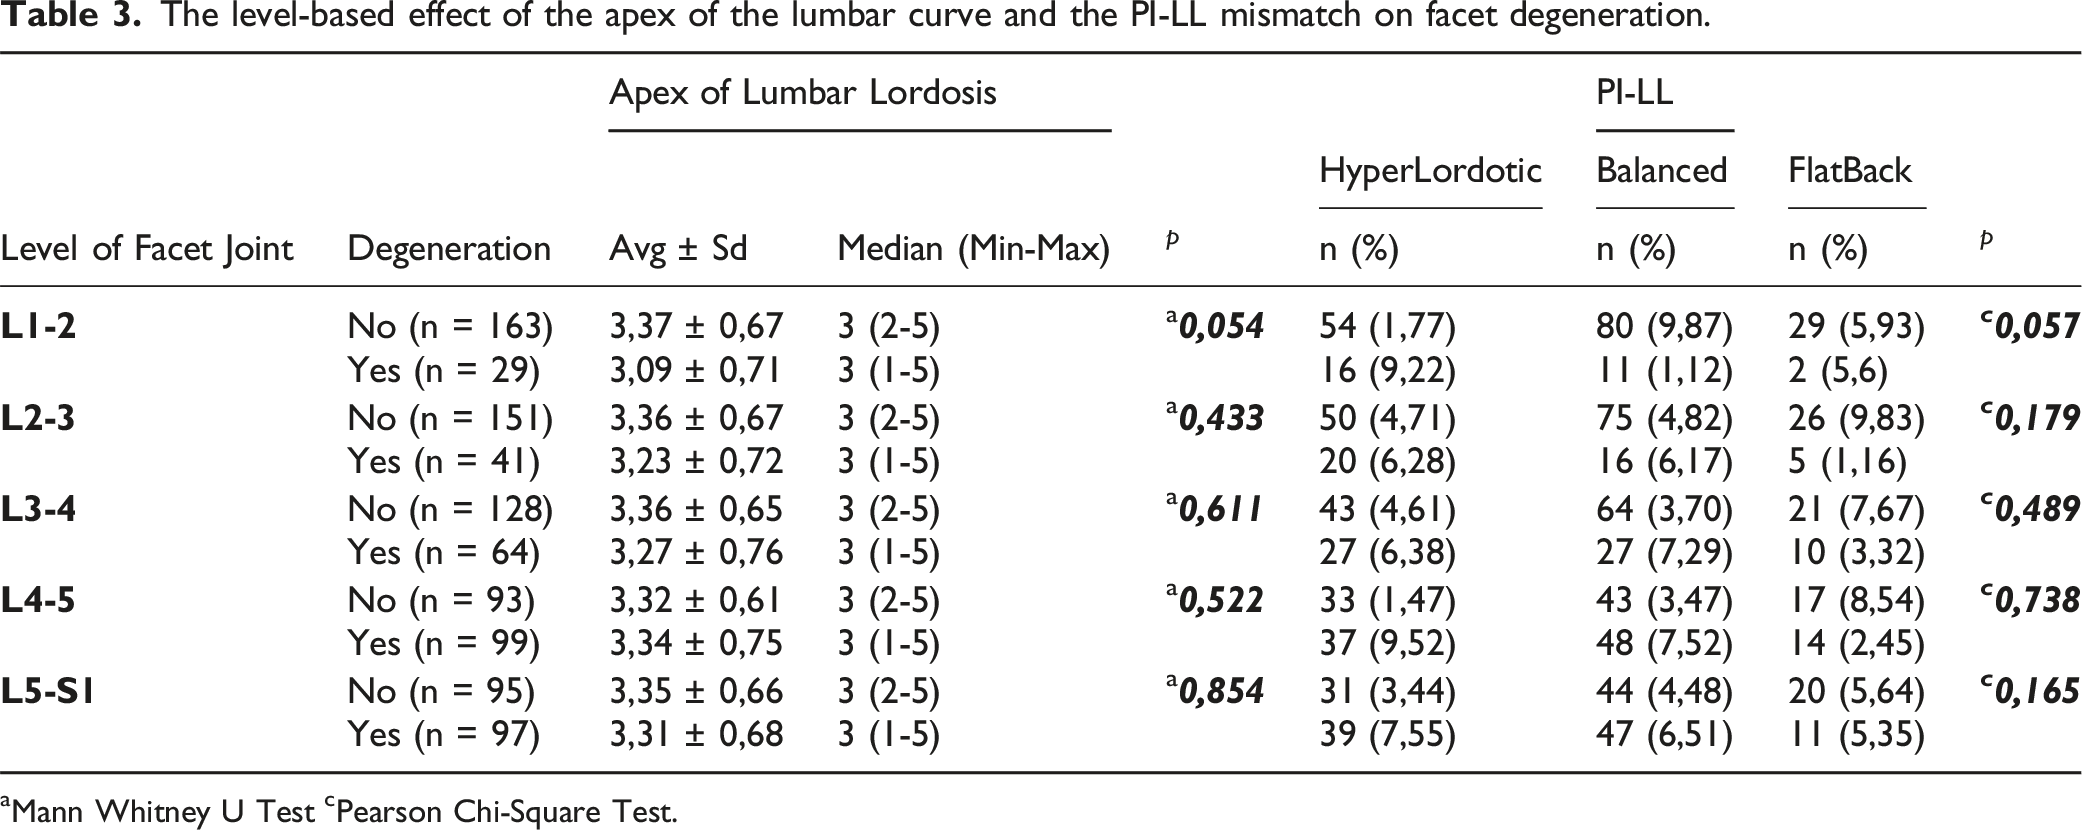
aMann Whitney U Test cPearson Chi-Square Test.
Assessment of correlation between DDD and FD in each level.
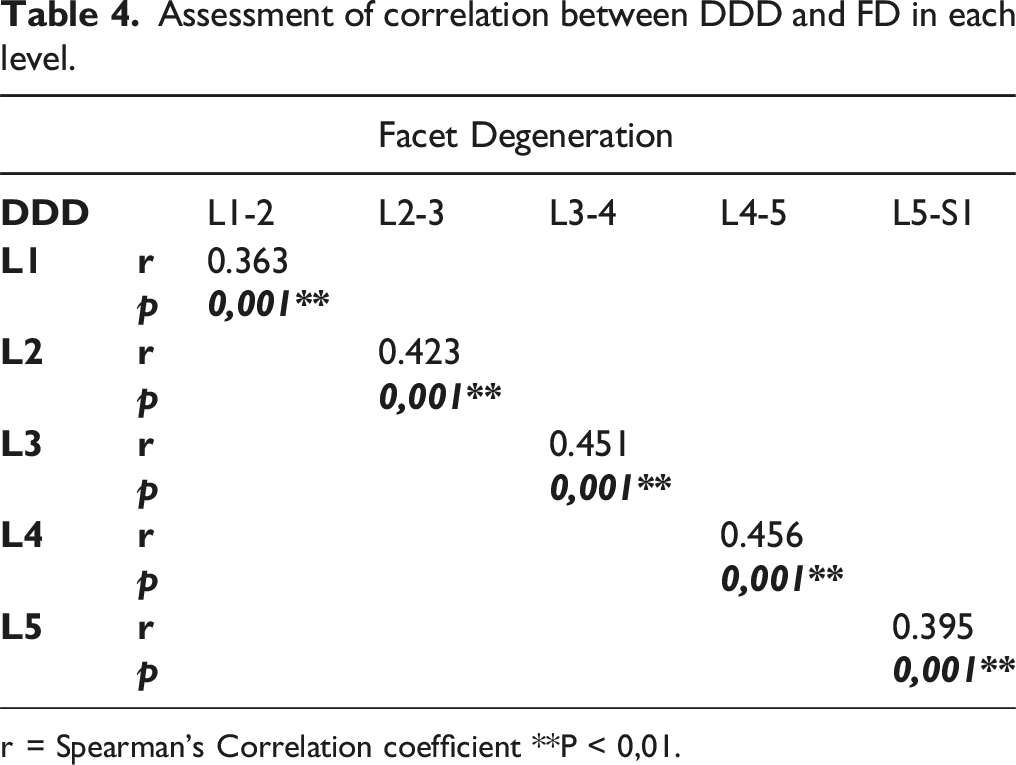
r = Spearman’s Correlation coefficient **P < 0,01.
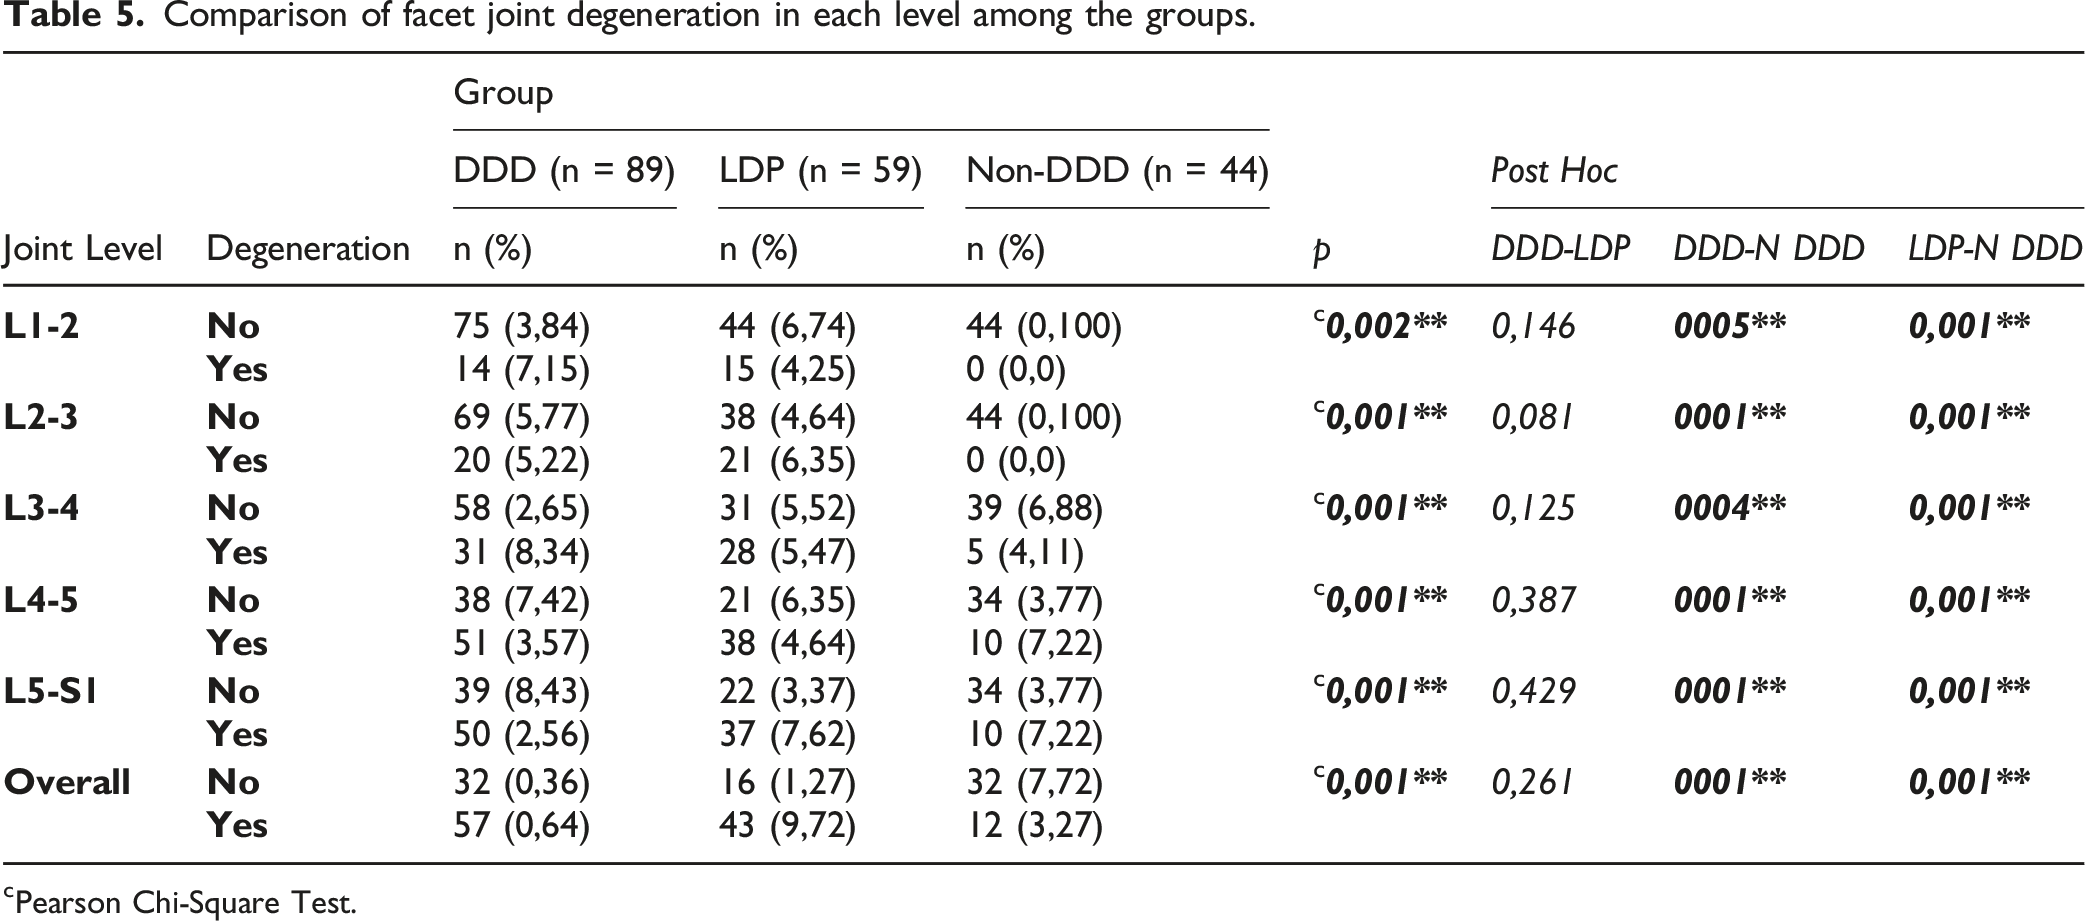
When the DDD, LDH, and ND groups were analyzed separately according to each level in terms of FD development, it was determined that the ND group had a significantly lower rate of FD development. There was no difference between the DDD and LDH groups (P = .005; P = .001; P < .01) (). Distribution of facet degeneration in each group are given in Figure 4. (Table 5). The non-DDD group exhibited a significantly lower incidence of FD across all levels. Comparison of facet joint degeneration in each level among the groups. cPearson Chi-Square Test.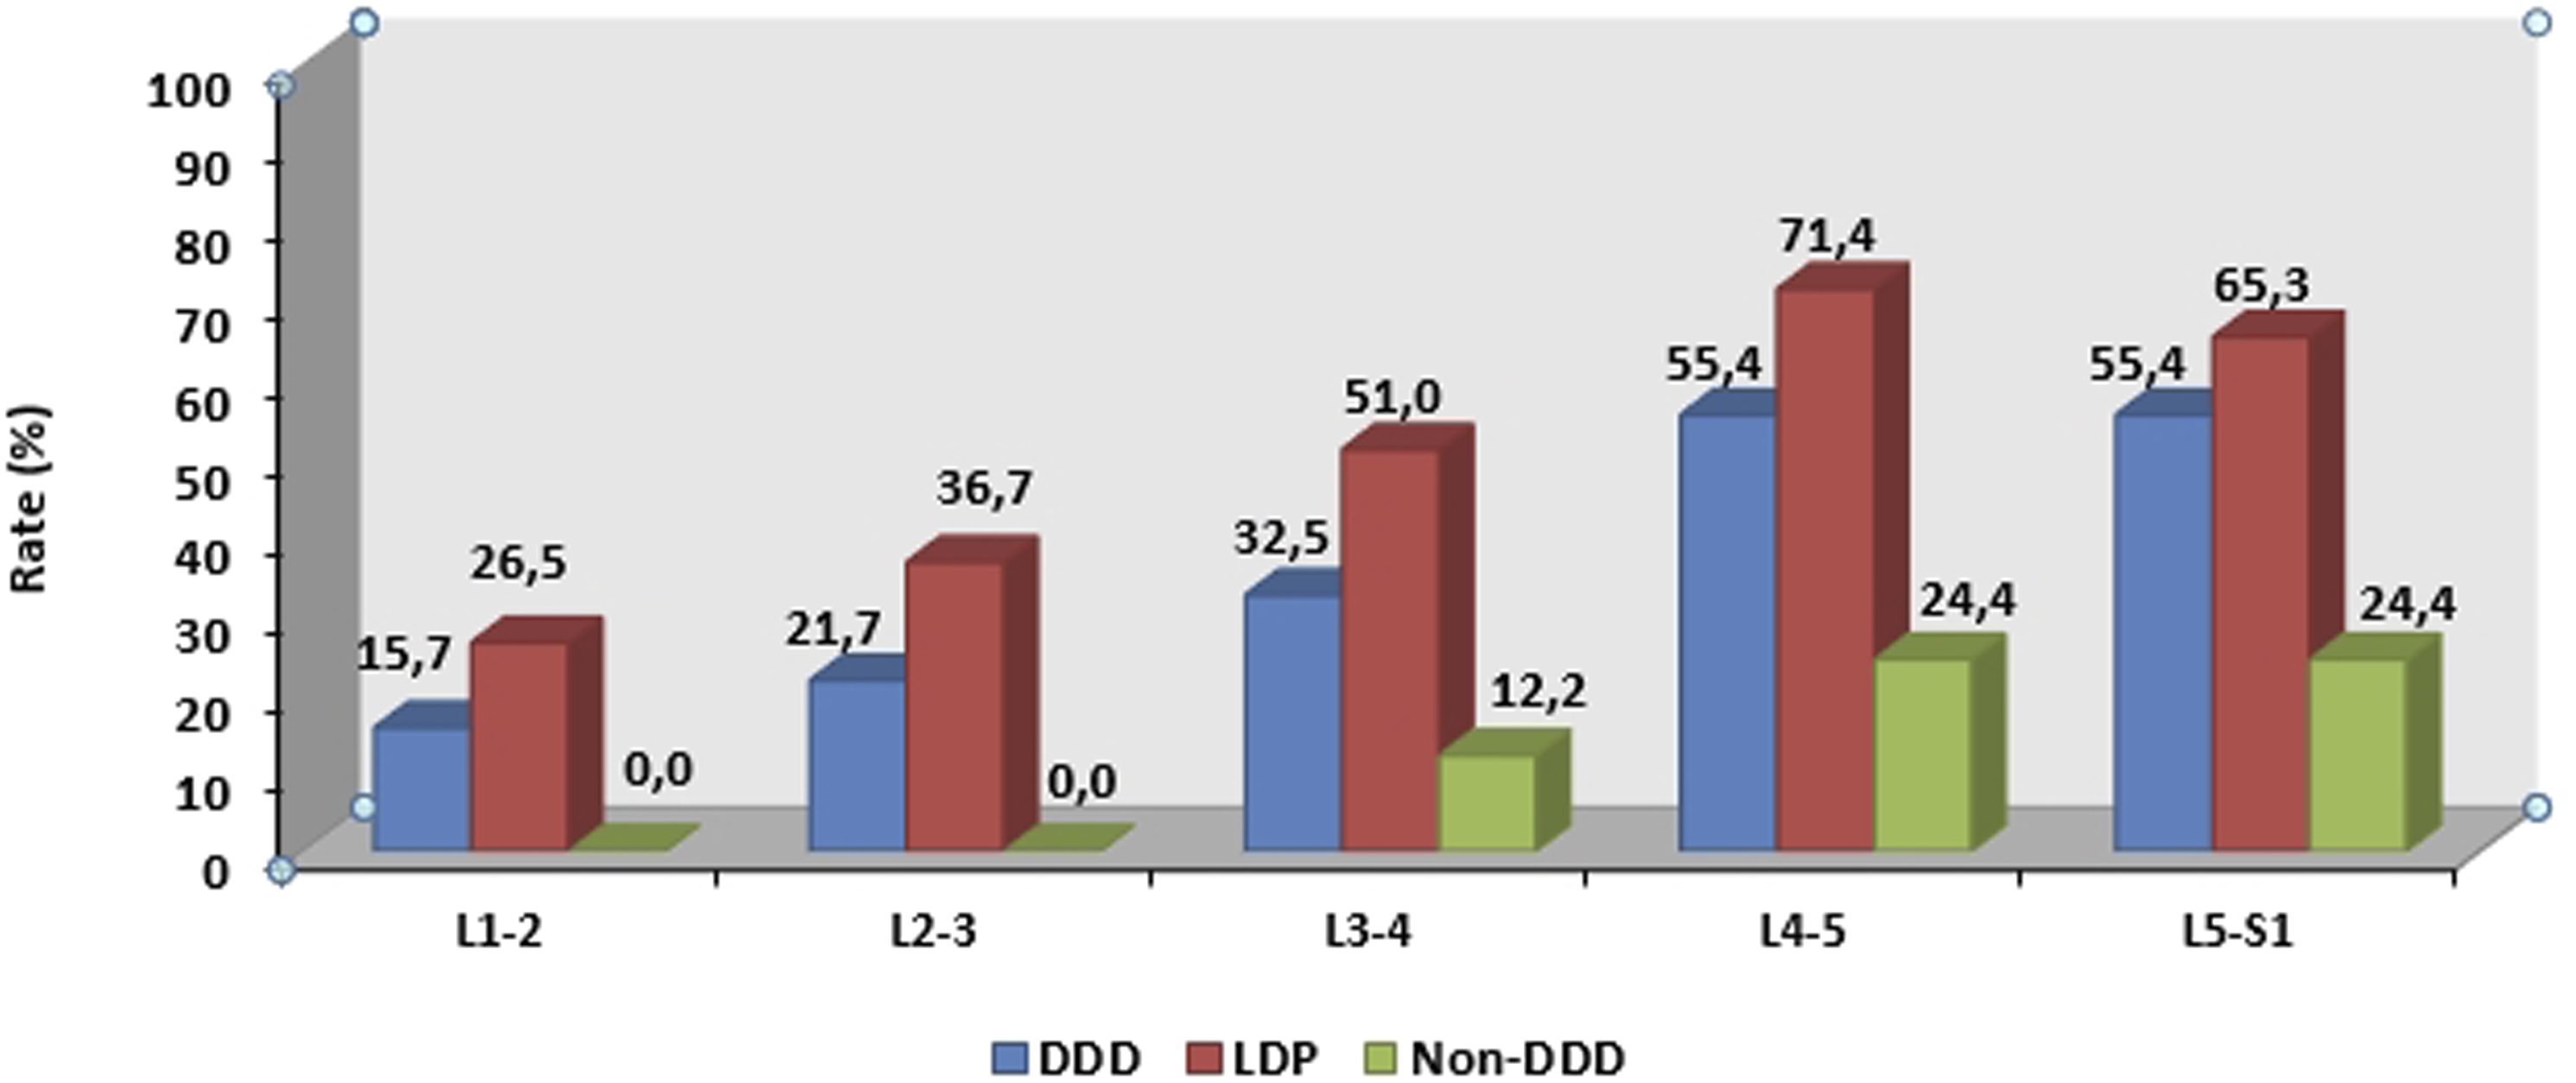
Discussion
LBP is considered a consequence of FD. Age and BMI have been reported to be related to FD. 15 Several authors note the association between DDD and FD.16,17 Our results were corresponded to these findings.
Zhu et al. found an association between LDH and FD. 18 Furthermore, FD has been considered a cause of persistent pain in patients who have undergone LDH microdiscectomy surgery. 5 In our study, we discovered a correlation between FD, DDD, and LDH at all lumbar levels.
PI and STA are considered morphologic spinopelvic parameters and remain constant after growth. The PI is fundamental to sagittal spinopelvic alignment (
The relationship between ALL, LDH, and various spinopelvic parameters has been thoroughly studied. A strong correlation between PI and ALL has been reported. 25 Han Fei et al. reported that ALL tends to be at higher levels in young LDH patients. 26 To the best of our knowledge, there is no literature evaluating the relationship between ALL and FD. In our study, we found a significant relationship between LDH and FD, as well as a relationship between PI and FD at the L4-L5 level. However, although these associations imply that there may be a correlation between ALL and FD, we did not find a direct relationship between them. Both DDD and LDH groups have a significantly higher incidence of FD at all lumbar levels. According to Kong et al., FD is followed by disc degeneration. The correlation between DDD and FD that we found in our study is consistent with this finding. 17 Sevarese et al. reported a correlation between lumbar disc degeneration and PI-LL mismatch. 28 Although this result suggests that a similar correlation may exist between PI-LL mismatch and FD, no such correlation was found in our investigation.
Conclusion
Age and BMI have a direct effect on the FD. However, spinopelvic parameters influence the severity of FD rather than its occurrence. In addition to the effects of lumbar lordosis as a whole, it is crucial to consider the effects of proximal and distal lumbar lordosis at the FD level separately.
Limitations
First, lifestyle, employment factors, and intrinsic muscle conditions that may affect facet degeneration cannot be evaluated in this retrospective study. Second, this study has a relatively small sample size. The duration of the study was brief, and long-term data are required to confirm the results
Availability of data and materials
The data used during the current study are available from the corresponding author on reasonable request.
Footnotes
Author Contributions
Conception and design: ZS, EB, OA.
Acquisition of data: ZS, EB, OA.
Data analysis and interpretation: ZS, EB.
Drafting and writing of the article: ZS, EB, OA.
Final Approval: ZS, EB, OA.
Declaration of Conflicting Interests
The author(s) declared no potential conflicts of interest with respect to the research, authorship, and/or publication of this article.
Funding
The author(s) received no financial support for the research, authorship, and/or publication of this article.