
Abstract
Study design
retrospective study of consecutive patients
Objective
to analyze the frequency of change in Thoracolumbar fractures (TLFs) classification or decision-making after MRI compared by CT alone.
Methods
A retrospective review of 244 consecutive patients with acute TLFs (T1-L5) presented to a single level 1 trauma center between 2014 and 2021. Three and 4 reviewers independently classified all fractures according to AOSpine and AOSpine injury severity score (TLAOSIS) by CT then MRI, respectively. Posterior ligamentous complex Injury (PLC) was diagnosed on CT and MRI by ≥ 2 positive CT findings and Black stripe discontinuity.
Results
MRI changed AO classification in 25/244 patients (10.2%, P < .0001) due to an 8.2% upgrade from type A to type B and a 2% downgrade from type B to type A. The addition of MRI changed TL AOSIS among the 3 treatment recommendation groups in 35/244 (19.7%, 95% CI [14.9%-25.2%]. The best predictor of upgrade from type A to type B and downgrade from type B to type A was a single positive CT finding and the presence of only 2 CT signs as opposed to ≥3 signs, respectively (P < .0001 P = .03, respectively). Thoracic fractures showed a significantly higher reclassification rate than thoracolumbar and low lumbar (20% vs 10% and 0%, respectively, P = .07).
Conclusion
using appropriate CT/MRI criteria for PLC injury, MRI changed the AOSpine classification by 10% and TLAOSIS based treatment by 19.7%. The best predictors of fracture reclassification by MRI were the number of positive CT findings and fracture level.
Keywords
Introduction
Over the last few decades, several classification systems have proposed classifying thoracolumbar fractures (TLFs) based on injury’s morphology or mechanism as depicted on plain radiography or computed tomography (CT).1,2 More recently, the Thoracolumbar Injury Classification System (TLICS) and the new AOSpine classification systems have emphasized the integrity of the posterior ligamentous complex (PLC).3,4 As a result, the use of magnetic resonance imaging (MRI) as a reference study for PLC evaluation is growing. 5 However, its high cost, limited accessibility, and prolonged scanning time limit MRI’s applicability in emergency settings and may explain why the new AOSpine classification was predominantly CT-based.4,5 On the other hand, the previously reported high rate of PLC injury overlooked on CT alone remains a major concern. 6 There are no clear guidelines for MRI in neurologically intact patients with TLFs, resulting in missed PLC injuries or, at times, overuses of MRI. 7
According to a recent systematic review, only 2 previous studies have indicated that MRI can significantly alter TLFs’ classification or management plan (range 24-31% and 16%, respectively).7-9 However, previous research might have had significant methodological bias and provided insufficient evidence to guide decisions about when to perform MRI for TLFs. 7 First, the small sample size (n = 33 and 100) and non-consecutive patient recruitment could have produced a sampling bias, limiting the findings′ generalizability.7-10 More importantly, the previous work could have resulted in a misclassification bias due to imperfect MRI or CT criteria for identifying PLC injury.10,11 Previous studies defined PLC injury on MRI as any abnormal MRI signal change, rather than black stripe discontinuity, even though this criterion has been shown to “over-read” PLC injuries compared to intraoperative findings.12,13 Similarly, previous studies defined PLC injury on CT based on any positive CT findings of PLC injury without accounting for the varied predictive values or combined value of CT findings for PLC injury.8,9,14 Notably, 2 recent studies examined the diagnostic value of combined CT findings concluding that at least 2 positive CT findings, but not a single finding, yielded a sufficiently high predictive value (88-91%) to warrant its use as a criterion for PLC injury.15,16 Finally, the Thoracolumbar AOSpine Injury Severity Score (TLAOSIS) has proposed treatment recommendations based on injury score: ≤ 3 conservatives, 4-5 either surgical or conservative, > 5 surgical. However, no prior studies have evaluated the impact of MRI in decision-making based on TLAOSIS compared with CT alone. 17 This study’s primary goal is to examine the impact of MRI on TLFs' classification and decision-making compared to CT alone, attempting to address most of the shortcomings of previous studies.
Material and Methods
Ethical Statement
Our institutional review board approved this single-center study, which was conducted in a level 1 trauma center. Informed consent was waived due to the retrospective design of the study. We have followed the published guidelines on the Standards for the Reporting of Diagnostic Accuracy Studies (STARD).18,19
Inclusion/Exclusion Criteria
We retrospectively reviewed our radiology information system for consecutive patients who presented to our center with 1 or more acute TLFs between January 2014 and June 2021. All patients suspected of high-energy spinal trauma in our center perform a whole-body CT. Additionally, most of the patients will do MRI, but the decision may vary according to the preference of the primary physician. The inclusion criteria were (1) a thoracic or lumbar vertebral body fracture (T1–L5), excluding patients with isolated posterior element fractures; (2) patients who underwent both CT and MRI within 10 days of the date of the Injury
20
3) patients with multi-level fractures were included; however, we only graded the injured level with the highest AO grade.
4
Of 365 patients who fulfilled the inclusion criteria, we excluded 121 patients (33.1%, Figure 1) for any of the followings: patients with a neurological deficit including complete or incomplete spinal cord or cauda equina or radicular symptoms (n = 84; including 43 type C fractures, 22 type B fractures,18 A4, and 1 A3 fracture; all were treated surgically),
5
osteoporotic fractures (n = 24; considered for low-energy trauma), inadequate coverage of fractured segments by MRI or CT images (n = 3), low-quality MRI images due to motion artifacts (n = 3), cervicothoracic fractures (n = 4), questionable fracture acuity (n = 1, suggested by lack of bone marrow edema on MRI), pathological fractures due to spinal metastases (n = 1), and prior spinal surgery (n = 1). Flow chart of all participants in the study. 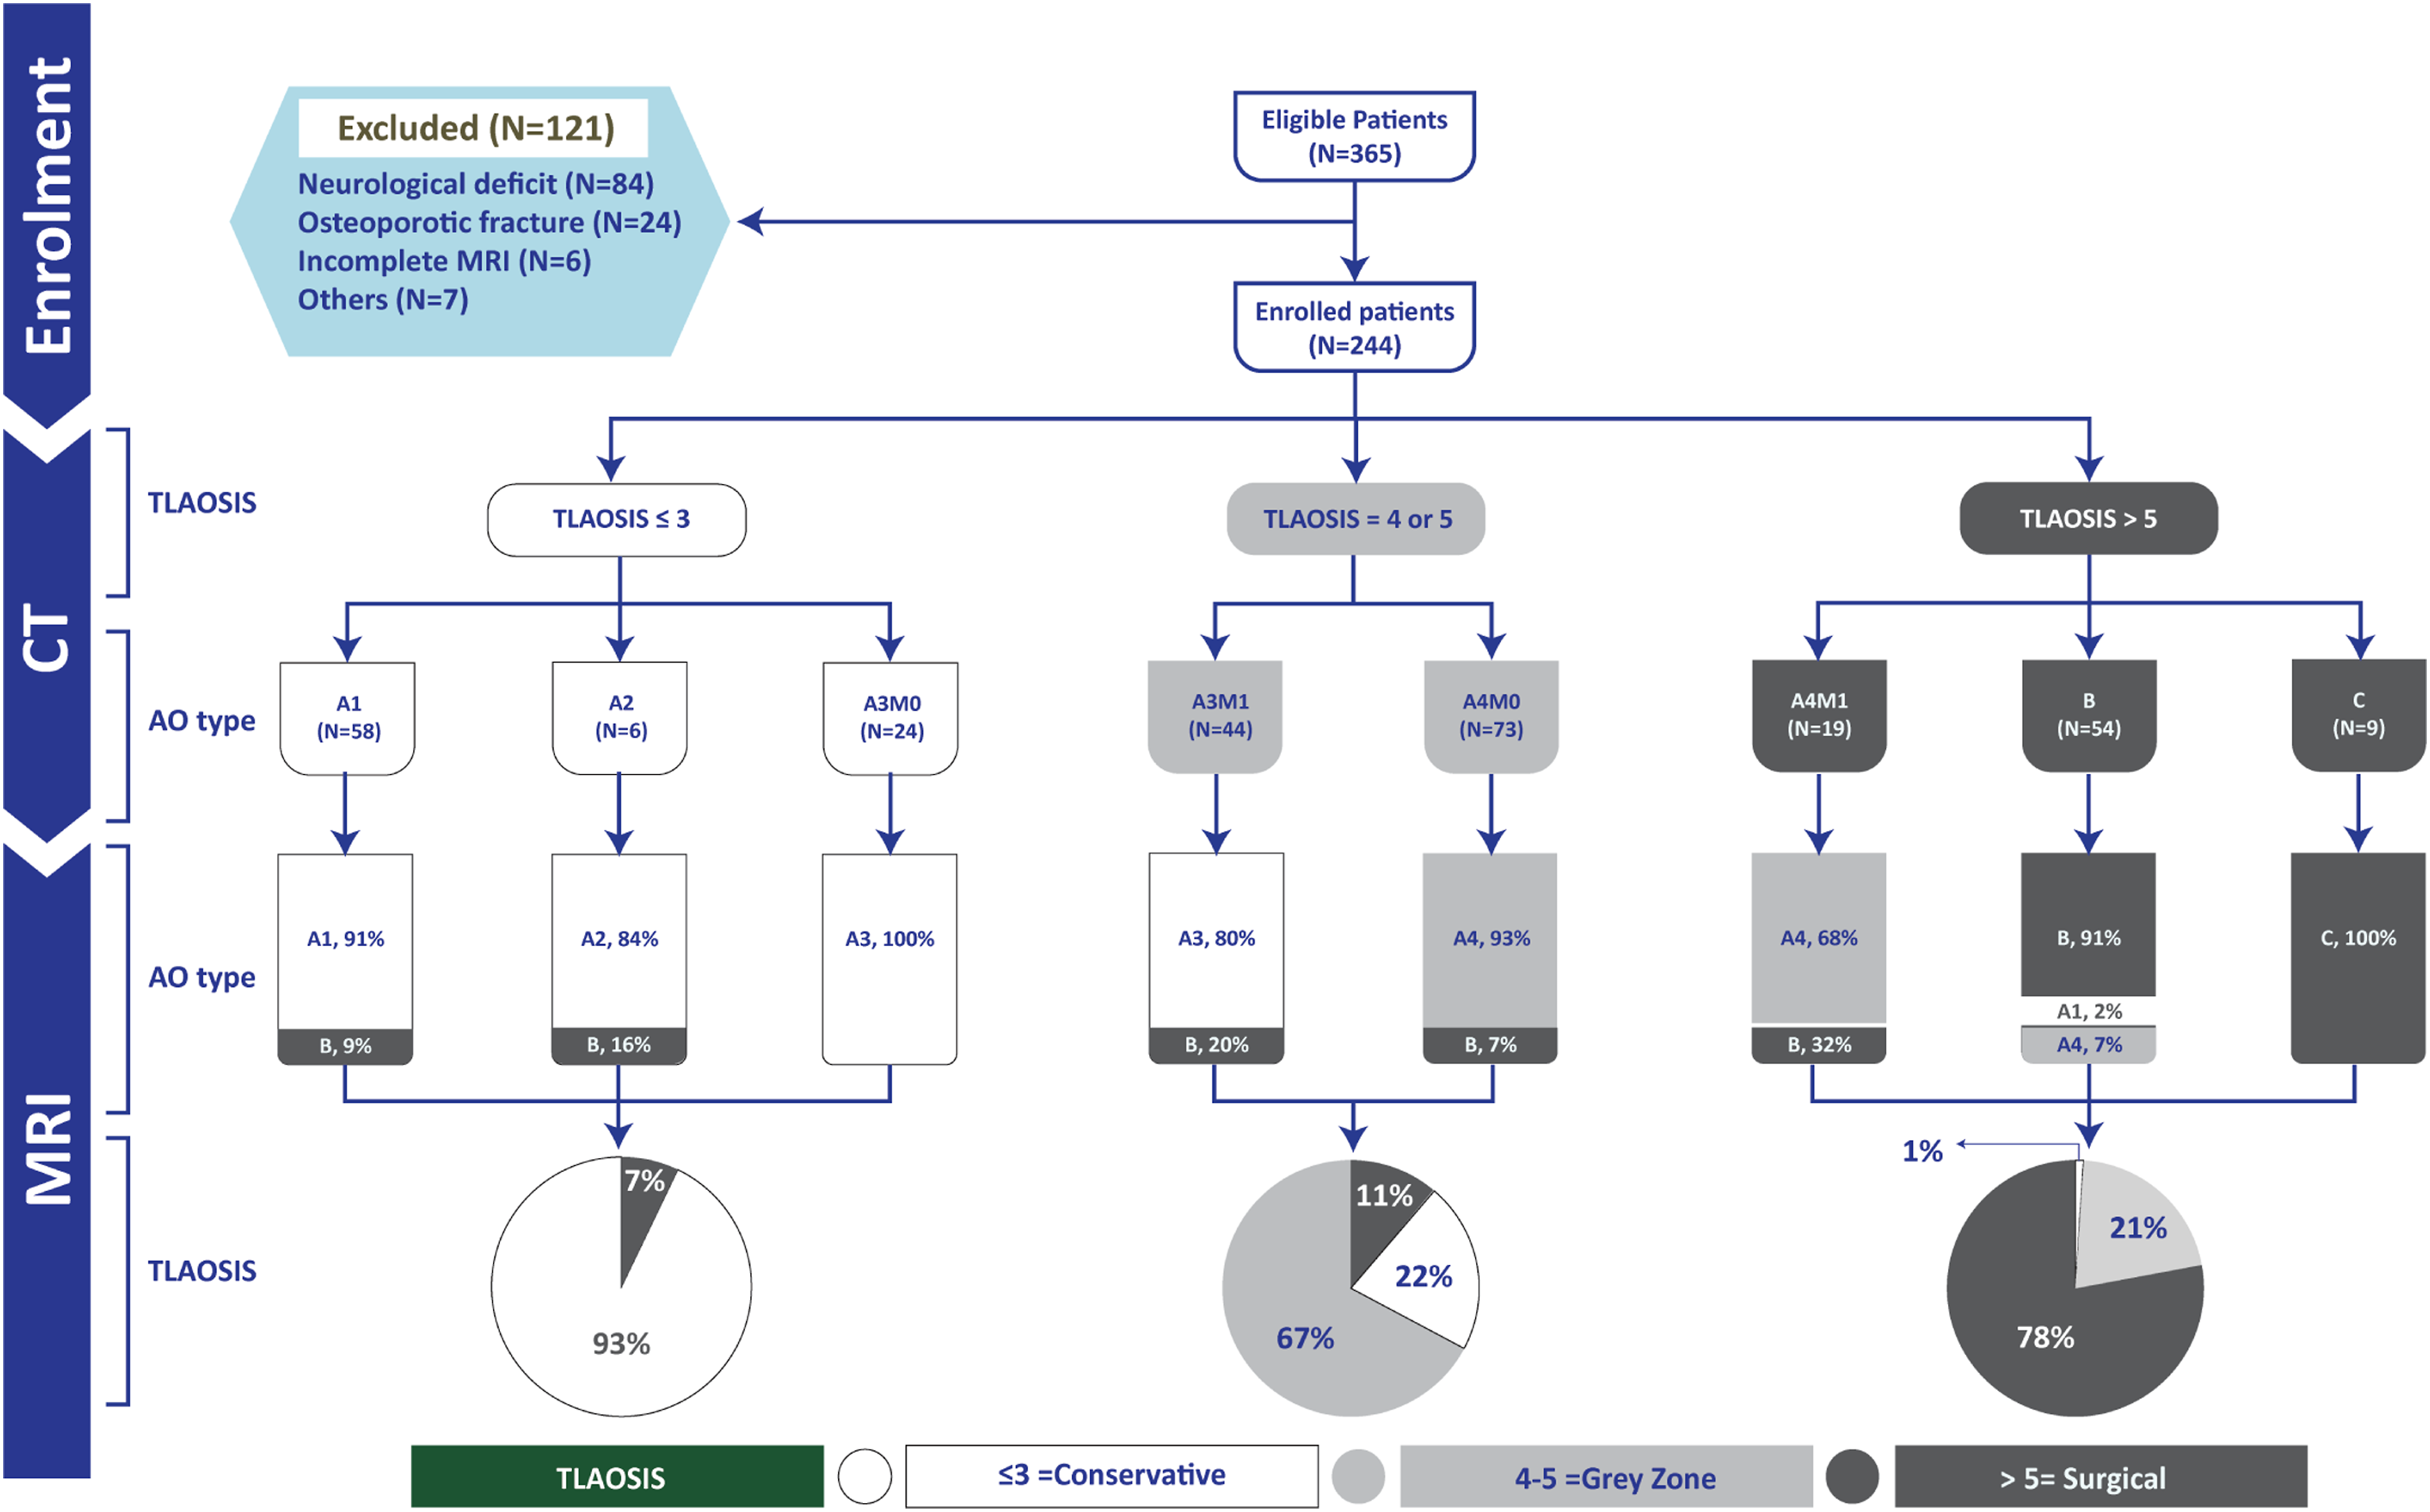
Data Collection
We collected the demographic data from the patients’ records and included age, sex, mechanism of injury, levels and number of fractures, associated injuries, treatment mode, and neurological status (based on the American Spinal Injury Association [ASIA] Impairment Scale). 4 In addition, we conducted a longitudinal chart review for patients with MRI reclassification to determine whether they were treated surgically or conservatively. Cases treated conservatively were examined at the latest follow-up to see if they had back pain, deformity, neurological deficit, or required additional surgery.
CT and MRI Image Acquisition
Per previously described CT protocols, CT images were obtained using a 64-slice multidetector CT scanner (GE, Discovery HD 750, Chicago, Illinois, USA). 16 MRIs were performed on 2 different scanners: 125 patients on a 1.5-T MRI scanner (GE Optima MR450W) and 119 patients on a 3-T MRI scanner (Magnetom Skyra [Siemens Healthcare, Munich, Germany]). The MRI spine trauma protocol included axial and sagittal T2-weighted and T1-weighted images and sagittal short tau inversion recovery (STIR), with a slice thickness of 3 mm for sagittal and 4 mm axial, using a matrix size of 240 × 320. 21,14
Image Interpretation Protocol
Three reviewers reviewed all CT and MRI images on PACS: a fellowship-trained neuroradiologist (AA) and 2 senior spinal surgeons (MMA, HE). A fourth reviewer, a general radiologist (SA), only looked at the MRI images. All 4 reviewers had more than 10 years of trauma imaging experience and prior consensus training on the standardization of the definition and best imaging plan or sequence for each CT or MRI imaging fining (Figures 2 and 3).
16
Each reviewer independently classified fractures according to AOSpine Classification on CT and MRI in 2 sessions with 8 week intervals.18,19 To calculate intra-rater agreement, a reviewer reviewed the images for 2 rounds. Clinical data and other readings were blinded to the reviewers during the image review.3,18,19 We used the approval by a minimum of 2 of the 3 PLC status reviewers in CT and 3 of the 4 PLC status reviewers in MRI as the reference standard for diagnostic accuracy analysis. Disagreement about the status of the MRI (2 disrupted vs two non-disrupted) was resolved by a consensus decision among the 4 reviewers (default analysis).
22
CT checklist for diagnosis of PLC injury. MRI Checklist for diagnosis of PLC injury. 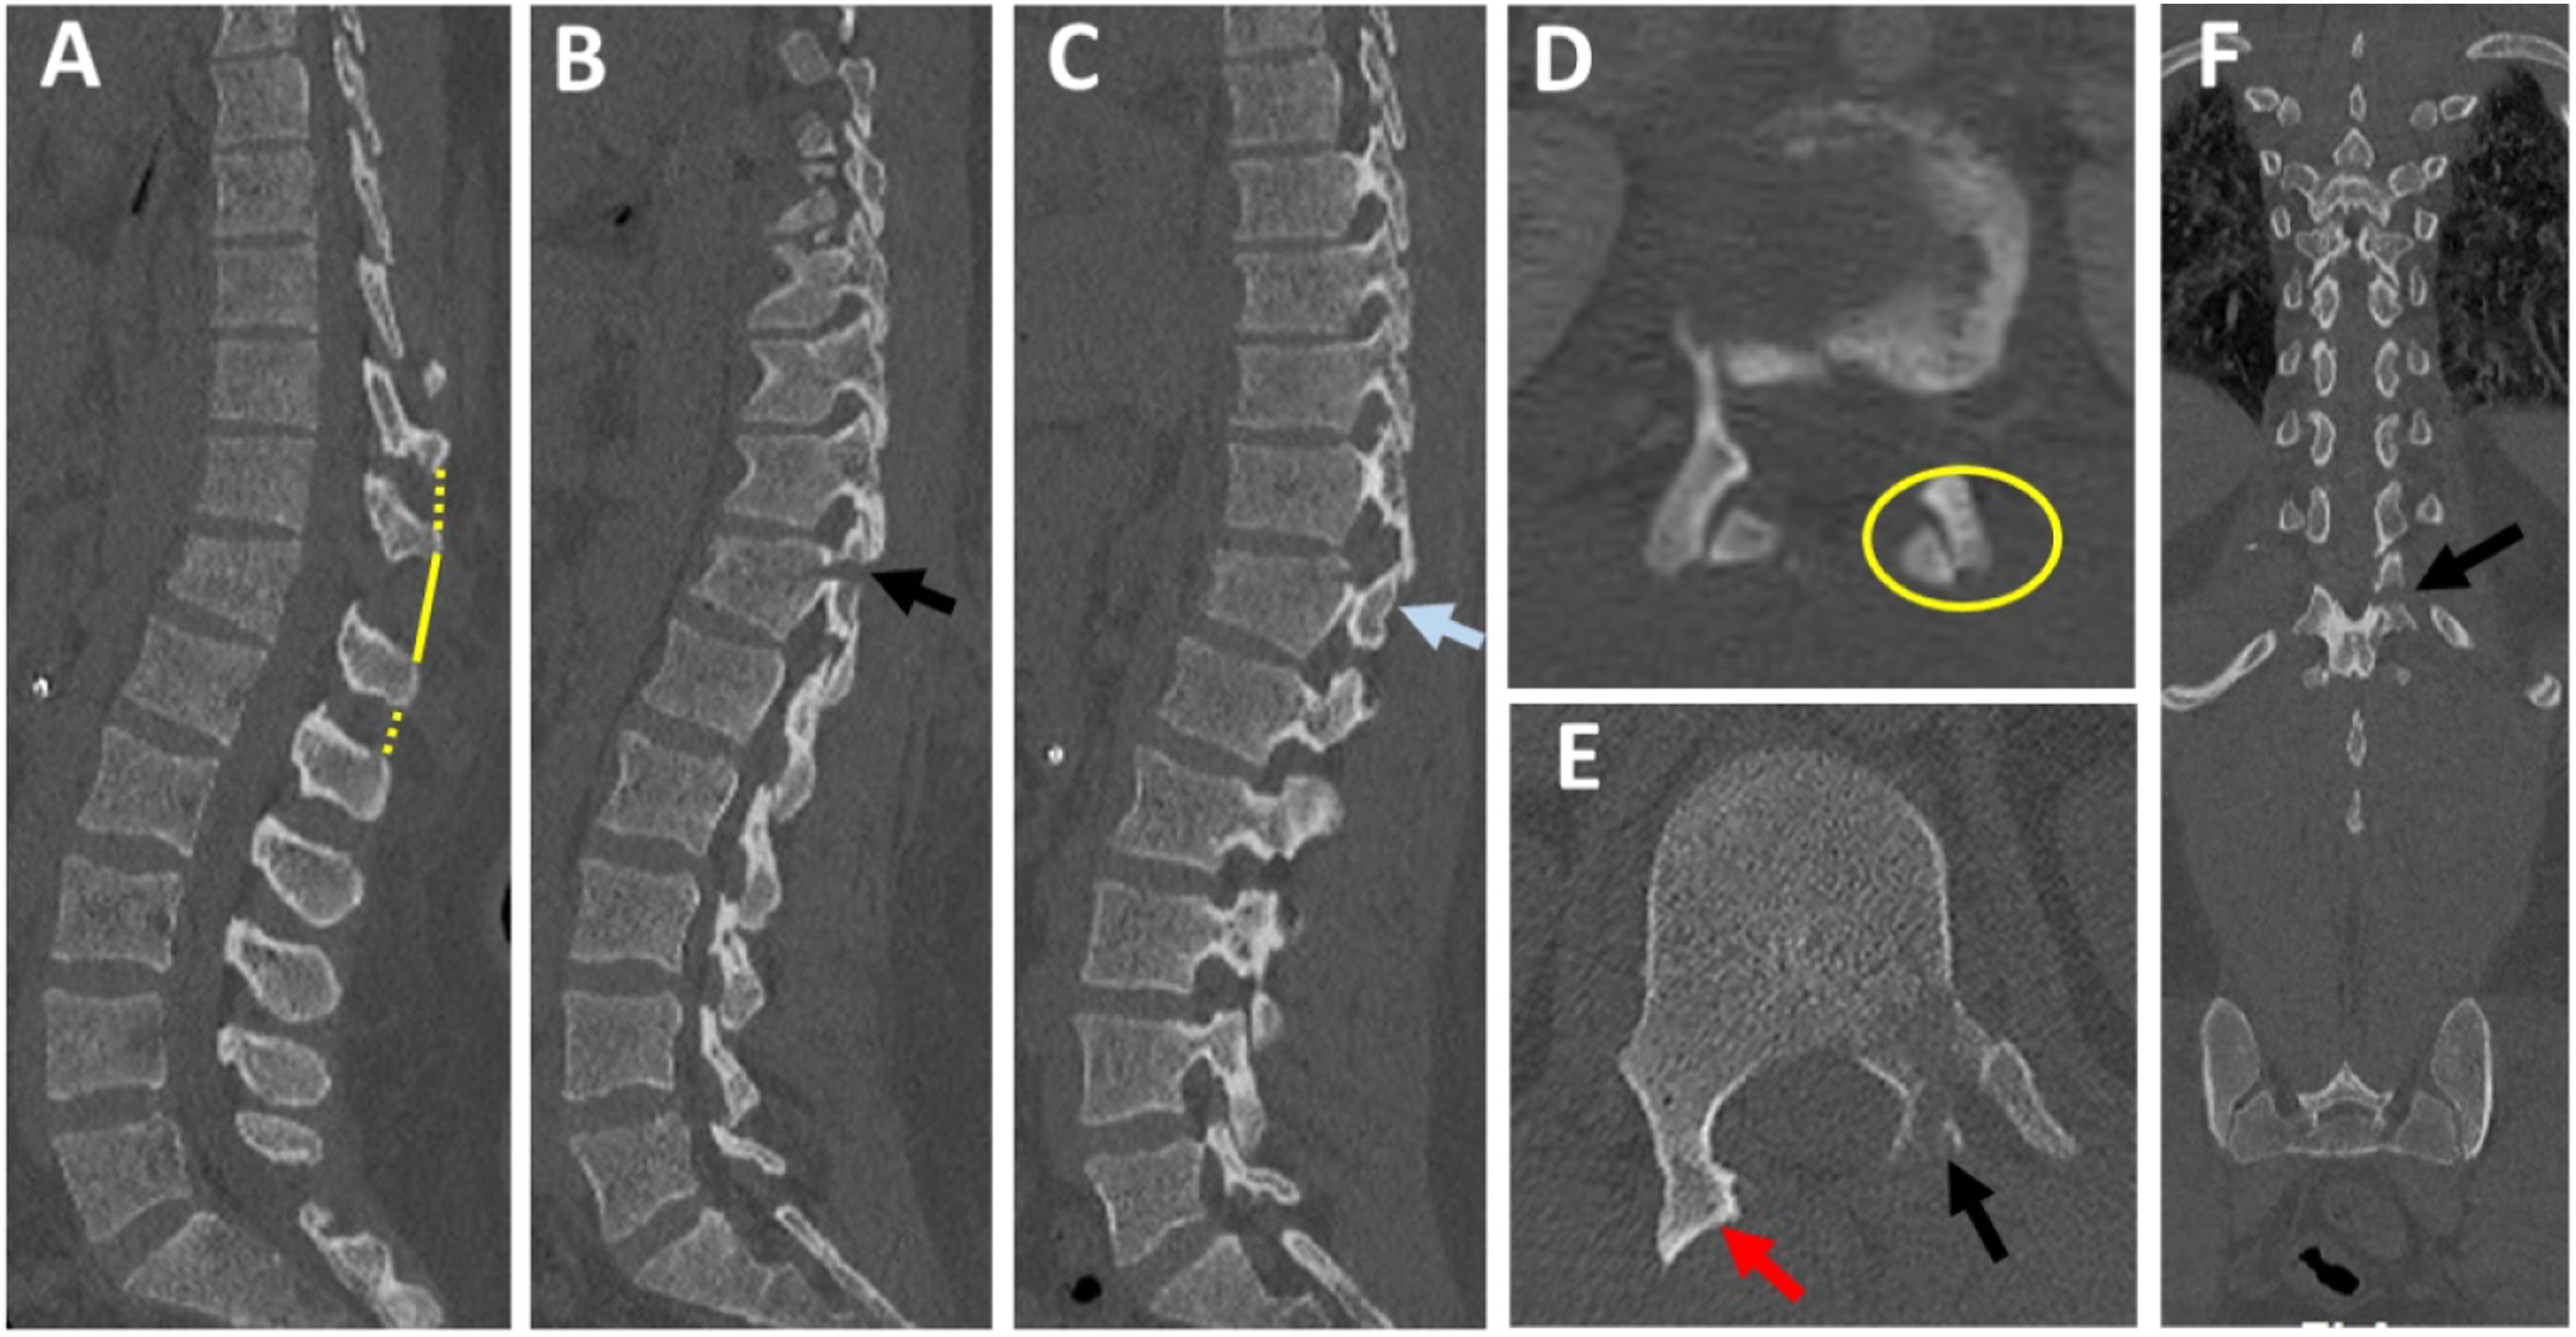
CT and MRI Grading of PLC Injury
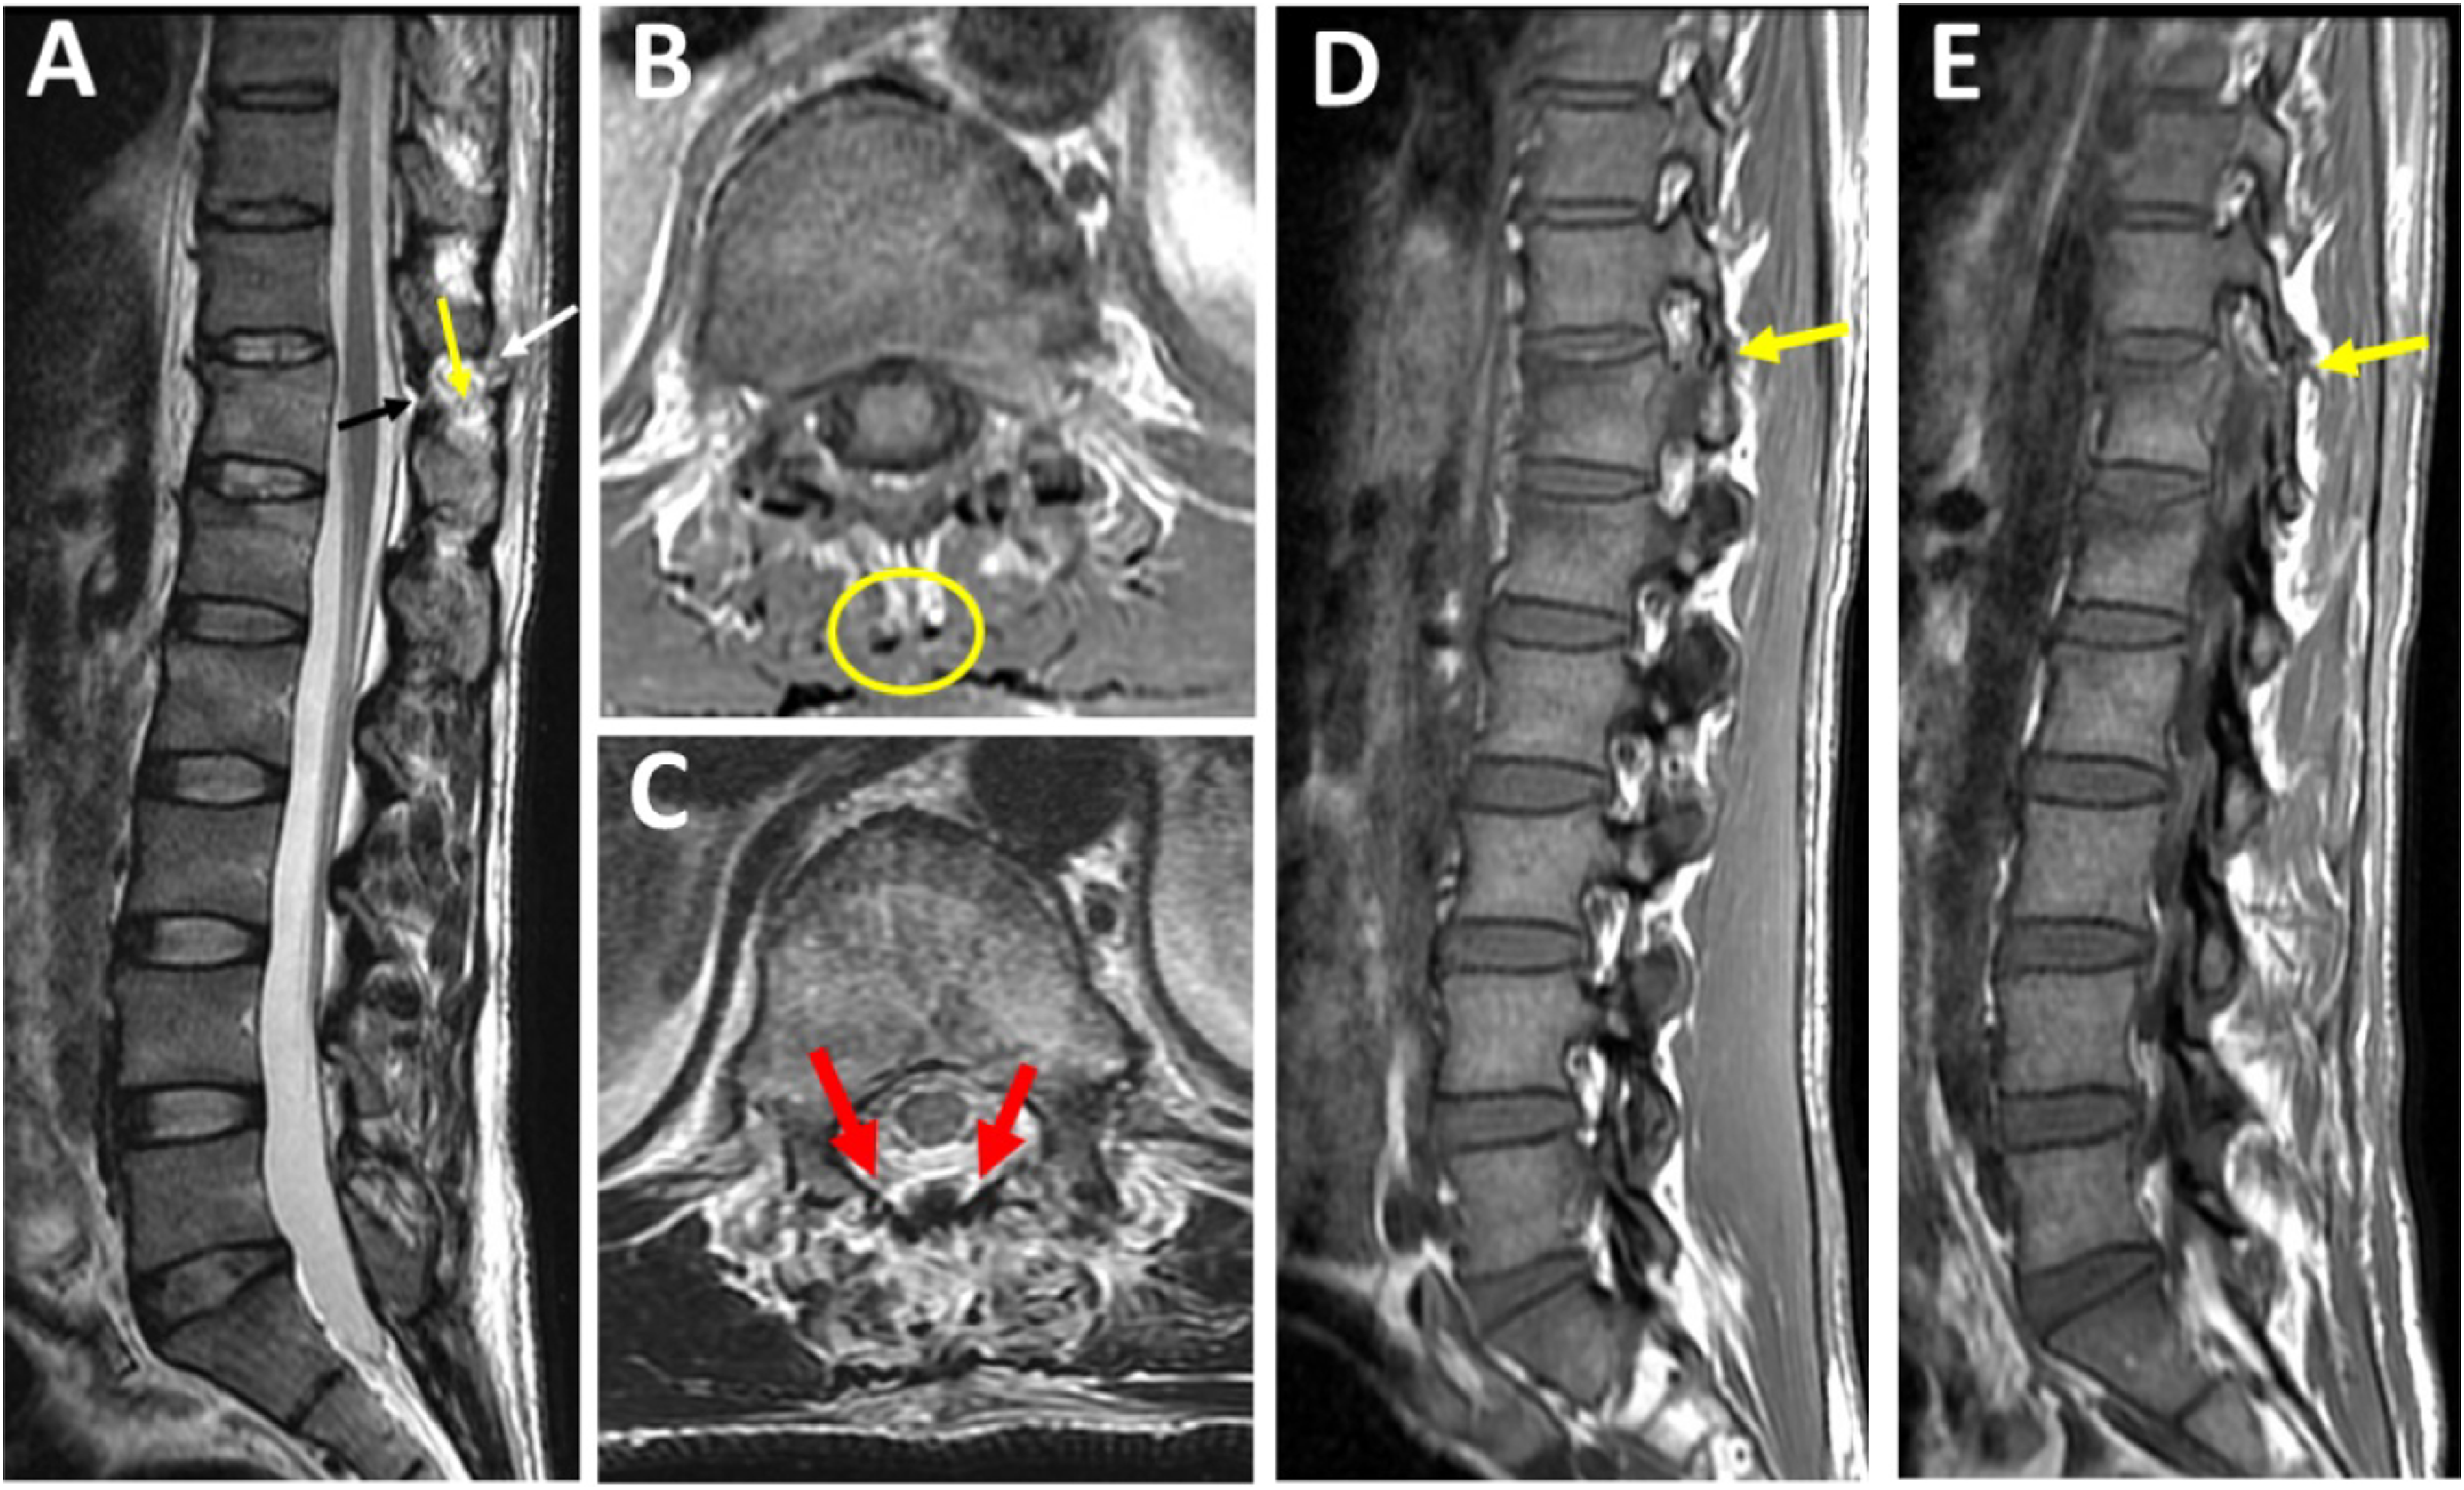
We looked for the following 4 CT signs independently associated with PLC injury:16,15,23 (1) facet joint malalignment (FJM), (2) horizontal fracture of the lamina or pedicle (HLF), (4) avulsion or transverse fracture of the spinous process (SPF), and (5) interspinous distance widening (ISW) >4 mm. (Figure 4E-4H). The number of positive findings on CT was used to classify PLC status as previously described: (1) Disrupted PLC if ≥ 2 positive CT findings, (2) Suspected PLC injury (M1 modifier) if 1 positive CT finding, (3) intact (M0) no positive CT findings.15,16 We graded PLC integrity on MRI as described by Pizones et al: (1) complete disruption, defined as Supraspinous ligament (SSL) or Ligamentum flavum (LF) disruption identified by a discontinuous black stripe; (2) non-disrupted, no MRI signal change or high signal intensity (HSI) due to interspinous ligament (ISL) edema or facet joint effusion (Figure 4A-4D).16,24 Grading of PLC injury in CT and MRI. 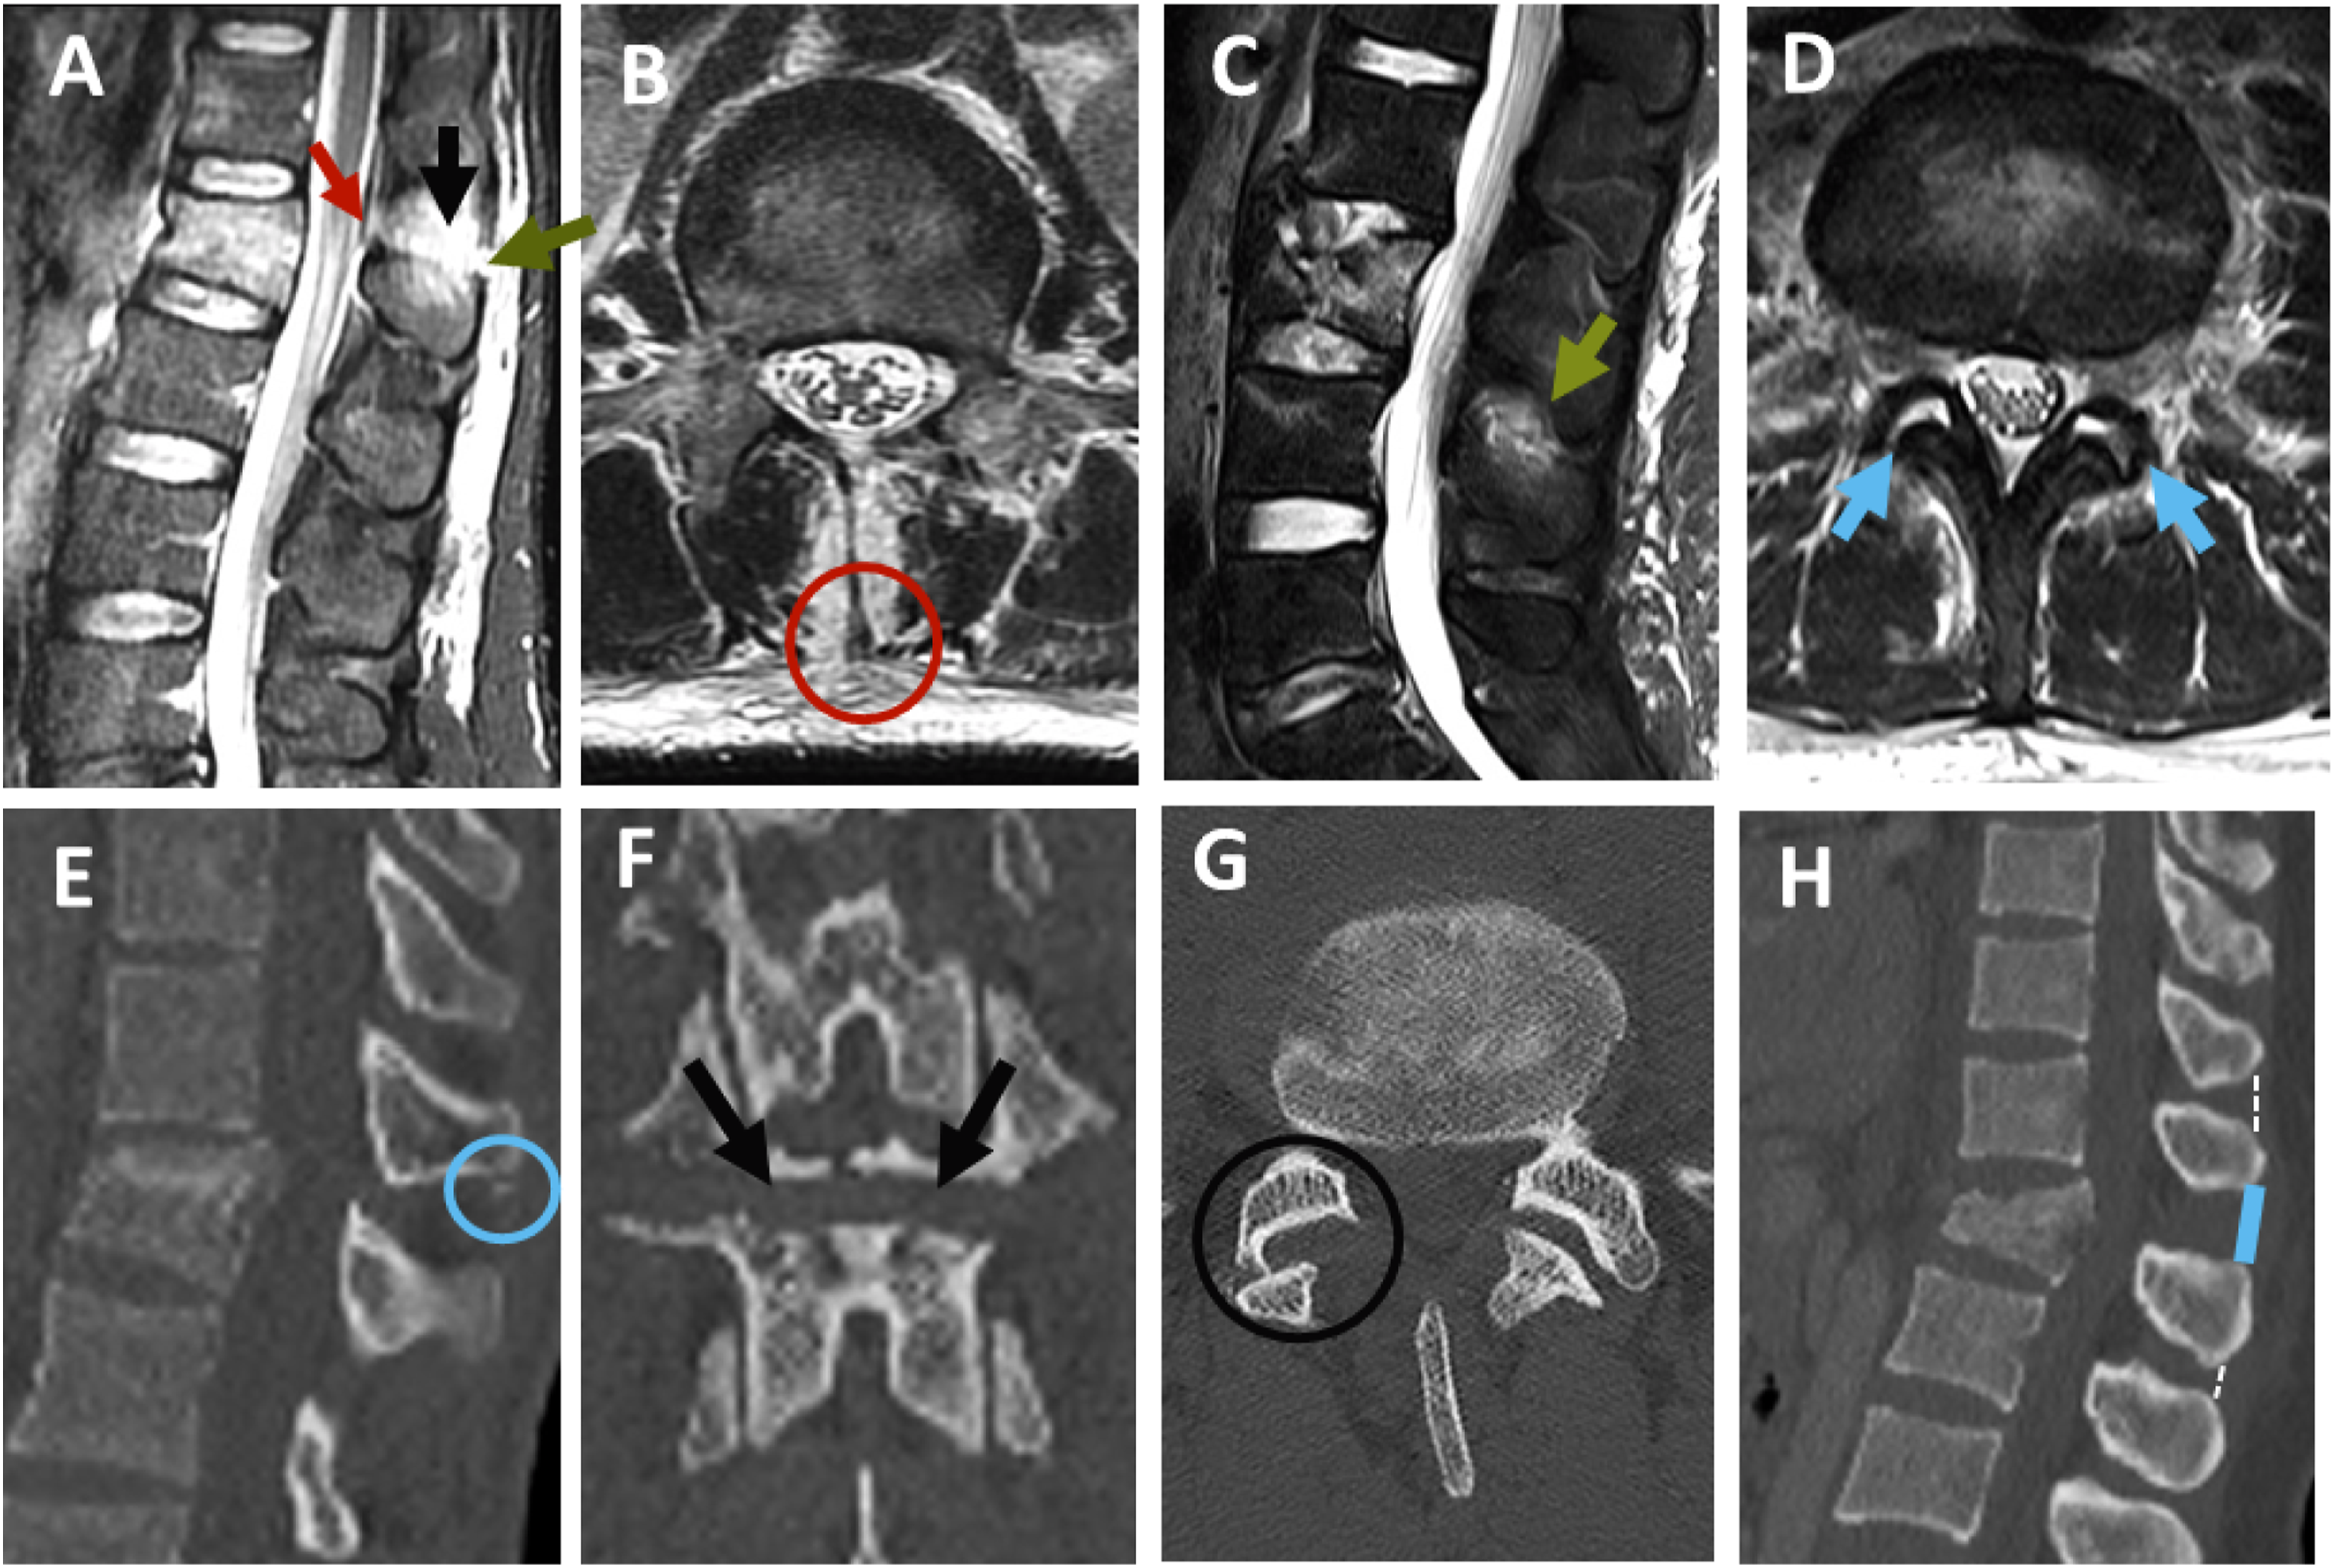
CT and MRI AOSpine Classification and the Thoracolumbar AOSpine Injury Score (TLAOSIS)
We classified all fractures in CT according to AOSpine Classification as follows; (1) type A (compression fracture with no evidence of translation or PLC disruption [intact or suspected PLC injury, ≤1 positive CT finding]; subtypes A1-A4); (2) type B (vertebral fracture with disrupted PLC [≥ 2 positive CT finding]); and (3) Type C (vertebral fracture with evidence of translation/rotation).
4
For type-A fractures, M1 modifier (suspected PLC injury) was defined if a single positive CT finding and M0 if no positive CT findings(Figure 5)4,16 Algorithm for AOSpine classidcation in CT and MRI using our proposed criteria. Abbreviations: HSI, High signal intenisty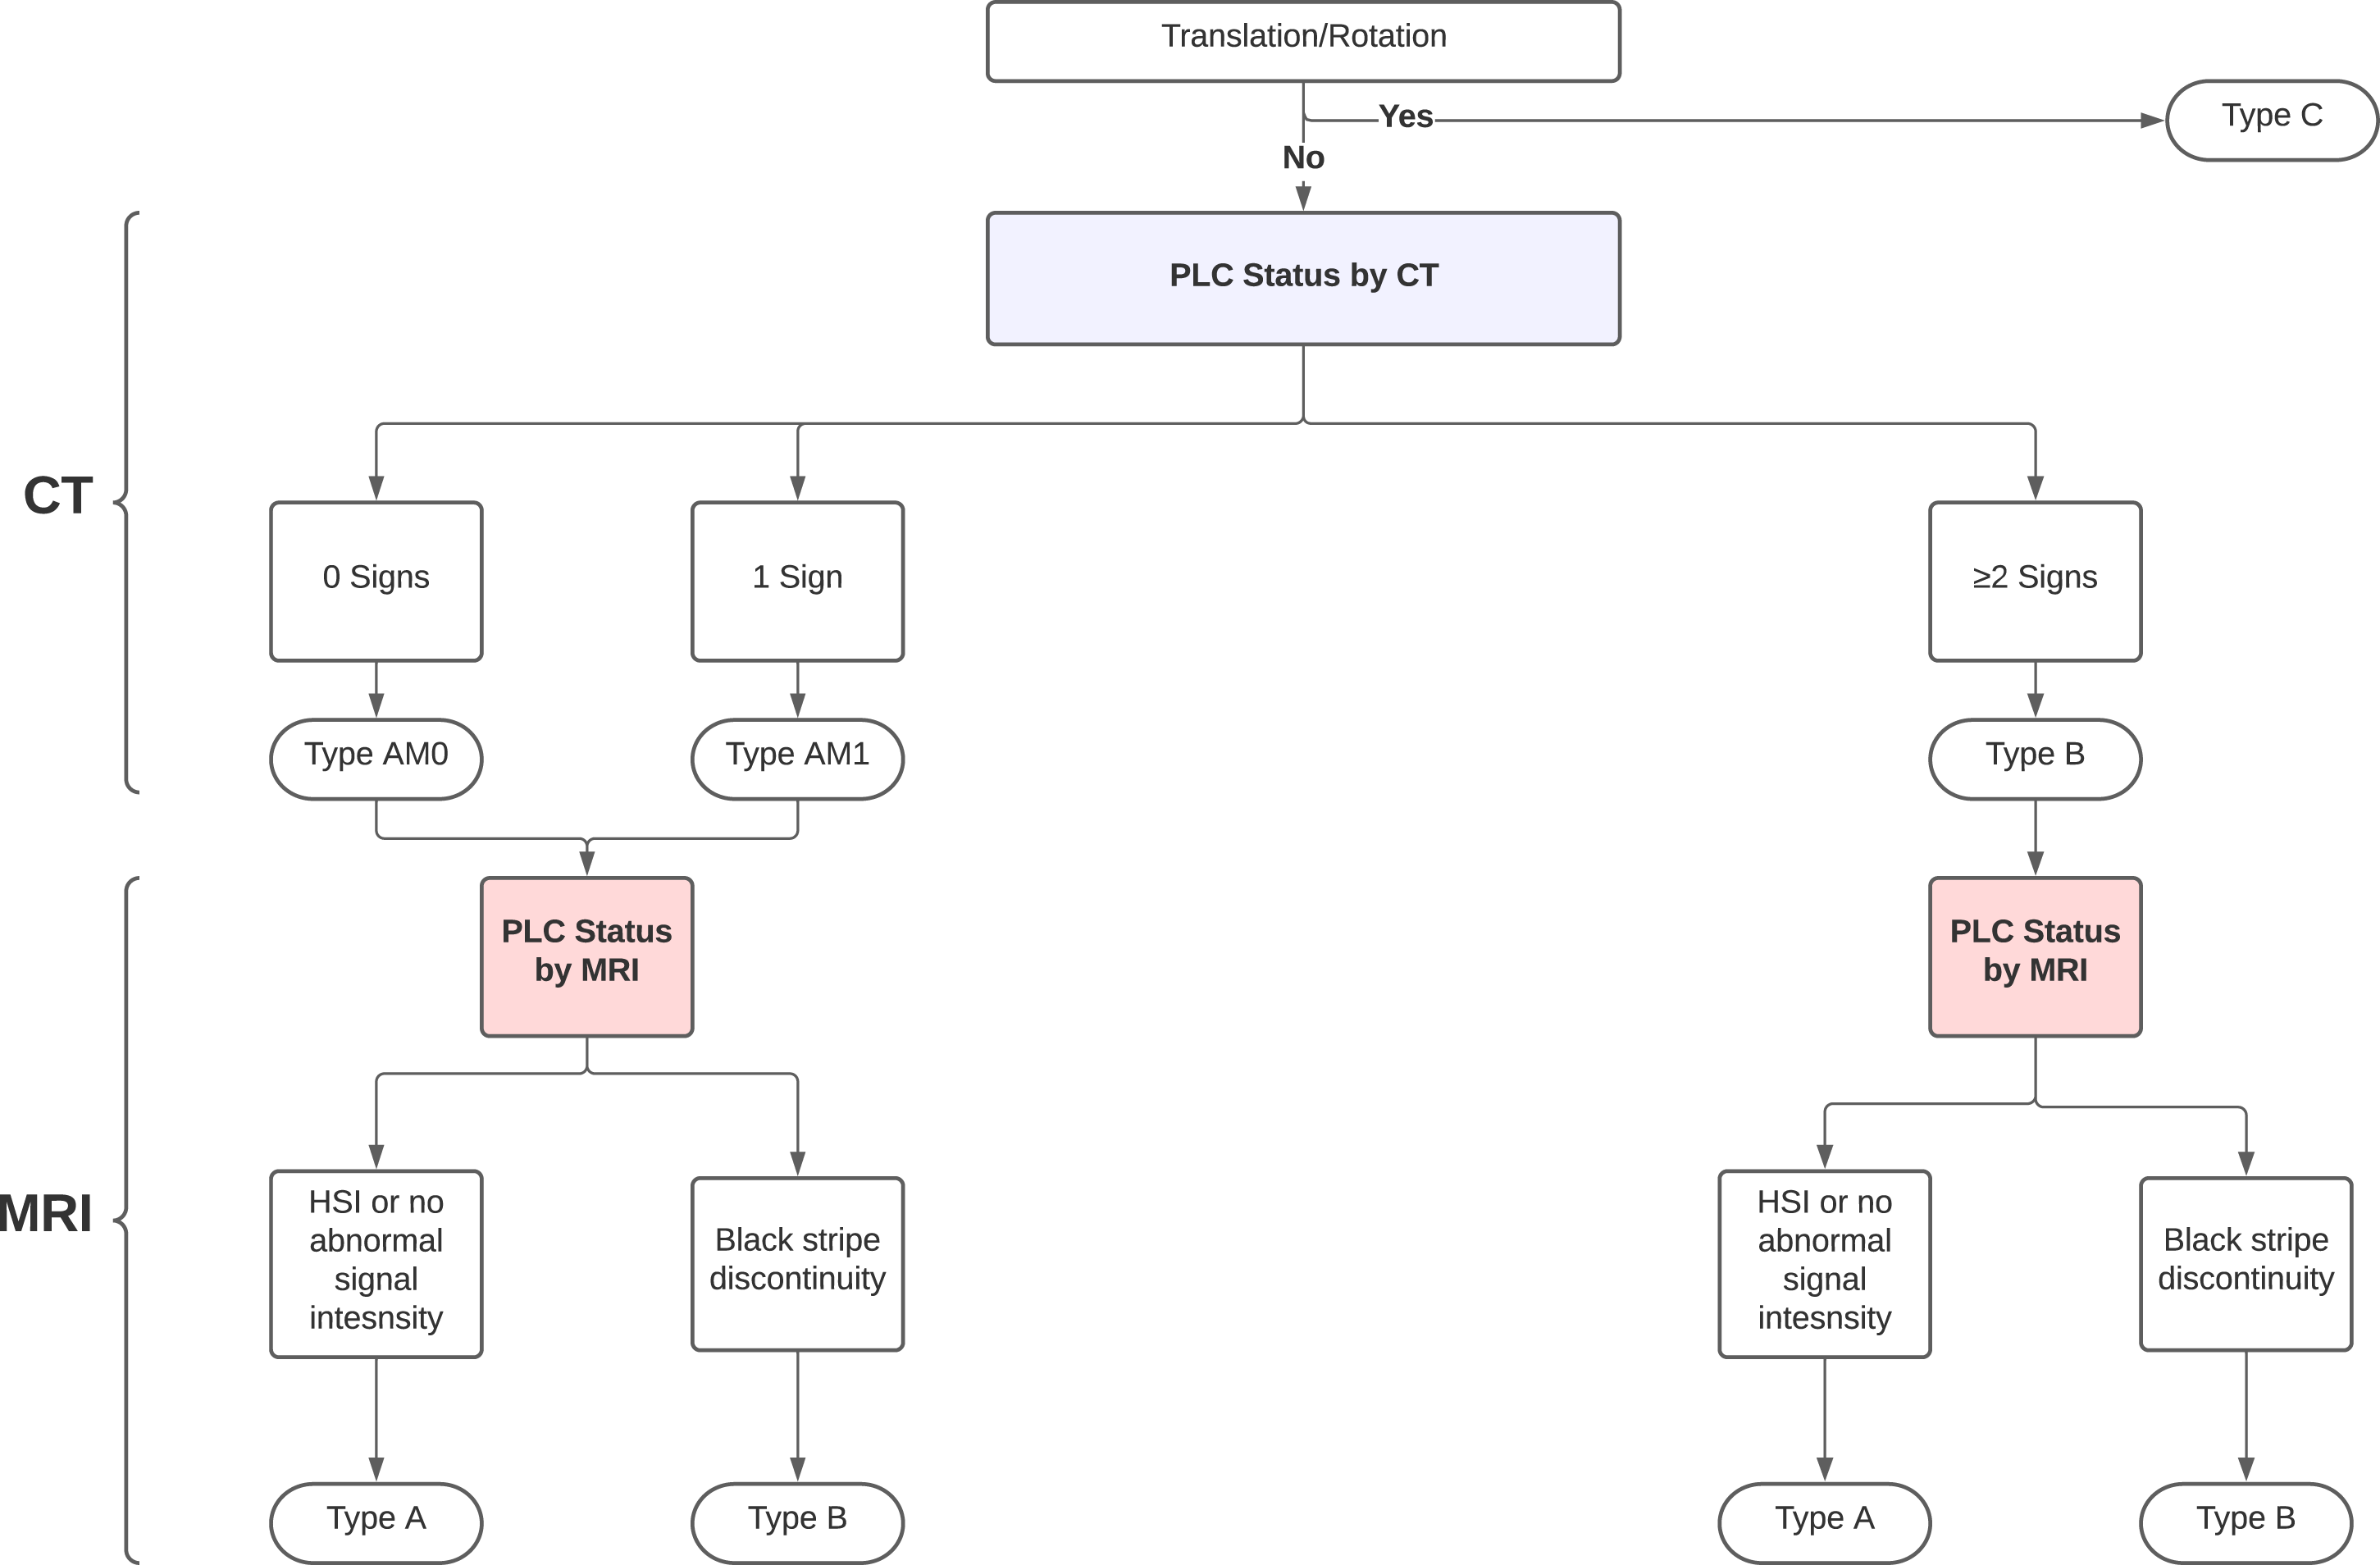
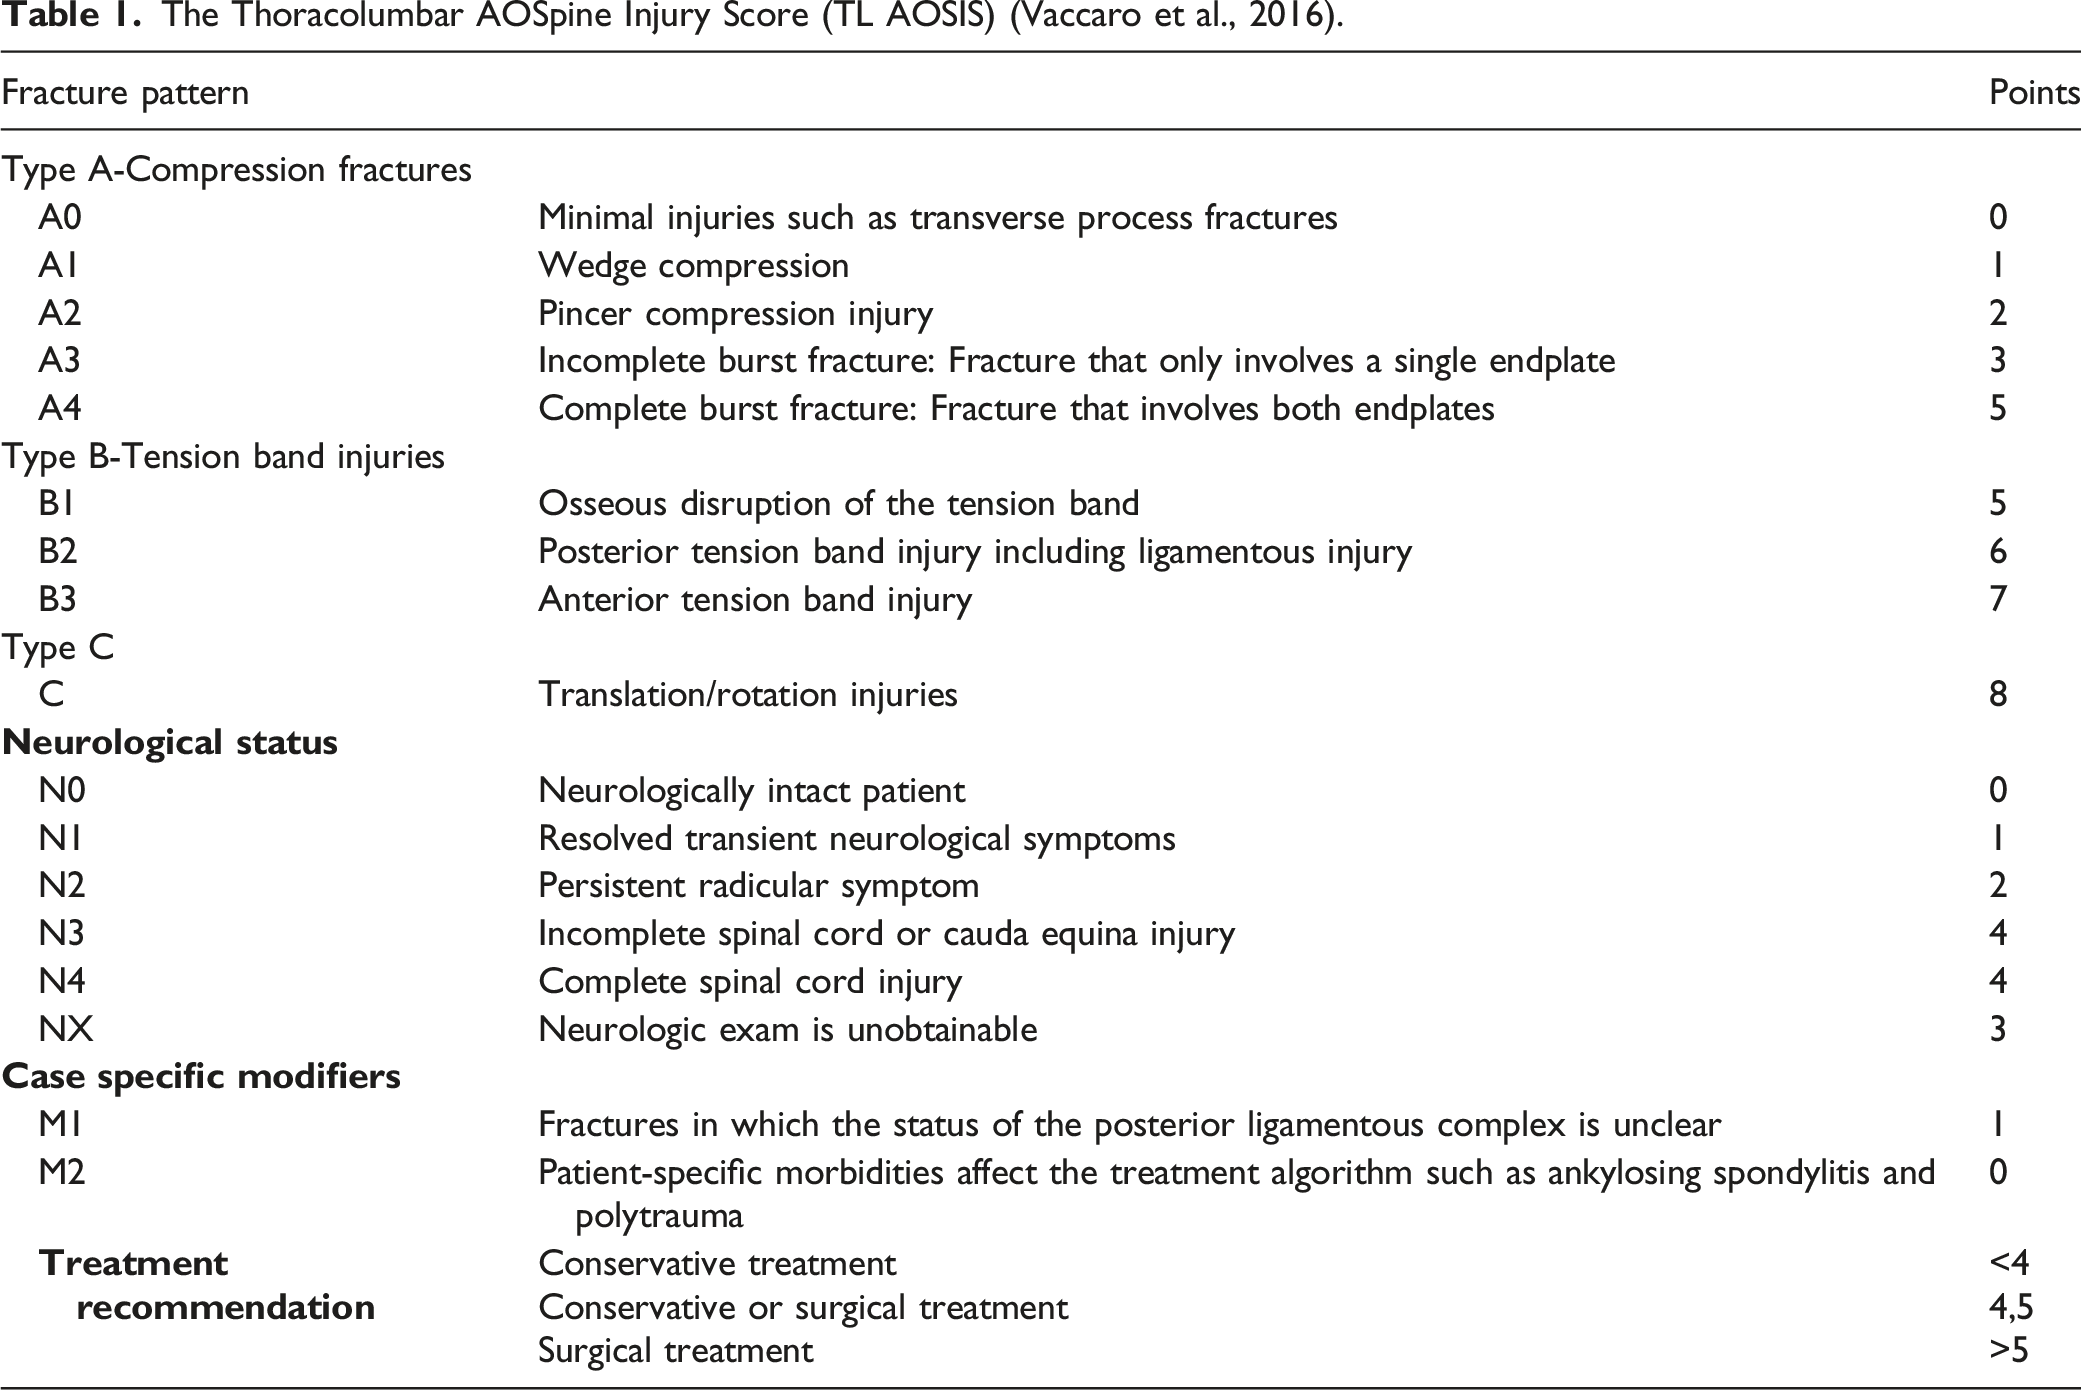
The Thoracolumbar AOSpine Injury Score (TL AOSIS) (Vaccaro et al., 2016).
Statistical Analysis
We used SPSS version 20.0 software (IBM Corporation, Armonk, New York, USA) to conduct statistical analyses with a significance level of P < .05. The difference in the injury characteristic data between patients with and without change in AOSpine classification after MRI was examined using appropriate tests. The McNemar–bowker test was used to assess the difference in the proportions between the 3 main types of AO classification (A, B, C) and patients with TLAOSIS ≤3, 4-5 or ≥5 (indicating the conservative, gray zone, and surgical treatment, respectively). 3 We calculated confidence intervals (CIs) for proportions using Wilson CIs. 9 The default analysis determines the correct accuracy of CT in fracture classification against MRI as a gold standard using the proposed definitions for PLC injury this study: ≥ 2 CT findings and black stripe discontinuity. In comparison, the secondary analysis describes how accurate CT is in fracture classification if we used an alternative definition of PLC injury in CT as any positive CT findings or in MRI as high signal intensity. The results of sensitivity analysis were compared with default analysis to show the impact of CT or MRI criteria for PLC injury on reclassification rate by MRI 22 We applied Fleiss’s kappa coefficient to assess the interreader agreement on the AO classification subtypes (A, B, C)—for CT and MR for 3 or 4 reviewers, respectively. We also used Cohen’s kappa (k) statistic to assess the interareader agreement on the AO classification for CT and MRI. The kappa values can be interpreted as follows: ≤.2 = slight agreement, .21-.4 = fair agreement, .41-.6 = moderate agreement, .61-.8 = substantial agreement, .81-.99 = almost perfect agreement, and 1.0 = perfect agreement. 25
Sample Size Calculation
We based the sample size calculation on the tables from Bujang et al. 26 With a PLC prevalence of 50% in our center, a null hypothesis (H0) of sensitivity for the current test of approximately 50% (the expected alternative hypothesis is to obtain a higher sensitivity of up to 70% with the combined test) and 80% power, the required sample is 98 per outcome group for a total of 196 patients. 26
Results
Baseline Demographics and Injury Characteristics
Baseline demographic and injury characteristics of the study patients.
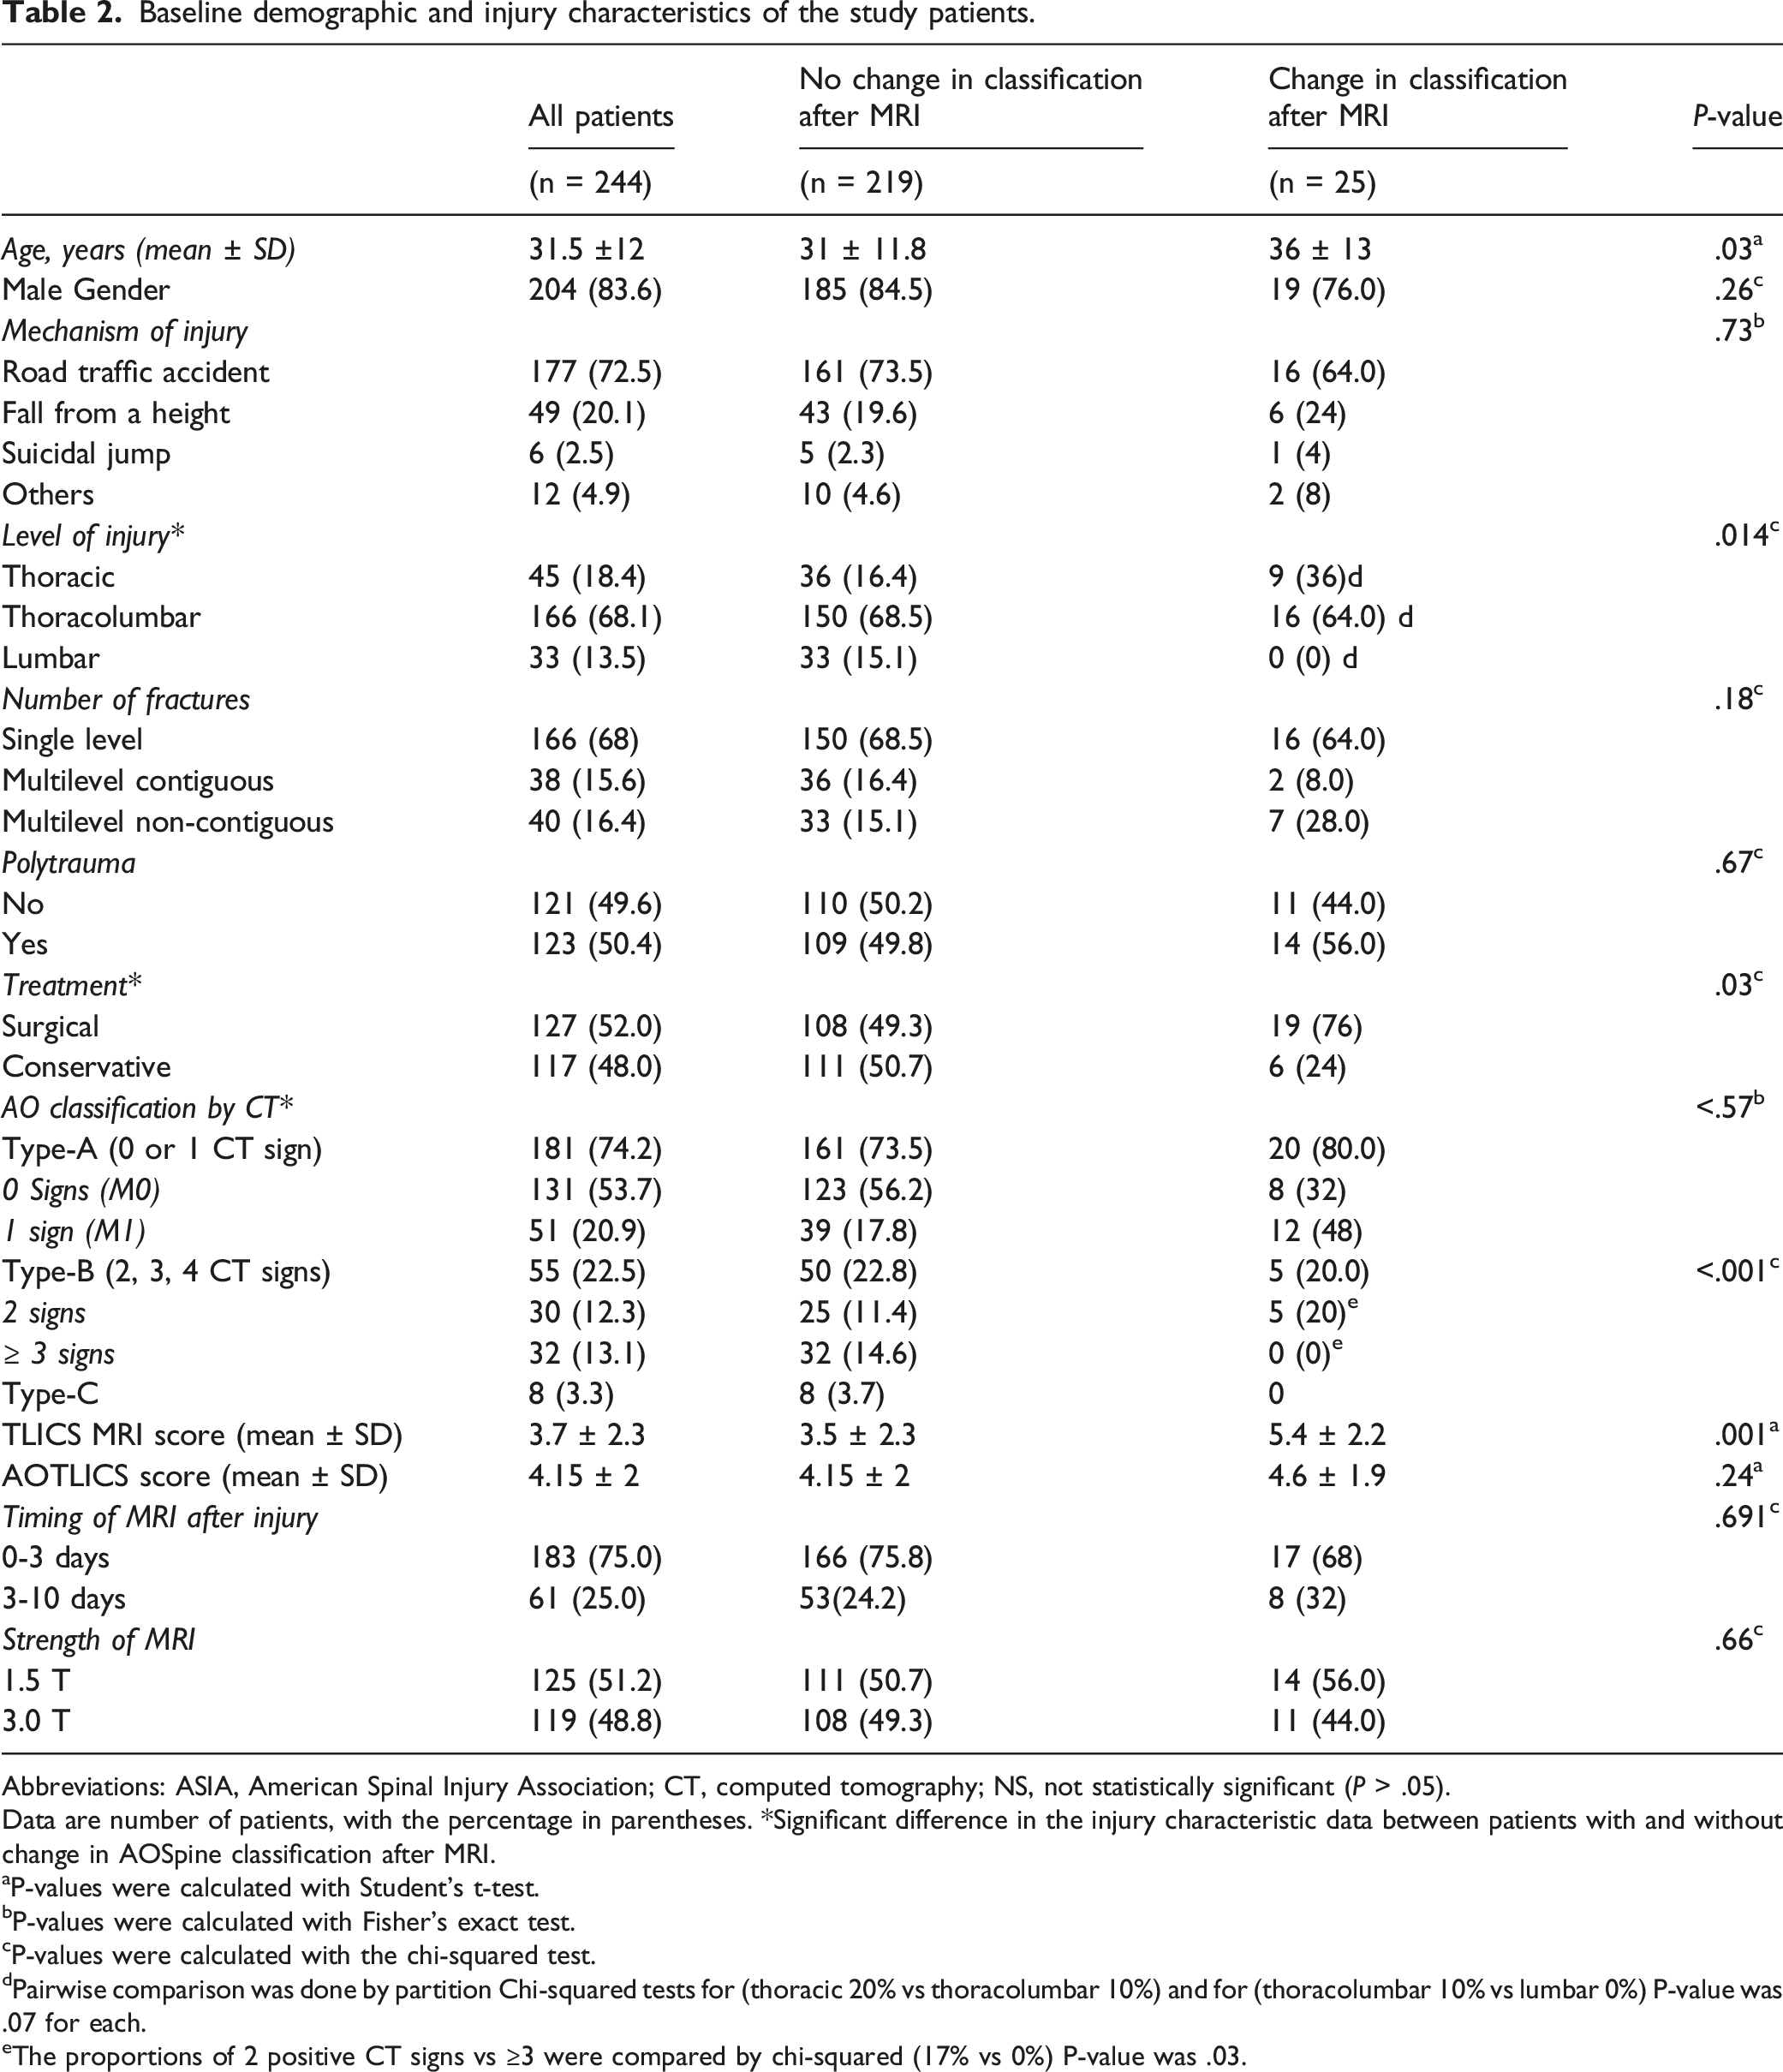
Abbreviations: ASIA, American Spinal Injury Association; CT, computed tomography; NS, not statistically significant (P > .05).
Data are number of patients, with the percentage in parentheses. *Significant difference in the injury characteristic data between patients with and without change in AOSpine classification after MRI.
aP-values were calculated with Student’s t-test.
bP-values were calculated with Fisher’s exact test.
cP-values were calculated with the chi-squared test.
dPairwise comparison was done by partition Chi-squared tests for (thoracic 20% vs thoracolumbar 10%) and for (thoracolumbar 10% vs lumbar 0%) P-value was .07 for each.
eThe proportions of 2 positive CT signs vs ≥3 were compared by chi-squared (17% vs 0%) P-value was .03.
Change in the Highest AO Classification After MRI
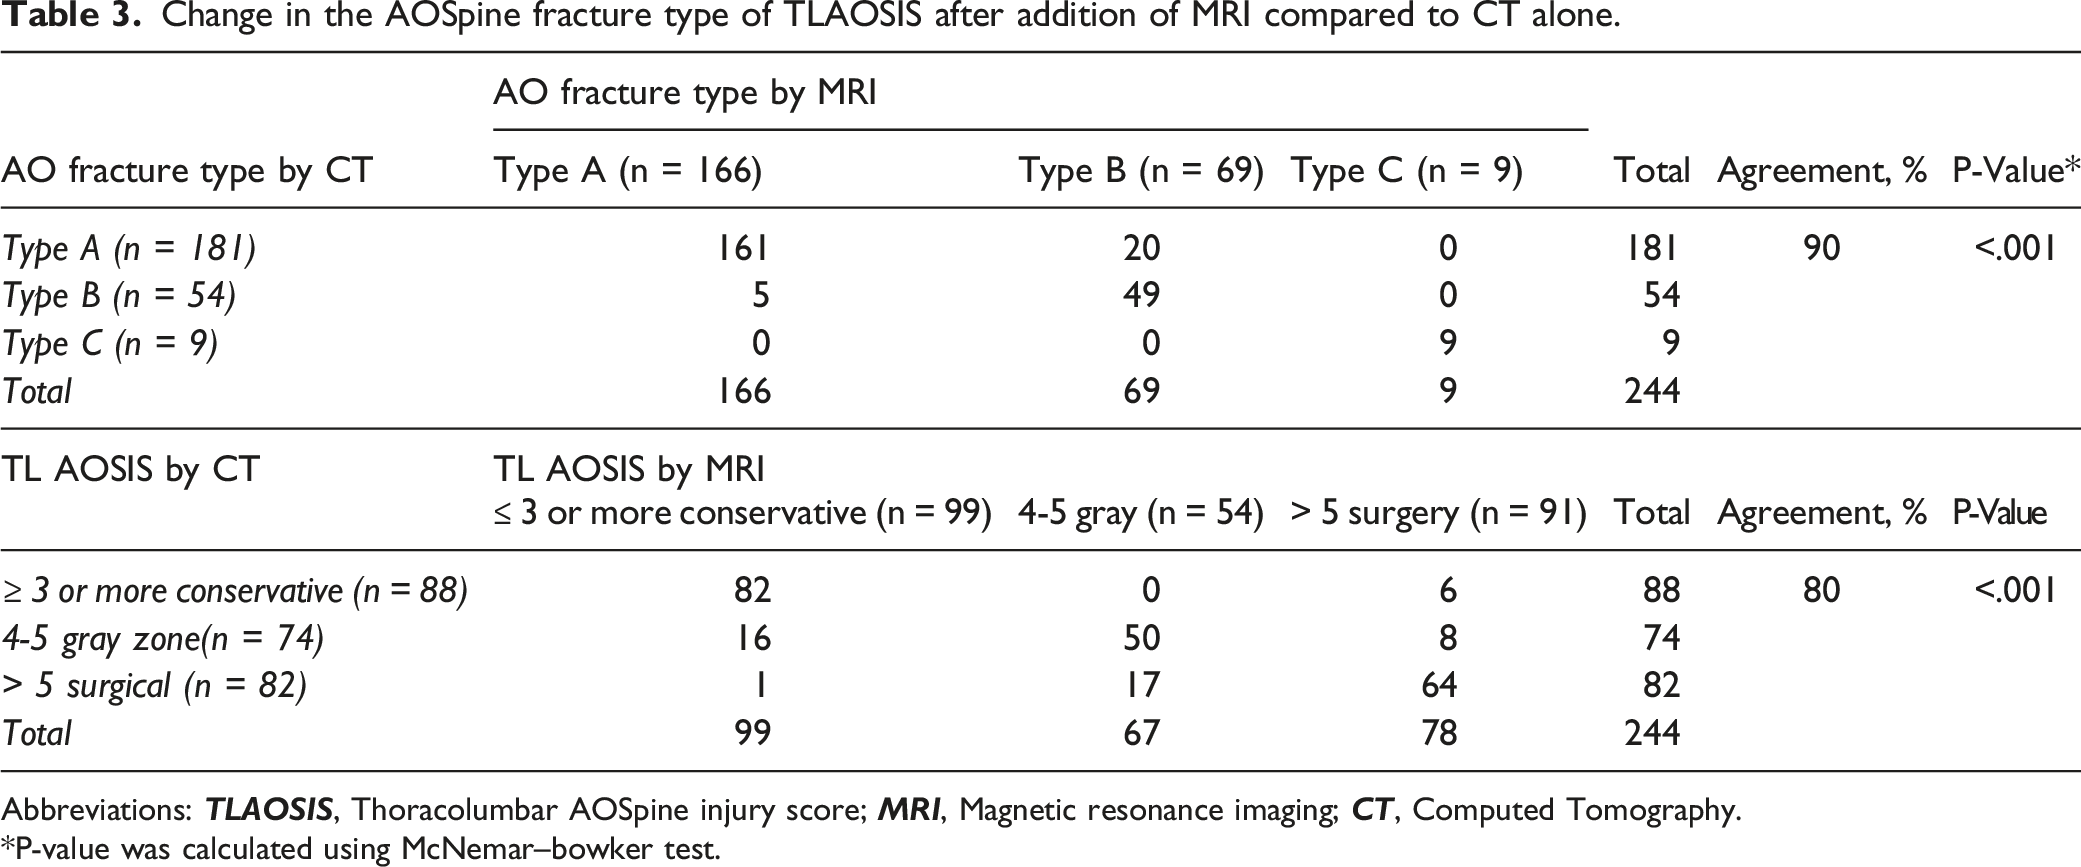
Change in the AOSpine fracture type of TLAOSIS after addition of MRI compared to CT alone.
Abbreviations:
*P-value was calculated using McNemar–bowker test.
Change in the Thoracolumbar AOSpine Injury Score After MRI
The TL AOSIS by CT was ≤3 in 88 patients (36%), 4-5 in 74 patients (30%), and >5 in 82 patients (34%; Table 3). The overall McNemar-bowker test was significant indicating high agreement up to 86%. The addition of MRI changed TL AOSIS among the 3 treatment recommendation groups in 35/244(19.7%, 95% CI [14.9%-25.2%]. The addition of MRI changed TL AOSIS from ≤3 to >5 in 6/88 patients (6.8%, 95% CI [2.5%-14.2%], P < .0001), from >5 to ≤3 in 1/82 patients (1.2%, 95% CI [.04%-6.2%], P = .85) or >5 to 5 in 17/82 patients 20.7%, 95% CI [12.6%-31.0%, P < .001 ]. In patients with TL AOSIS 4 or 5, the addition of MRI changed TLAOSIS to >5 or <3 in 24/74 patients (32.4%, 95% CI [22%-44.3%], P < .0001).
Secondary (Sensitivity) Analysis
The default analysis (Figure 6A) shows that CT was accurate in fracture classification compared to MRI in 90% of cases, leading to a change in fracture classification by MRI in 10%. The results of the secondary analysis are described in Figure 6B and 6C. When using any positive CT findings as criterion for PLC Injury, CT’s accuracy dropped to 68%, and MRI changed classification by 32%, P < .0001). When using or MRI criterion as high signal intensity, the CT’s accuracy dropped to 79%, and MRI changed classification by 21, % P < .0001). Sensitivity analysis showing the impact of alternative CT/MRI criteria for PLC injury on the rate of fracture reclassification after MRI. 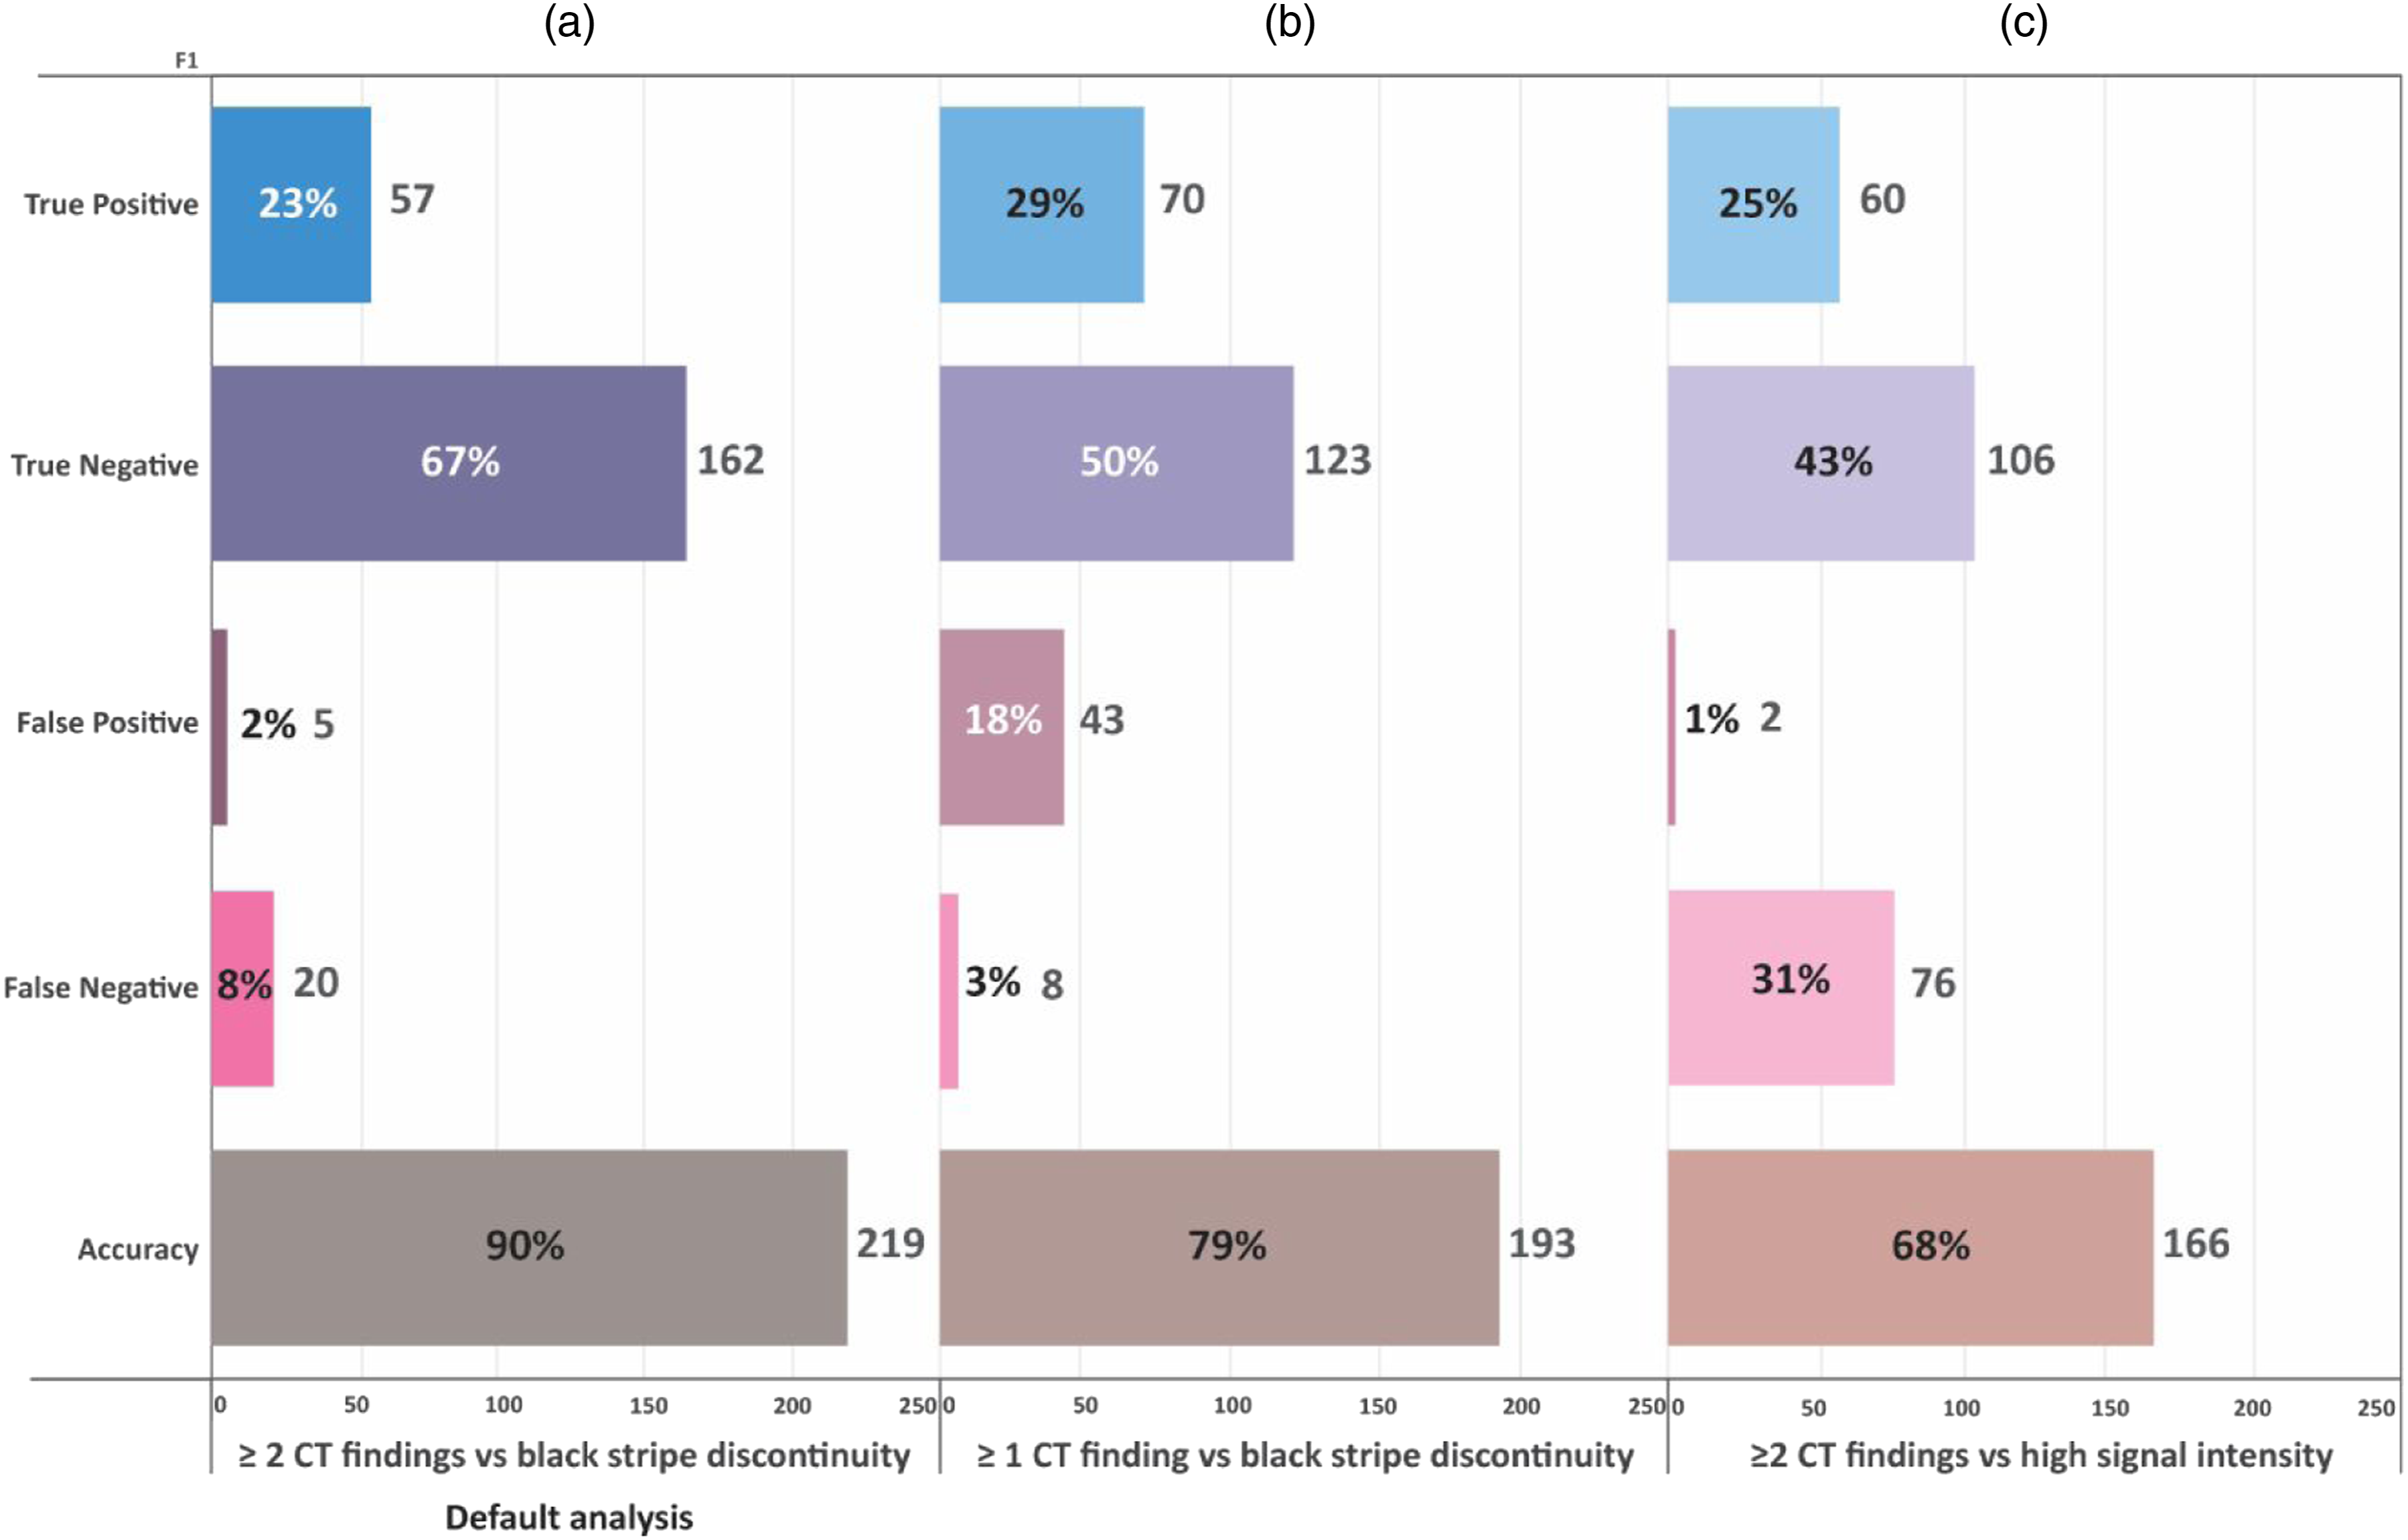
Predictors of Change in TLFs Classification by MRI
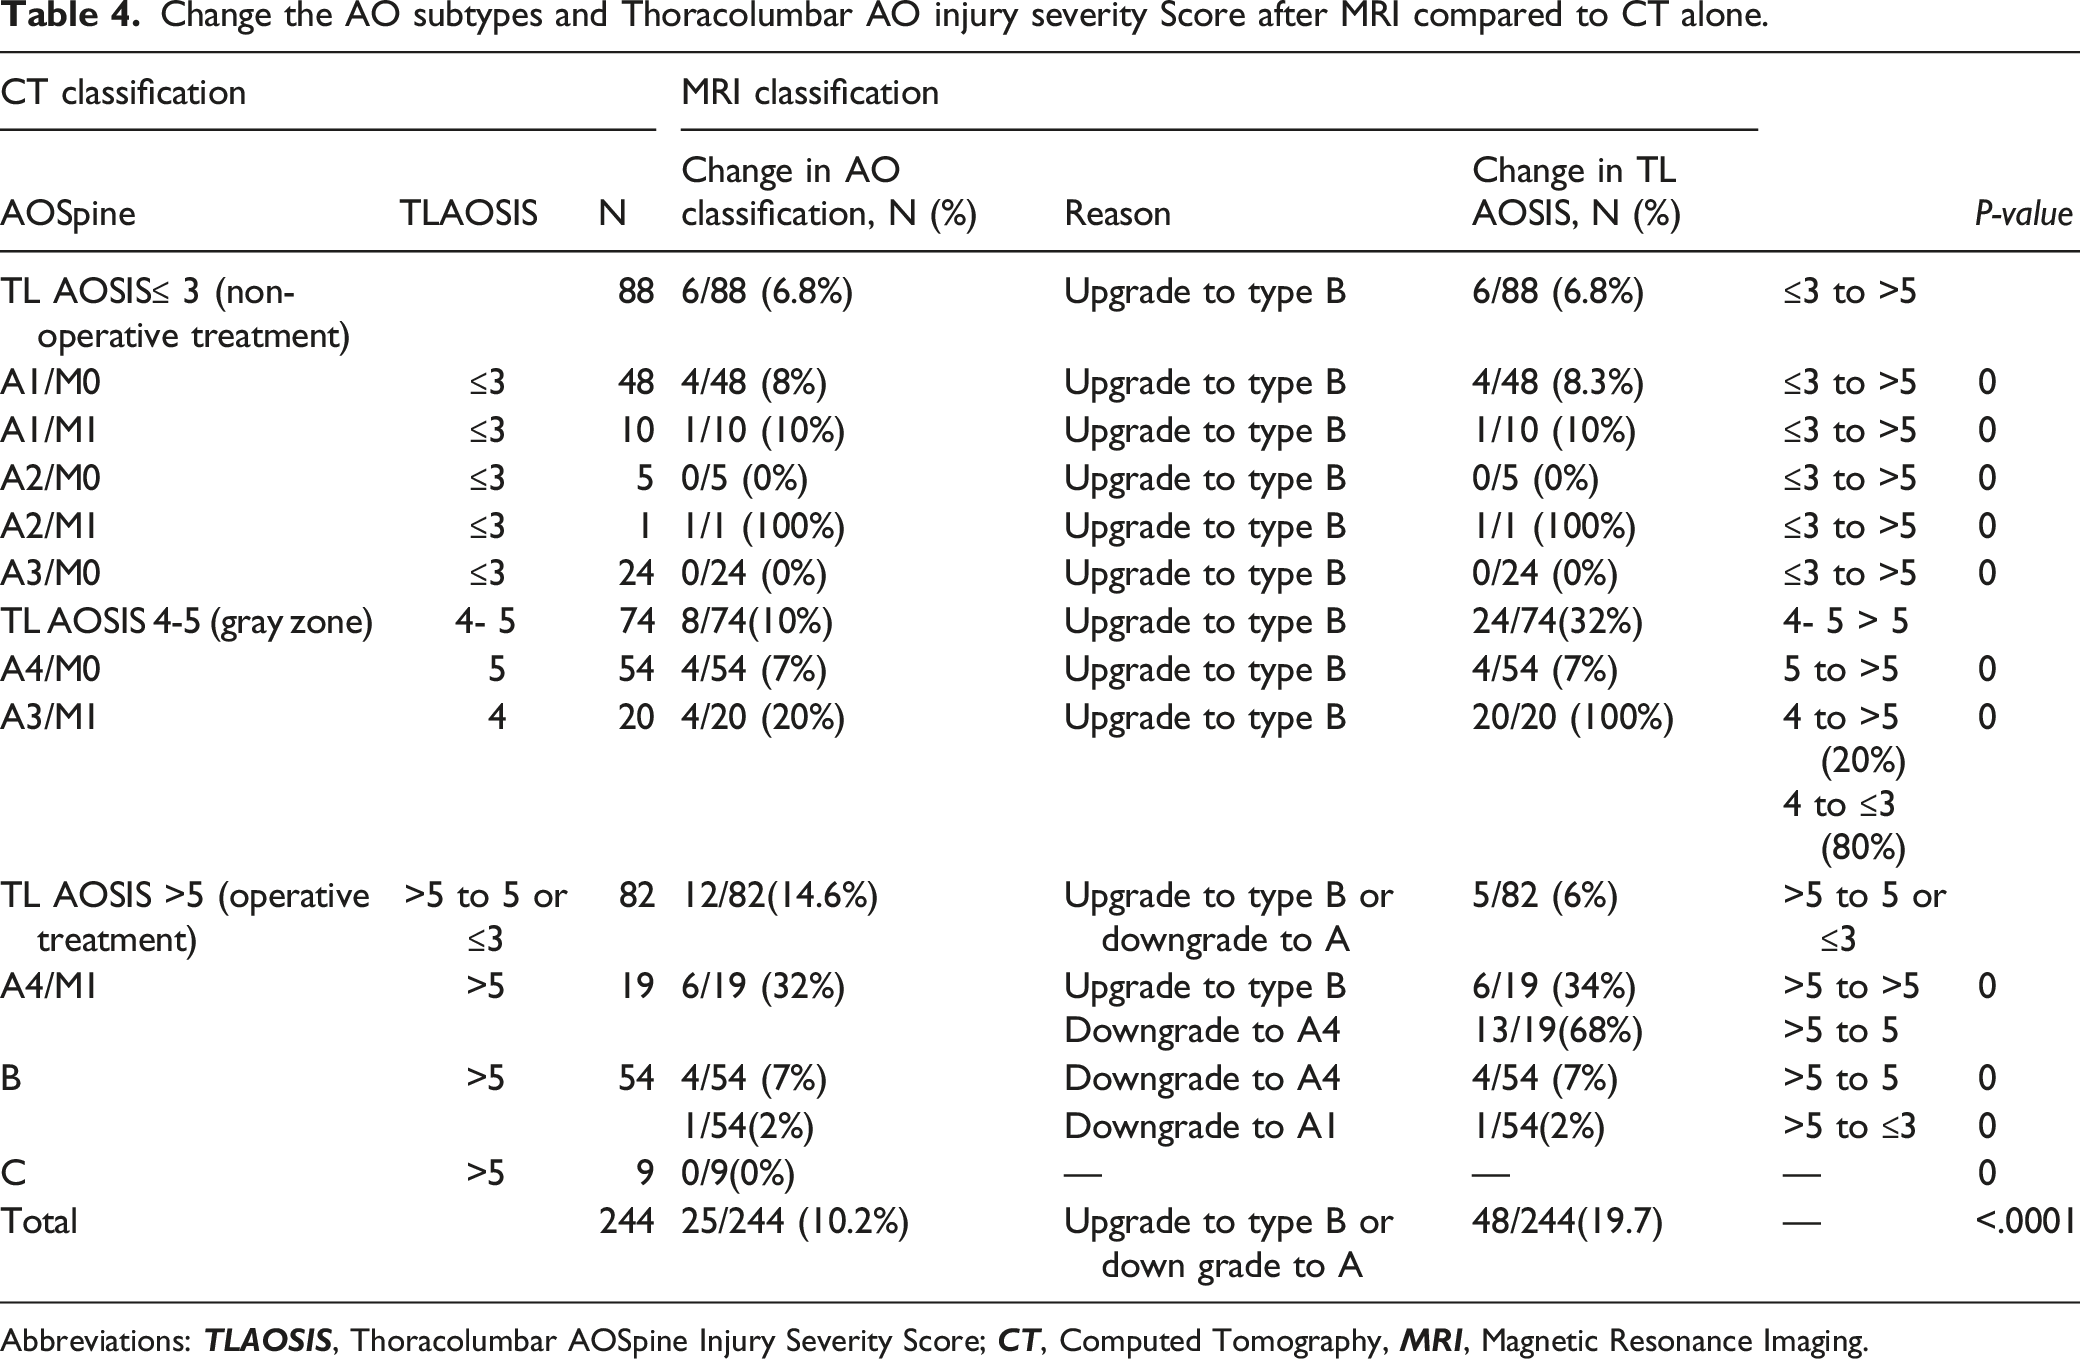
Change the AO subtypes and Thoracolumbar AO injury severity Score after MRI compared to CT alone.
Abbreviations:
Long-Term Follow-up of Patients With Change AOSpone Classification After MRI
Of the 25 patients with fracture reclassification by MRI,19 (76%) were treated surgically, while the remaining 6 (24%, Figure 7) patients were treated non-operatively. Of the 6 patients treated conservatively, 1 required surgery for posttraumatic kyphosis, 3 had significant back pain, and two were symptom-free at the latest follow-up (20-45 months). Follow-up data from 25 fractures with change in AOSpine fracture classification after MRI. 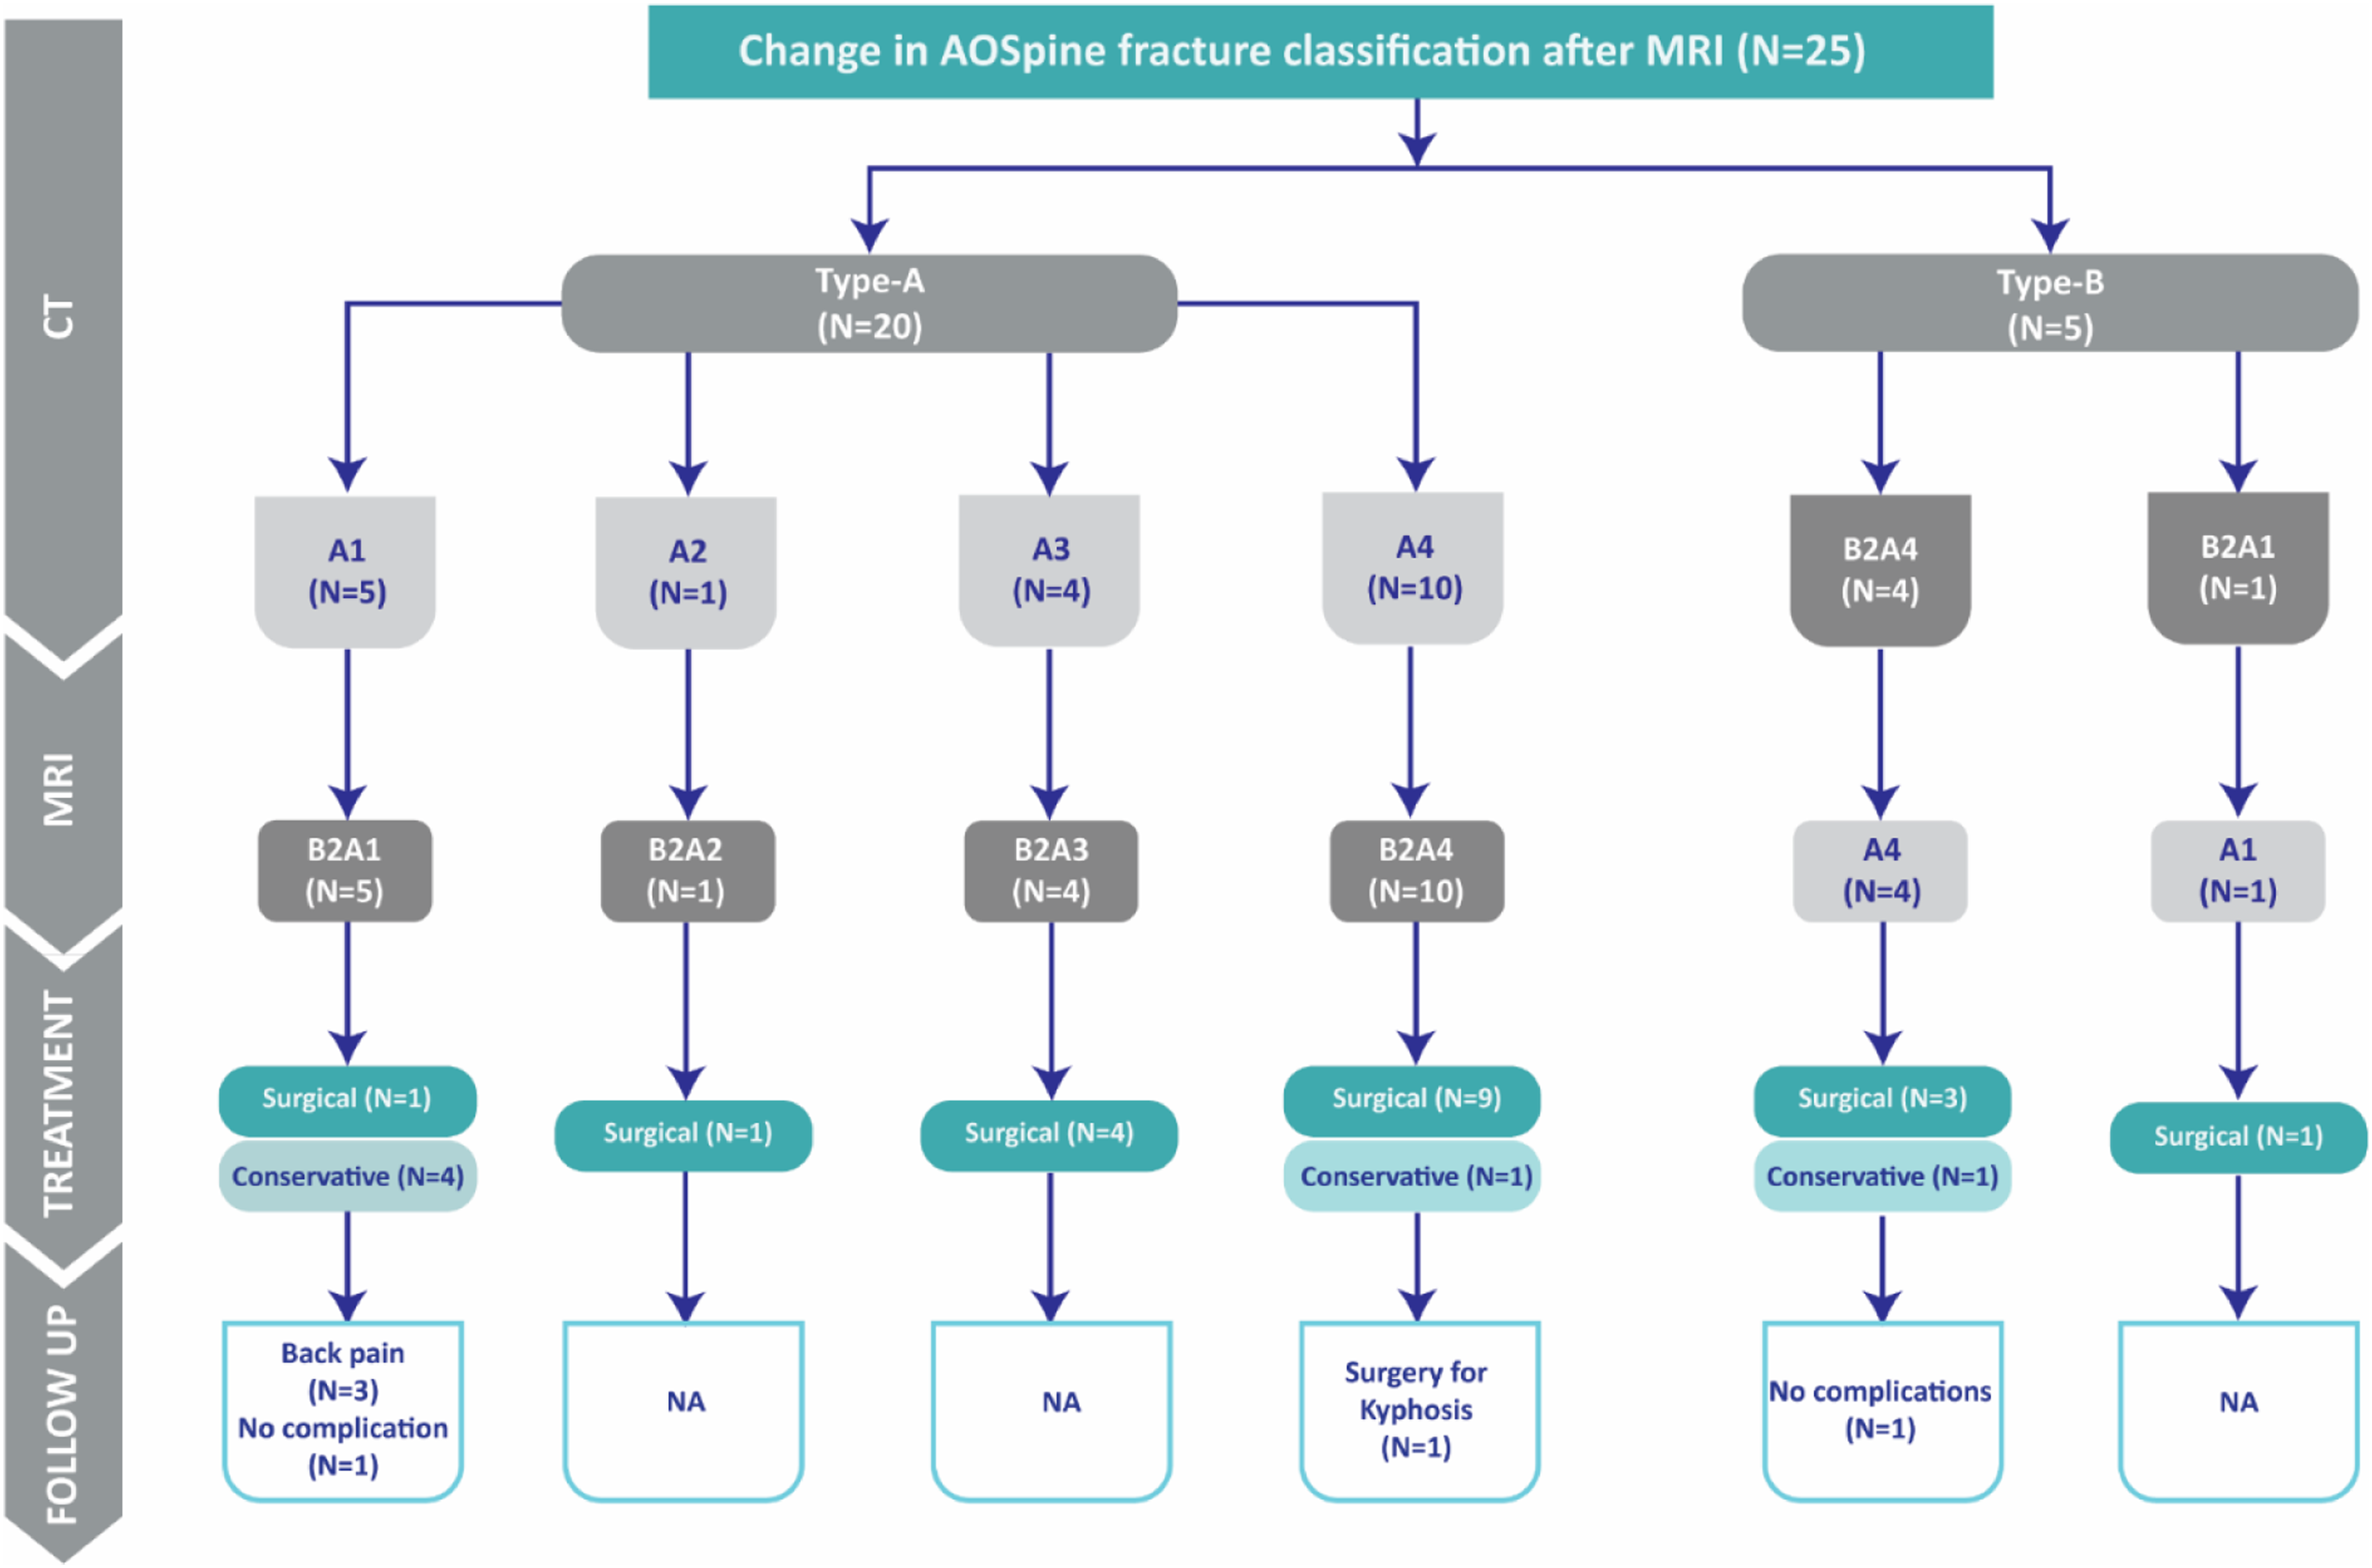
Inter- and Intrareader Agreement on CT and MRI Classification
The intrareader agreement on CT and MRI classification (AO type A vs B vs C) were almost perfect (Cohen k = .86, and .89). The inter-reader agreement on CT classification was almost perfect (Fleiss k = .84, whereas MRI classification was substantial (Fleiss k = .65). 25
Discussion
To the best of our knowledge, this is the largest study (n = 244) to date that examines the impact of MRI on TLFs classification compared to CT alone. 7 This study concludes a relatively low rate of 10.2% for TLFs reclassification by MRI due to an upgrade from type A to B (8.2%) or downgrades from type B to A (2%).8,9 MRI changed the TLOASIS among the 3 treatment’s recommendation categories (≤3, 4-5, >5) in 48/244 (19.7%) patients. The presence of a single positive CT finding was the best predictor of an upgrade from type A to type B (26% vs 4.6%, P < .0001), whereas type-B fractures with only 2 positive CT findings, rather than 3 or more, was the best predictor for a downgrade from type B to type A (17% vs 0%, P = .03).
The significantly lower rate of TLFs' reclassification by MRI reported here (10.2% vs 30% previously) could be explained by the differences in sample size, patient population, and the CT/MRI criteria for PLC injury.7,8 Our study is the first to analyze the impact of MRI on TLF’s classification employing the new AO classification (rather than the Megrel classification), which is known for its simplicity and improved inter-reader reliability.4,8,9 This study eliminated the previously observed MRI misclassification bias when PLC injury was identified on MRI using HSI, despite this criterion’s low specificity for identifying PLC injuries during surgery.12-21 Instead, we identified PLC injury in MRI as black stripe discontinuity caused by SSL or LF disruption, based on the improved specificity described by Pizones et al 8 for that criterion. The sensitivity analysis best highlights the magnitude of this bias, which shows a significantly higher reclassification rate by MRI utilizing HSI vs black stripe discontinuity (33% vs11%). 10 This study’s large sample size and consecutive recruitment (n = 244) resulted in a well-balanced cohort in terms of fracture morphology and conservative vs surgical patients.18,19 We excluded patients with neurological deficits since they are universally treated surgically, as was the case in our study, regardless of their MRI fracture classification. 27 Additionally, patients with neurological deficits typically undergo MRI to document neural damage; these instances are overrepresented, resulting in a spectrum bias. The study’s emphasis on neurologically intact patients eliminates such bias, which may be a crucial strength. We also excluded patients with osteoporotic fractures as defined by low-energy trauma and those who had an MRI more than 10 days after the injury since MRI sensitivity may decline after that point.20,28
Impact of MRI Reclassification on Decision-Making
MRI changed the TLOASIS among the 3 treatment’s recommendation categories (≤3, 4-5, >5) in 48/244 (19.7%) patients. Patients with TLAOSIS ≤3 (conservative) had only a 7% chance of being recommended surgery after MR results. In patients with TLAOSIS >5 (Surgical), MRI altered the decision to conservative in 1.2% of patients and gray zone in 21% of patients. These findings demonstrate the reliability of TLAOSIS based on CT vs MRI in guiding decision-making for conservative and surgical groups. In the gray zone (TL AOSIS 4 or 5), MRI has the highest possibility of modifying the decision (33%) either to surgery (11%) or conservative treatment (22%). We believe that the reported 19.6% rate of change in treatment decisions based on TLAOSIS may overestimate the true impact of MRI in decision-making. For example, ruling out PLC injury by MRI in A4M1 or B (in 17 patients) reduces TLAOSIS from >5 to 5; however, we believe that most of these patients will require surgical treatment due to severe bone instability. Conversely, in case of mild instability and suspected PLC injury, CT (A3M1) ruling out or PLC injury by MRI may change decision-making. Severe bony instability can predict surgery independently and precludes the added value of change in TLAOSIS after MRI. TLAOSIS distinguishes the degree of bony instability between A4 and A3 fractures by assigning 5 points vs 3 points, respectively. 17 However, there is no consensus on clinically significant bony instability in burst fractures, and the A3/A4 criterion has been criticized for its inability to guide decision-making in all cases of burst fractures.29,30 To assess the impact of Fracture reclassification after MRI on long-term outcomes, we looked at long-term follow-up from a patient with fracture reclassified by MRI. However, this was hampered because only 6/25 (24%) patients were treated non-operatively; 1 required surgery for posttraumatic kyphosis and 3 had significant back pain at the latest follow-up.
Predictors of Fracture Reclassification by MRI
We found that the number of positive CT findings and the fracture level were the best predictor of fracture reclassification by MRI. Type-B fractures with only 2 positive CT signs had a considerably higher rate of downgrading to type-A after MRI than those associated with 3 or 4 signs (17% vs 0%). Type-A3M1 and A4M1 had a considerably higher rate of upgrading to type-B after MRI than A3M0 and A4M0 (20% vs 0%, P < .02 and 32% vs 7%, P < .006, respectively). The association of the M1 modifier with the rate of an upgrade for type-B gives credibility to our definition based on a single CT finding. The findings that the M1 modifier can help guide decision-making in A3/A4 in the neurologically intact patient may be crucial considering the dispute on decision-making for this group of patients. 3 We also discovered that thoracic fractures had much higher reclassification rates than thoracolumbar or low lumbar fractures (20% vs 10% and 0%, respectively). A possible reason for the higher rate of thoracic fracture reclassification after MRI is the anatomical or biomechanical variations or the observed difficulties in recognizing PLC injury in MRI, possibly related to regional variations of SSL/ISL.31-33 We think that osteoporosis may be associated with a higher rate of fracture reclassification by MRI due to reduced accuracy of CT in diagnosing PLC injuries. However, this observation could not be confirmed because suspected osteoporosis could be confirmed with DEXA (dual-energy x-ray absorptiometry) in only a small proportion of patients. 13
Implications
This study shows that TLFs without neurological deficit can be correctly classified with CT alone at a 10% misclassification rate.7,8 The detailed fracture reclassification rate after MRI provided here for each fracture subtype or TLAOSIS category may help guide when to request MRI for neurologically intact patients with TLFs. Not having any patients with type C, A3M0, A2M0, and type B with ≥3 CT signs change classification after MRI assures us that these patients can be accurately classified with CT alone. In contrast, MRI might significantly change the fracture classification for A3 M1, A4 M0, or M1, B2 with 2 CT signs in 7-32% of patients, suggesting that MRI should be ordered for those patients. The above findings can substantially reduce the need for MRI in the emergency setting, reducing costs and efforts while also expediting treatment or in low-resource areas where MRI is unavailable. 16 The study emphasized the importance of using the appropriate CT criteria for PLC injury and a standardized approach of CT interpretation in achieving high CT accuracy for PLC injuries. Because there is no consensus on a legitimate definition of PLC injury in CT,11,14 previous studies defined PLC injury in CT using any positive CT findings of PLC injury with no regard for the added value of combined CT findings. 9,8 Instead, we defined PLC injury on CT as ≥ 2 CT findings based on more recent studies. 16,15 When PLC injury on CT was defined as ≥ 1 CT findings, our sensitivity analysis revealed a significantly higher reclassification rate by MRI than our default analysis (22% vs 11%). The standardized definitions for CT findings could explain the high inter-reader reliability on CT classification reported in that study (k = .84).16,23,34 We previously proposed defining criteria for each CT finding based on examining the diagnostic value of various morphological features of CT findings for PLC injury. 16 For instance, we used a threshold of ISW> 4 mm, which was shown to predict PLC injury independently in MRI previously. 16 Furthermore, we developed a standardized imaging algorithm for PLC assessment, which includes the optimal imaging plan and strategies to address pitfalls in identifying each CT finding (Figure 2).16,23
Limitations
Our study has several limitations, including a retrospective, single-institution design requiring external validation through multicenter prospective studies.18,19 Because MRI is an imperfect reference, intraoperative verification of PLC injuries may be warranted; however, that was not possible due to retrospective design. 35 Although intraoperative verification of PLC injuries is usually regarded as the gold standard, it is by definition restricted to surgical cases (in fact, open surgery), resulting in selection bias. 13 Notably, we excluded all patients with neurological deficits, including transient radiculopathy (N1) or persistent radiculopathy (N2). Arguably, patients with N1 could be treated either surgically or conservatively. However, distinguishing between N1 and N2 was challenging because of the wide variability of presenting symptoms associated with N1 and retrospective design. 17 Finally, It should be noted that our findings were based on a consensus of 4 experienced reviewers, including a neuroradiologist, and that they may be less reproducible in less experienced hands or without prior training.21,36
Conclusions
This study concludes that using appropriate CT/MRI criteria of PLC injury, TLFs without neurological deficit can be correctly classified with CT alone at a 10% misclassification rate. When considering the algorithm suggested by TLAOSIS, MRI would have altered the decision-making in only 19.7% of patients compared to CT alone. The use of alternative CT/MRI criteria would significantly increase the rate of fracture reclassification up to 20-30%. The rate of change of fracture classification by MRI could be predicted by the number of positive CT findings on CT or fracture level (highest for thoracic and lowest for low lumbar).
Footnotes
Acknowledgments
We acknowledge Mr. Basel A. Al Hadi and Ms. Nada T. Al-Qahtani, picture archiving and communication system technicians, provide technical support in constructing the digital database.
Declaration of Conflicting Interests
The author(s) declared no potential conflicts of interest with respect to the research, authorship, and/or publication of this article.
Funding
The author(s) received no financial support for the research, authorship, and/or publication of this article.
Ethical Stetement
Our institutional review board at King Fahd Medical City (IRB log number 20-347 C) approved this single-center study, and informed consent was waived due to retrospective design.