
Abstract

Not everything that can be counted counts, and not everything that counts can be counted.
Descriptive Statistics
Descriptive statistics are used to simply describe the data that has been collected. This data is typically presented in the first table of a well-written manuscript. There should be a clear explanation in the analysis section as to how data will be reported (eg, categorical and continuous measurements).
Descriptive statistics are important for the following reasons:
They enable one to determine the comparability of study groups at baseline and evaluate the likelihood of any selection bias or confounding. They enable the investigator to present all important factors that may influence outcome. When an analysis cannot include all known or suspected confounders, the estimate of treatment effects may be biased. This is known as an omitted variable or residual confounding bias and is often a problem in retrospective studies. When known potential confounders cannot be included in an analysis, this should be acknowledged as a limitation and the anticipated effect should be described. The baseline characteristics of the study population can help in determining the generalizability and external validity of the results to other patient populations. Baseline scores for pain, function, and quality of life measurements should be presented, especially when used as an outcome or associated with the outcome of interest. The absolute scores at follow-up are often associated with the scores prior to treatment. Finally, the descriptive tables presented in a study report typically should describe all enrolled patients. This can allow one to determine the extent of loss to follow-up, when not explicitly stated.
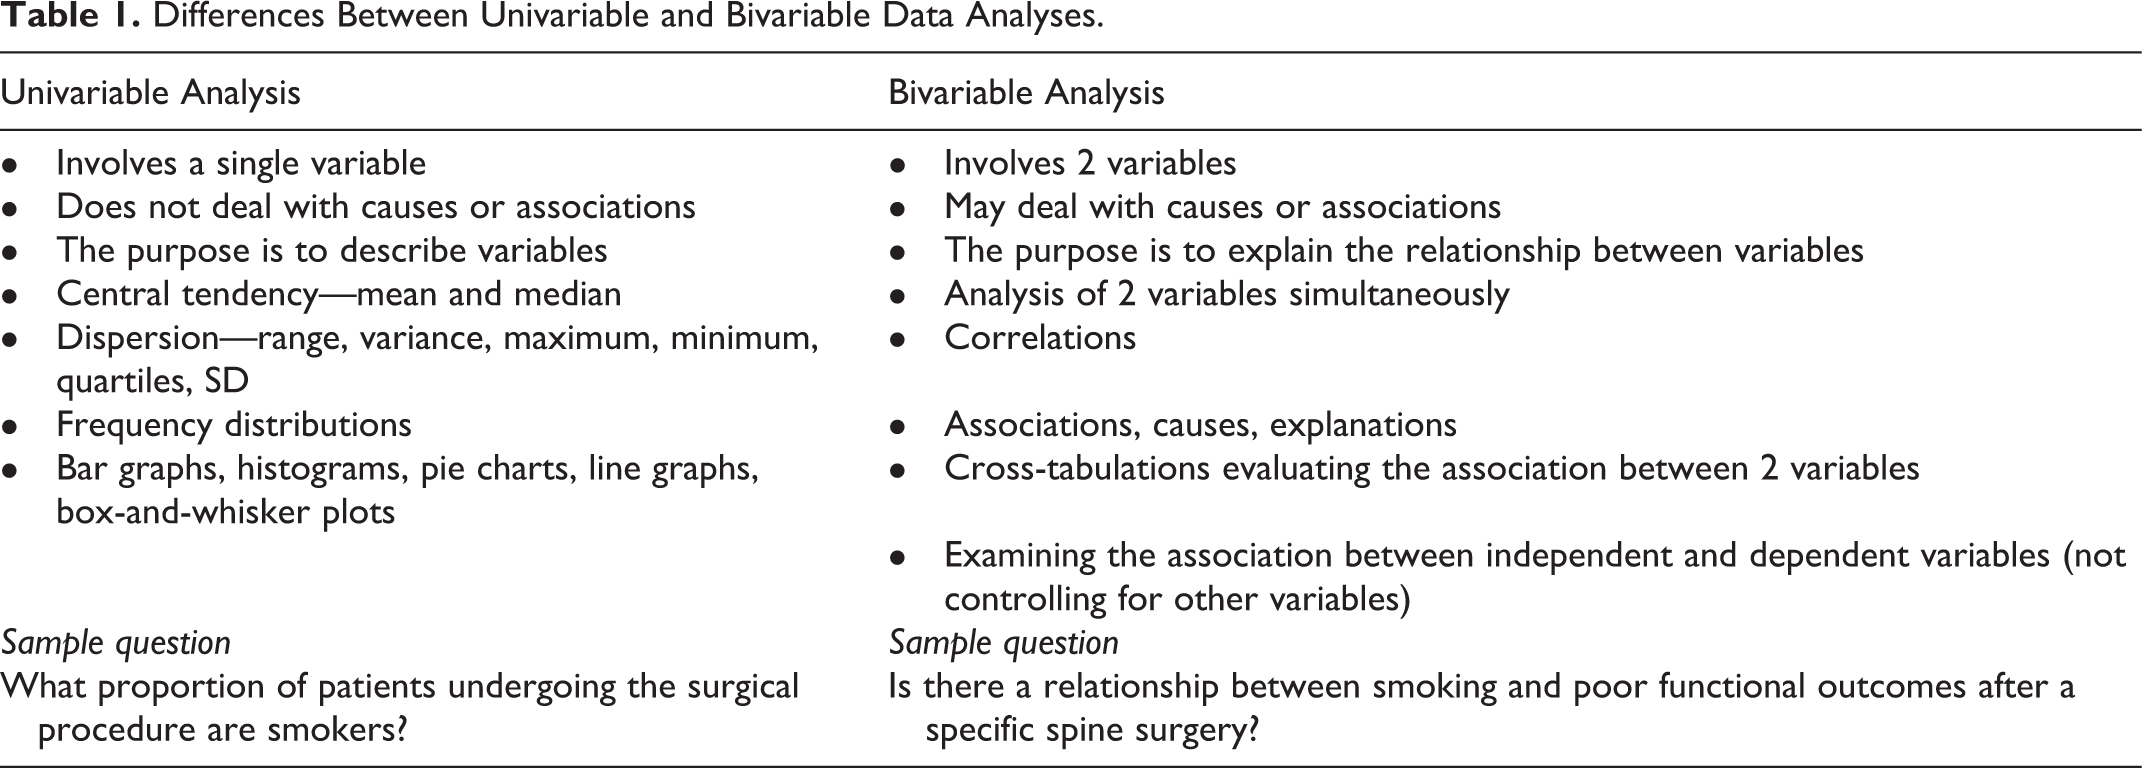
Descriptive analyses are best described as univariable analyses (Table 1). As all research is performed on samples of subjects, there is always a possibility, at least in theory, that the results observed are due to chance only and that no true differences exist between the compared treatment groups. Statistical tests help us sort out how likely it is that the observed difference is due to chance only.
Differences Between Univariable and Bivariable Data Analyses.
Analytical Statistics
While the individual man is an insoluble puzzle, in the aggregate he becomes a mathematical certainty. You can, for example, never foretell what any one man will do, but you can say with precision what an average number will be up to. (Sir Arthur Conan Doyle’s Sherlock Holmes, The Sign of the Four)
Bivariable Analysis
In order to better understand the initial associations between factors in the data, one should consider a bivariable analysis. This is a helpful analysis to conduct prior to more sophisticated methods like regression. Such an analysis allows an investigator to assess the distribution of individual variables and their impact on outcomes, which will lead to a more relevant and strategic development of a statistical model. If explanatory measurements are not equally distributed between study groups and are associated with the outcome of interest, they must be controlled for. Bivariable analysis allows one to inspect these possibilities in preparation for more sophisticated regression analyses (Table 1).
Multivariable Analysis and Regression
Regression refers to a set of techniques for modeling and analyzing several variables, when the focus is on the relationship between a dependent variable and one or more independent variables. Regression methods allow for evaluation of multiple explanatory variables. This is a useful tool when there is an uneven distribution of risk factors among comparison groups and one wants to control and adjust for them, while trying to estimate the effect of a single factor (eg, treatment A vs treatment B). This allows us to control for these variables, thereby minimizing confounding and subsequent bias in the results. Regression is also capable of testing interactions between variables, such as assessing statistical effect modification. When more than a few variables or strata are formed for a stratified analysis, or when more than a few potential confounding factors need to be adjusted, multiple regression can be used. Linear regression can be used to assess the association or difference between 2 groups, while controlling for other factors that may be potential confounders when the outcome of interest is a continuous variable. In a simple, single predictor variable linear regression or multiple linear regression, the size of the coefficient for each independent variable gives the size of the effect that variable is having on the dependent variable. The sign on the coefficient (positive or negative) gives the direction of the effect. In linear regression with a single independent variable, the coefficient tells how much the dependent variable is expected to increase (if the coefficient is positive) or decrease (if the coefficient is negative) when that independent variable increases by one. In linear regression with multiple independent variables, the coefficient tells how much the dependent variable is expected to increase when that independent variable increases by one, while holding all the other independent variables constant. Remember to keep in mind the units in which the variables are measured. Similarly, analysis of variance (ANOVA) can be used to compare mean values of 3 or more independent groups. A similar method known as analysis of covariance (ANCOVA) also allows for inclusion of other risk factors to minimize confounding bias.
There are other types of regression. For dichotomous outcomes, the most common regression technique is logistic regression. Logistic regression is a useful way of describing the relationship between one or more independent variables (eg, age, gender) and a binary response variable expressed as a probability, which has only 2 values, such as presence or absence of a postoperative complication. The effect measure produced by logistic regression is an odds ratio (OR), which is simply a ratio of odds. In general, they refer to the ratio of the odds of an event occurring in the exposed group versus the unexposed group. Odds ratios can help determine how strongly a given variable may be associated with the outcome of interest compared with other variables. Odds ratios are simply a different way of expressing this association than risk ratio (relative risk [RR]) since they compare the odds rather than the risk of an event. However, they are sometimes close to each other, such as when the outcome of interest is rare. Therefore, logistic regression is recommended primarily for uncommon outcomes. Otherwise, the odds ratio will overestimate the relative risk comparing one treatment with another or exposed with unexposed. 2 Other regression methods, such as Cox regression and negative binomial regression, also provide an effect estimate while allowing for control of other factors. These regressions can produce risk ratios instead of odds ratios as effect estimates (in Cox regression they are called hazard ratios). Relative risks are more intuitive than odds ratios, especially when the binary outcome assessed is common (ie, occurs more than 10% of the time).
When considering the strength of the effect estimate (RR or OR) from a regression model, the P value is less important than the confidence interval. Extremely wide confidence intervals indicate wide variability and the estimate may not be stable. Results for which estimates are surrounded by wide confidence intervals should be interpreted with caution even when associations are statistically significant.
Summary
Most analyses are divided into descriptive and analytical statistics and should be clearly described in the methods section of the study. The purpose of analytical statistics is to report the effects of treatment and risk factors for specific outcomes. These rely on the testing of statistical hypotheses. In order to better understand the data, bivariable analyses should be performed prior to more sophisticated methods of regression. Linear regression can be used to assess the association or difference between 2 groups, while controlling for other factors that may be potential confounders when the outcome of interest is a continuous variable. Logistic regression is a useful way of describing the relationship between one or more independent variables and a binary response variable, expressed as a probability. The effect measure produced is an odds ratio. Other regression techniques can produce relative risks instead of odds ratios as effect estimates.
Footnotes
Declaration of Conflicting Interests
The author(s) declared no potential conflicts of interest with respect to the research, authorship, and/or publication of this article.
Funding
The author(s) received no financial support for the research, authorship, and/or publication of this article.