
Abstract
The purpose of this study is to investigate how partially automated vehicles affect cognitive load. The study involved an on-road experiment where 29 participants drove a Tesla in both partially automated and manual mode for up to 45 minutes. The researchers objectively measured the participants' cognitive workload using the Detection Response Task (DRT) and subjectively assessed it using NASA Task Load Index (NASA-TLX). The findings revealed that there was no significant difference in cognitive workload between the partially automated mode and manual mode in both objective and subjective measures. Our study expands the literature on the effects of partially automated vehicles on cognitive workload by using DRT and NASA-TLX. Further studies should adopt similar methodology with the addition of physiological and ocular measures.
Keywords
Introduction
There are different levels of vehicle automation, ranging from level 0 (no automation) to level 5 (full automation) as per the Society of Automotive Engineers (2021). This paper will focus on level 2 partially automated vehicles. At level 2, the partially automated system provides support to the driver by controlling the vehicle speed, identifying when the vehicle is drifting out of the lane, guiding the vehicle back into the lane, enabling automatic emergency braking, and steering automatically. However, the driver is still accountable for overseeing the system and taking control when required (SAE, 2021).
Despite the expected safety benefits of advanced driving systems – the National Safety Council estimates a 62% reduction in road collisions following their deployment (National Safety Council, 2022) – initial reports show the potential for partially automated vehicles to have unintended consequences on road safety. For example, the National Highway Traffic Safety Administration (NHTSA) show that these vehicles were responsible for 392 crashes in the US between 2021 and 2022 (NHTSA, 2022).
Cognitive workload is a critical factor in driving safety, and it is well established that a high cognitive workload can impair driving performance and increase the risk of accidents (Lyu et al., 2017). This raises important questions about how well drivers are prepared to retake control during partially automated driving, particularly in the event of automation failure. To better understand the differences between manual and partially automated driving, it is essential to investigate the effects of cognitive workload and demands on drivers.
Understanding the impact of cognitive workload on the performance of individuals who operate partially automated systems poses several challenges. To provide a framework for defining cognitive workload, Lyu et al. (2017) drew on Senders' (1970) definition, which characterizes workload as the amount of effort and cognitive resources used by an operator while completing a task. This definition aligns with the description of driving-related cognitive demand presented in Lohani et al. (2021).
In the current study, objective and subjective metrics were used to measure workload. The objective method used in this study is the Detection Response Task (DRT). The majority of the studies that will be mentioned have utilized the DRT as a standardized and validated tool to measure cognitive workload (ISO 17488, 2016). Strayer et al., (2020) show how DRT is responsive to various factors, such as the level of driving difficulty and the visual demands of secondary tasks (also see Bruyas & Dumont, 2013; Cooper et al., 2016). The DRT is a simple stimulus-response task where participants are instructed to press a microswitch located on their finger in response to a given stimulus, which can either be a small vibration or an illuminated LED, that they must detect and react to accordingly.
Researchers are actively debating how cognitive workload is impacted by partially-automated driving. Stapel et al. (2019) had participants drive a vehicle in two modes: partially automated and manual, and two traffic conditions: monotonic which had a low traffic volume, and engaging which had a high traffic volume and required more frequent lane changes. Results showed longer DRT reaction times in the automated mode. This finding, combined with the absence of significant changes in self-reported drowsiness was interpreted by the authors as being the direct result of higher cognitive load. In an on-road study using a Tesla Model S with Autopilot, Biondi et al. (2018) also found that drivers had slower DRT response times during partially-automated driving than in manual driving. Lohani et al. (2021) observed yet another different result. They had participants drive various partially automated vehicles on the highway for 20 minutes while monitoring their heart rate and response time to the DRT. They observed no significant differences in heart rate or DRT between manual and partially automated driving modes.
The subjective measure used in this study is the NASA Task Load Index (NASA-TLX). It is another widely used tool for assessing perceived workload and task difficulty which has been used in driving research to evaluate the cognitive and physical demands of various driving tasks and conditions (Hart & Staveland, 1988). The NASA-TLX is a valuable tool for understanding the cognitive and physical demands of driving and can provide insights into ways to improve driving safety and performance.
Objective
The objective of this study is to investigate the effects of partially-automated driving on cognitive workload during longer on-road drives. While previous research has explored the impact of partially-automated systems on driver cognitive workload, their studies were limited to drives lasting up to 20 minutes (Lohani et al., 2021; Stapel et al., 2019; Strayer et al., 2020). We aim to monitor changes in drivers' behaviour over longer drives, and their performance. Therefore, to address this gap, we aim to study drivers completing longer on-road drives and measure their cognitive workload using both the Detection Response Task (DRT) and NASA Task Load Index (NASA-TLX). Based on the findings of Stapel et al. (2019), we expect to observe longer reaction times in the Detection Response Task (DRT) and higher scores on the NASA Task Load Index (NASA-TLX) during partially automated mode, due to the longer duration of the driving task.
Methods
Participants
Twenty-nine students from the University of Windsor (17 male, 12 female) were recruited for the study. Two participants were removed in the final analysis due to equipment malfunction, resulting in a total of 27 participants included in this study. Recruitment was done via email using a Research Ethics Board-approved flyer template, as well as through word-of-mouth. Participants were compensated at a rate of $20/hour for their involvement in the study. They also received reimbursed for any additional expenses related to the study. All participants met the following eligibility criteria: they held a valid driver's license, had no at-fault accidents within the past two years, had corrected-to-normal vision, provided proof of insurance, and completed a 45-minute defensive driving course. The age of participants ranged from 18 to 39 years old, with an average age of 22.5 and a standard deviation of 4.35.
Design
A within-subject design was used for this study. Driving mode (2 levels), either partially automated or manual, was considered as the independent variable. Dependent variables included DRT reaction time, DRT accuracy, and the six subscales of the NASA-TLX.
Equipment
Vehicle
The study employed a Tesla Model 3 vehicle equipped with Tesla’s proprietary partially-automated system Autopilot. This includes systems like Adaptive Cruise Control, Lane Keeping Assist, Automated Steering, as well as acceleration and braking capabilities.
DRT
In this experiment, the vibrotactile version of the DRT was used, which involved taping a vibrating motor onto the participants' left bicep to serve as the stimulus. Additionally, a microswitch was attached to their left index finger, enabling the participant to respond to the stimulus by either clicking the microswitch with their thumb or depressing it against the steering wheel. The microcontroller of the system recorded the participant's response time to the stimulus with millisecond precision, and the data was then stored on the host computer. The vibration motor emitted a stimulus in the form of a vibration, which appeared randomly every 3-5 seconds. Participants were instructed to respond to the stimulus quickly and accurately by pressing a microswitch upon feeling the vibration.
NASA-TLX
The NASA Task Load Index questionnaire was used to measure drivers’ workload (Hart & Staveland, 1988). The questionnaire consists of six unweighted Likert subscales ranging from 1 (very low) to 21 (very high) that measure different aspects of workload: (1) cognitive demand, which measures the cognitive effort required to perform the task; (2) physical demand, which measures the physical effort such as strength, force, and endurance needed to complete the task; (3) temporal demand, which assesses the time pressure of the task; (4) performance, which measures the accuracy and completeness of the task based on participants' perception of their performance; (5) effort, which measures the total amount of effort needed to complete the task; and (6) frustration, which evaluates the level of annoyance, irritation, or frustration participants felt during the task.
Procedure
Participant arrival and screening
Upon arriving at the garage where the Tesla was parked, participants were questioned about their use of alcohol, caffeine, and drugs. Those who reported consuming alcohol within 8 hours, drugs within 24 hours, and more-than-normal amounts of coffee were disqualified from the study. Subsequently, they were provided with a thorough introduction to the study which included detailed explanations about the procedure of the study, the risks and benefits, and the DRT.
DRT training
After the briefing, participants received instructions on how to operate the DRT, which included a demonstration of the equipment and a 1-minute practice session to confirm they understood how to perform the task.
Vehicle training
Participants were also familiarized with the vehicle by adjusting their mirrors, seat, steering wheel, and given instructions on how to drive the car in manual and partially-automated mode. During the training, participants sat in the driver's seat while the research associate sat in the back.
Route
Before the experiment began, participants were familiarized with the vehicle by driving on a limited route around the University of Windsor campus. During the experiment, they drove on the section of Ontario Highway 401 between Exit 14 in Windsor and Exit 81 in Chatham-Kent, and back (See Figure 1). Participants drove manually in one direction and in partially-automated mode in the other direction. The order of conditions was counterbalanced across participants. The duration of each condition was 40 minutes. After each condition, participants completed the NASA-TLX questionnaire to rate their perceived workload during conditions.

The study route which covered a section of Ontario Highway 401 between Exit 14 in Windsor and Exit 81 in Chatham-Kent.
Data analysis and processing
DRT. To ensure data quality, the raw reaction time data was subjected to filtering. Any outliers or incorrect data points were removed by eliminating reaction time data that was less than 100 milliseconds or over 2,500 milliseconds. These criteria were chosen in accordance with the guidelines provided in ISO 17488 (2016). After filtering the data, mean reaction times were calculated for each condition. Accuracy was also calculated by measuring the percentage of accurate responses.
NASA-TLX
Average ratings for the six subscales were calculated by driving mode.
Statistics
Bayes Factor analysis were conducted. Unlike traditional Null Hypothesis Statistical Testing (NHTS) which rely on the p-value to accept or reject the null hypotheses, Bayes Factor analysis provide information of the strength of the evidence in support of either the null or alternative hypotheses.
A reference scale is used in Bayes Factor interpretation. Jeffreys' scale (1935), which classify Bayes factors into different levels of evidence, is a commonly used reference scale. Evidence for alternative hypotheses is classified as follows on this scale: 1-3 indicates anecdotal evidence, 3-10 indicates moderate evidence, 10-30 indicates strong evidence, 30-100 indicates extremely strong evidence, and greater than 100 indicates extreme evidence. Similarly, the scale for null hypothesis is: 0.33-1 represents anecdotal evidence, 0.1-0.33 for moderate evidence, 0.03-0.1 for strong evidence, and less than 0.01 for extreme evidence. All analysis was conducted using RStudio, and BayesFactor package was used for Bayes Factor analysis.
Results
Analysis were conducted to investigate the difference in DRT reaction time and accuracy, and the six workload levels measured in NASA-TLX in both partially automated and manual mode.
DRT
Reaction time
To obtain the results for reaction time, we utilized the following model: the mode of the drive was chosen as the independent variable, and DRT response time was selected as the dependent variable. The Bayes factor for DRT reaction time was 0.33 seconds (See Figure 2), which indicated moderate evidence for the null hypothesis, suggesting that there was no difference in RT between partially-automated (M=541, SD=337) and manual mode (M=551, SD=327).
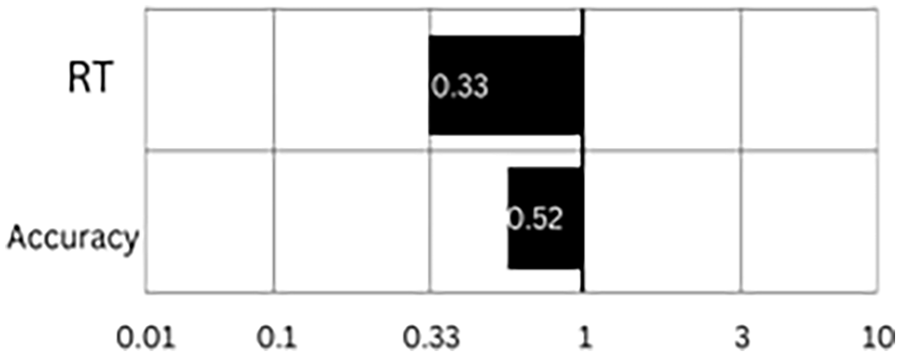
The Bayesian Factor values for DRT Reaction Time (RT) and Accuracy plotted.
Accuracy
A similar model was used to obtain the results for DRT accuracy, with the mode of the drive serving as the independent variable and the number of accurate responses as the dependent variable. The Bayes factor for DRT accuracy was 0.52 seconds (See Figure 2), indicating only anecdotal evidence in favor of the null hypothesis that no difference is present between the two modes.
NASA-TLX
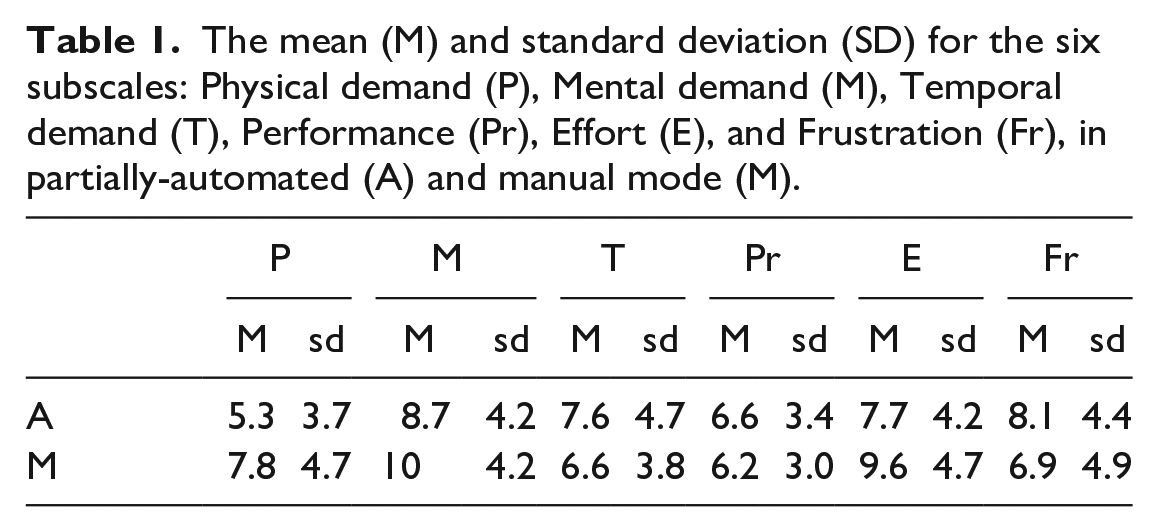
Descriptive statistics are included in Table 1. The results were calculated using the mode of the drive as the independent variable and each subscale as the dependent variable. The obtained Bayes factors were: 0.61 for mental demand, 2.02 for physical demand, 0.37 for temporal demand, 0.29 for performance, 0.78 for effort, and 0.39 for frustration. Mental demand, temporal demand, effort, and frustration all showed anecdotal evidence in favour of no difference. Meanwhile, physical demand showed anecdotal evidence in favour of the alternative hypothesis, and performance showed moderate evidence in favour of the null hypothesis.
The mean (M) and standard deviation (SD) for the six subscales: Physical demand (P), Mental demand (M), Temporal demand (T), Performance (Pr), Effort (E), and Frustration (Fr), in partially-automated (A) and manual mode (M).
Discussion
The study revealed that driving mode did not affect DRT reaction time and accuracy. These findings support the results of Lohani et al.'s (2021) study, which found strong evidence for the null hypothesis in both DRT and heart rate results, indicating no difference in cognitive workload between both modes. However, other studies contradict these findings. For instance, Stapel et al. (2019) reported longer DRT reaction times in partially automated mode, particularly in an engaging condition; Strayer et al. (2020) found longer DRT reaction times during partially automated driving; Biondi et al. (2018) also observed longer DRT reaction times during partially automated mode. According to Paxion et al. (2014), we should have observed higher workload during partially automated mode because most of our drivers were inexperienced with partially automated driving. This is explained by the fact that inexperienced drivers have not yet established their automation abilities, resulting in a higher workload than in experienced drivers. It is essential to note that the results were not sufficient to draw a strong conclusion. Therefore, further studies are necessary to analyze how partially-automated driving can affect cognitive workload in more detail.
The overall NASA-TLX results did not show a significant difference between partially automated and manual driving. These findings contrast with those of Stapel et al. (2019), who reported a reduced workload with partially automated driving in engaging traffic conditions. The participants did experience engaging traffic conditions due to construction in both conditions. Paxion et al. (2014) posits the fact that complex environments can cause higher workload for novice drivers as they are still processing information. However, it should be noted that the lack of difference in workload requires further investigation, as the evidence in support of the null hypothesis is not strong enough to draw a definitive conclusion. Moderate evidence was found in support of the null hypothesis for performance, indicating that participants found no significant difference in their task performance under both driving conditions. Meanwhile, the subscale for physical demand provided anecdotal evidence in favor of the alternative hypothesis, suggesting that there might be more physical demand during manual driving than during partially automated driving. Due to the anecdotal nature of the evidence, further studies are necessary to thoroughly explore these results.
Conclusion
In our study, we observed no discernible difference in cognitive load between the two modes as per subjective and objective measures. These findings add to the growing literature that has found no difference in cognitive workload between the two modes (Lohani et al., 2020) However, there are still unanswered questions that need to be addressed. Future research should replicate our methodology and supplement DRT with other physiological and ocular measures such as heart rate and eye trackers to further investigate cognitive workload. While both objective and subjective measures have been used in the past to measure workload, there are limitations to these measures. Objective measures, such as the DRT, can interfere with the main task (driving) as they require effort (Stapel et al., 2019). Subjective measures, such as the NASA-TLX, may not provide a true reflection of the work being performed (Stapel et al., 2019). Additionally, it would be beneficial to explore the differences between drivers experienced in using partially automated vehicles and those who are not, as they may allocate their cognitive resources differently on the tasks The findings of our study expand the literature of using DRT and NASA-TLX for measuring cognitive workload in longer drives.
Footnotes
Acknowledgements
We thank the Ontario Ministry of Transportation, SSHRC, and NSERC for their funding.