
Abstract
Road related fatalities are a global problem. Speed management remains an elusive skill for many young drivers. The main aim of the study is to understand self-reported speeding behavior, as well as the situations in which young novice and young experienced drivers exceed the speed limit. Three hundred and thirty-four young drivers completed the online driving survey. All participants were grouped based on experience (i.e., novice vs. experienced) and type of drivers (i.e., conformer, dettered, manipulator and defier). Overall, the results showed similarities between responses about their speeding behavior for both young novice and young experienced drivers. The results illustrate that the most common situations in which young drivers exceed the posted speed limit are road design, poor signage, rush, human error, and low traffic volume areas. These results are valuable in developing training to ‘calibrate’ young drivers’ actual and perceived behavior and improve their speed compliance.
Introduction
Young drivers are killed in motor vehicle crashes more than any other age category of drivers in Australia (Chen et al., 2009). It is estimated that 360,000 young people between the ages of 15-29 years are killed in road crashes annually around the world (World Health Organisation – WHO, 2015). In New South Wales (NSW), Australia, the latest figures report that 97 young novice drivers under the age of 25 were killed in road crashes in 2016 (Transport for New South Wales – TfNSW, 2021). For the last three years, the highest number of driver involvement in fatal crashes in NSW is among young drivers between 20 and 24 years at 43% (TfNSW, 2021).
A young driver is generally defined as a driver who is below 25 years of age. A novice driver describes a person who has commenced the path of becoming a fully licensed driver, and an experienced driver describes a person who has become a fully licensed driver (Beanland et al., 2013). In NSW, Australia, there are three stages before obtaining a full driver’s licence, including: a learner stage, provisional (P1– the licence issued after holding a learner’s licence for at least 10 months, and successful completion of the Driving Test and the Hazard Perception Test, P2 – the licence issued after having obtained P1 licence for at least 12 months), and independent (full) driver’s licence. In this study, young novice drivers are referred to provisionally-licensed drivers, while experienced drivers – those holding a full driver’s licence.
Research shows that young drivers do not believe anything negative will happen to them (i.e., motor vehicle accident; DeJoy, 1992; Chen et al., 2009; Williams, 2006). This optimism is combined with a distorted perception that they are better and more skilful than their counterparts (DeJoy, 1992). This remains unchallenged with the current driver training scheme. The problem is not that young drivers fail to consider driving as dangerous, but they do not perceive the danger as applying to them personally. Therefore, training interventions are needed to effectively improve risk perception and risk management, as well as to reduce young drivers’ risky behavior, and to personalise the risks to ensure the message is effectively learnt (Molloy, 2022).
Previous research also stated that young novice and young experienced drivers have various attitudes and perceptions of speed cameras (Blincoe et al., 2006). In the Blincoe et al. (2006) study, consistency of opinions was compared between four groups, based on the driver type: conformers – drivers who always or nearly always follow the speed limits given; deterred – drivers who have slowed down since the speed cameras have been installed; manipulators – drivers who always speed except when they are in a speed camera or monitored zone; and defiers – drivers who always exceed the speed limits even with the presence of speed cameras. The findings of previous studies, such as Corbett (1995) and Corbett and Simon (1999) concluded that drivers can be categorized into groups depending on their speed and camera-related driving behavior.
The present study extends previous research in an attempt to develop a comprehensive understanding about young novice and experienced drivers’ perceived speeding behavior (Gabany et al., 1997; Catchpole & Styles, 2005; Krasnova et al., 2015a; Krasnova et al., 2015b; Krasnova et al., 2016; Molloy et al 2018a; Molloy et al., 2018b). It also aims to better understand situations underlying drivers’ speed choice. This knowledge will provide a background for further examining young drivers’ speeding behavior and developing a training approach to improve their speed management behaviour (Molesworth et a;. 2011; Molloy et al., 2019; Molloy et al., 2021a; Molloy et al., 2021b; Molloy et al., 2022). This information will be essential for effective road safety programs that will save lives for from speeding-related crashes involving young people on Australian roads.
The main aim of the study is to understand self-reported speeding behavior, as well as situations in which young novice and experienced drivers exceed the posted speed limit. The research questions that this study seeks to address are:
What is young novice and young experienced drivers perceived speeding behavior?
What is the most difficult speed zone to adhere to?
What are the situations, where young novice and experienced drivers exceed the speed limit?
Method
Participants
Overall, 571 young drivers between 18 and 25 years old of different experience (e.g., novice vs. experienced as categorised by Transport for New South Wales – TfNSW, 2021) completed the online survey. The survey was advertised to the student and staff population of the University of New South Wales (UNSW) via online advertisements on UNSW official social media (i.e., Linkedin) and website. The survey contained a number of questions about own and other drivers speeding behavior, including: personal characteristics such as age, gender, type of licence, a number of years of driving without supervision; and questions about reasons for drivers’ speeding (building on the work of Blincoe et al., 2006), as well as the most frequent situations in which they exceed the speed limit.
Out of 571 responses, only 334 responses were considered valid, and other responses were excluded from the analysis due to the following reasons: failing to provide a response at least to 50 of the questions; failing to provide valid answers to at least 50% of the questions responses were considered ‘invalid’ if the answers contained words/ letters to the questions asking for numbers, as well as when leaving the answer blank. The data from three hundred and thirty-four participants (252 male) were analysed. The average age of the young drivers was 22.84 years old (SD = 2.76). Two hundred and nine participants (Mean age = 22.37; SD = 2.70) held provisional driver’s license (P1 = 115, P2 = 94), and 125 drivers held a full driver’s licence (Mean age = 23.63; SD = 2.67).
Participants who completed the survey were reimbursed for their time in the form of a $10 department store gift card. The study was approved by HREA Ethics Panel from the University of New South Wales (HC#210670).
Design
The online survey comprised a number of questions to examine young novice and young experienced drivers’ self-reported driving behavior. Overall, the survey was designed in an online survey platform Qualtrics and took approximately 30 minutes to complete. Questions were addressed to young novice and young experienced drivers about themselves and other young novice and young experienced drivers. For example, as part of the demographic data, participants were asked their age, gender, type of driving license they currently hold, the period of driving under supervision and the period of time driving without supervision, total hours of driving experience, and average number of hours driven per week.
Several questions were asked to identify their driver type based on the driver typology as classified by Blincoe et al. (2006). A number of questions were also asked to gain insight into self-reported driving behavior of young novice and young experienced drivers based upon their driver types. For example, questions about the speed zones that young novice and young experienced drivers find it easy/difficult to manage speeds; as well as about the effect of introducing a 30km/h speed zone on drivers’ speed management, and the effect of various anti-speeding messages on the speed choice.
Participants were also asked questions about reasons for speeding and situations in which they find themselves speeding in various speed zones, including: 40km/h, 50km/h, 60km/h, 80km/h, and 110km/h speed zones.
Results
Analysis overview
The data of the survey were analysed both quantitatively and qualitatively to address the aims and research questions. The responses were split into two groups: (1) Young Novice Drivers; (2) Young Experienced Drivers. The quantitative analysis was conducted aiming to summarise mean and standard deviations of participants’ answers (e.g., identify the most frequent reasons and situations for speeding in various speed zones, etc.).
The data has been collected via UNSW Qualtrics software and further transferred to Excel spreadsheet. Qualitative analysis aided the analysis as it provided the answers to the reasons underling those behaviors (e.g., participants’ choice of a decision, speed zones they find the most difficult to maintain speed). The answers from both types of analyses provide a comprehensive understanding of the young novice and experienced drivers' speed management behavior and provide a background for developing a cognitive-based training intervention and road safety initiatives to target speed management.
Self-reported speeding behavior based on driver’s type
According to the Blincoe et al. (2006) driver typology classification, drivers in the present research were divided into four types (as described in the section above). Participants were asked “When driving over the speed limit, how many km/h do you usually drive over the speed limit in the following speed zones (on average)?” in the 40km/h, 50km/h, 60km/h, 80km/h, and 110km/h speed zones. They were also asked to report how much they believed other young novice and young experienced drivers would speed in these speed zones. The results from young novice drivers’ responses in the 40 km/h speed zone demonstrated that ‘conformers’ reported no speeding for themselves but suggested that other young novice drivers exceed the speed limit by 12.5km and 13.8km/h for other young experienced drivers. ‘Deterred’ drivers’ perception of own speeding was by 6.8km/h, and for other young novice drivers by 7.79km/h and 8.66km/h for other young experienced drivers. ‘Manipulators’ perceived their own and other young novice and young experienced drivers exceed the speed limit over 10km/h (11.06km/h and 11.42km/h for other drivers respectively). ‘Defiers’ perceived own and other young novice and young experienced drivers speeding is above 20km/h (22.75km/h (own), 25km/h (another young novice) and 25.75km/h – other young experienced). The results in the 40km/h speed zone were similar to the results of other speed zones – 50km/h, 60km/h, 80km/h, and 110km/h. Figure 1 shows a summary of responses about young novice drivers perceived average speed over the speed limit in the 40km/h speed zone.
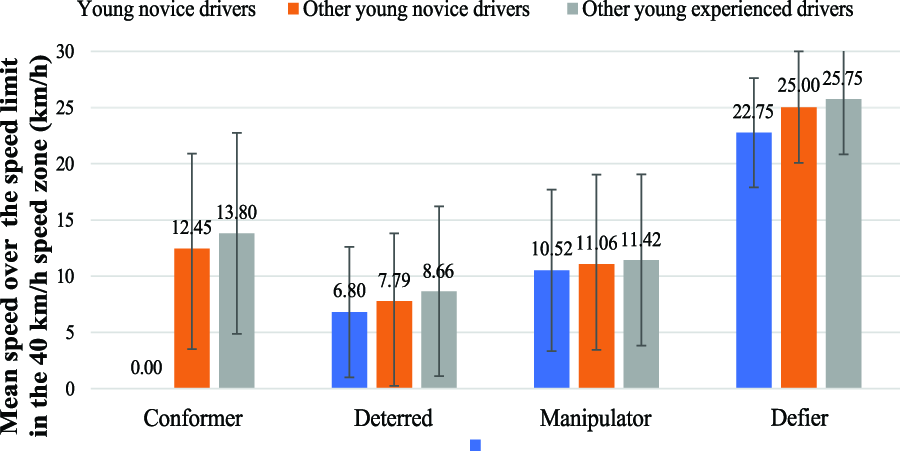
Self-reported mean speeds over the speed limit in the 40km/h speed zone for young novice drivers.
Figure 2 shows a summary of responses about young experienced drivers perceived average speed over the speed limit in the 40km/h speed zone. The results from young experienced drivers’ responses demonstrated that ‘conformers’ reported no speeding instances for themselves but suggested that other young novice drivers exceeded the speed limit by 9.33km and other young experienced drivers by 10.91km/h. ‘Deterred’ and ‘Manipulator’ drivers reported similar results for themselves as well as other young novice and young experienced drivers’ speeding - approximately 7-8km/h. ‘Defiers’ perceived own speeding above 16.67 km/h and similar number for other young experienced drivers, 16.33km/h. However, reporting over 20km/h for young novice drivers (22.33km/h). These results are approx. similar across all other speed zones.
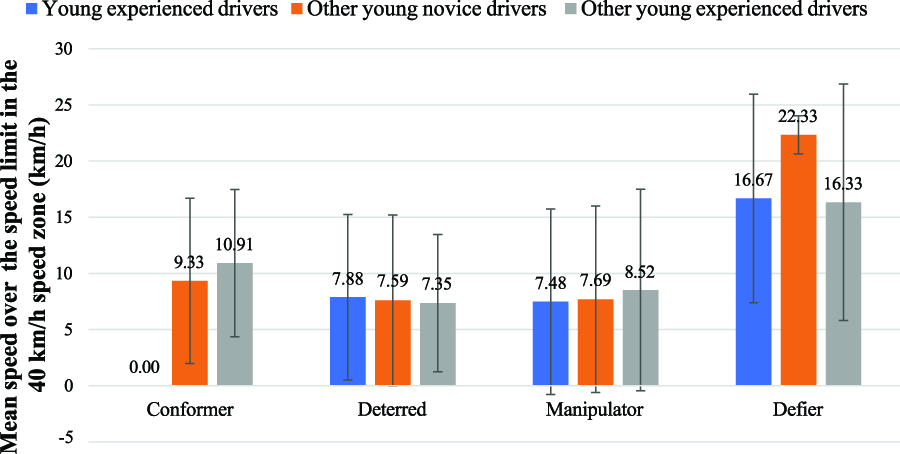
Self-reported mean speeds over the speed limit in the 40 km/h speed zone for young experienced drivers.
Young drivers were asked a question about the speed zones in which they find it difficult to manage speed. Figures 3 and 4 show a summary of responses. Young novice drivers found it most difficult to manage speed in higher (i.e., 80km/h -110km/h) and low speed zones (i.e., 40km/h). Young experienced drivers found it mostly difficult to manage speed in the low speed zone of 50km/h.
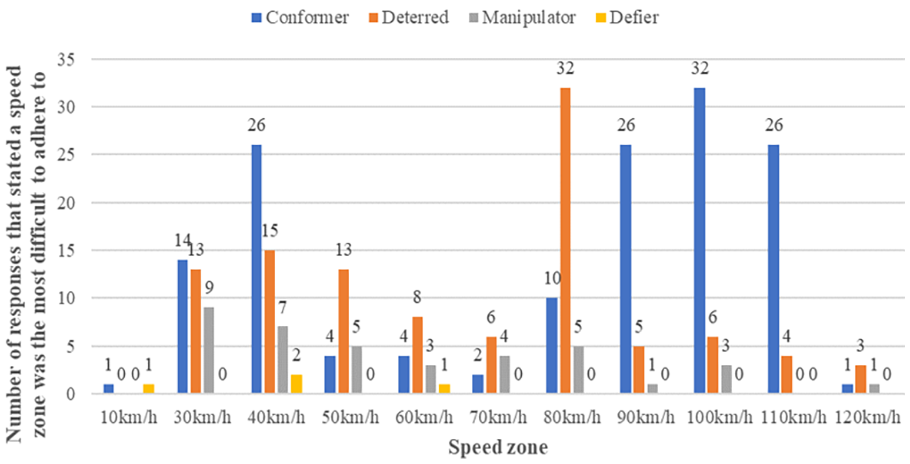
Speed zones which young novice drivers found the most difficult to adhere to.
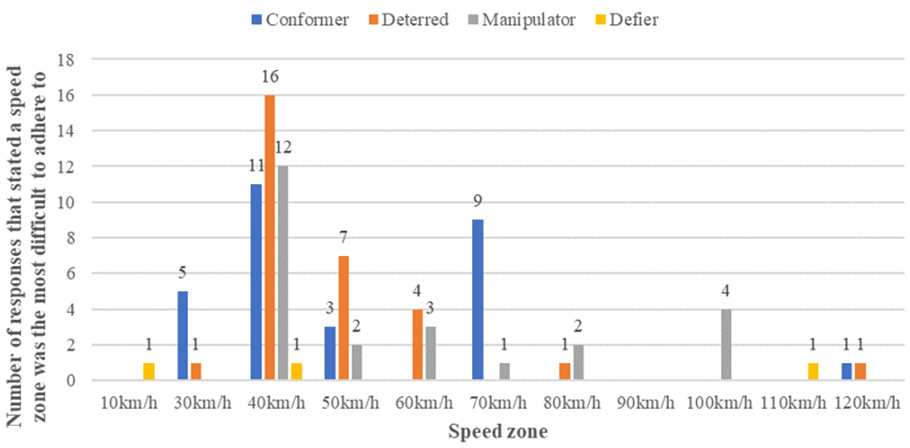
Speed zones which young experienced drivers found the most difficult to adhere to.
Situations in which young drivers exceed the speed limit
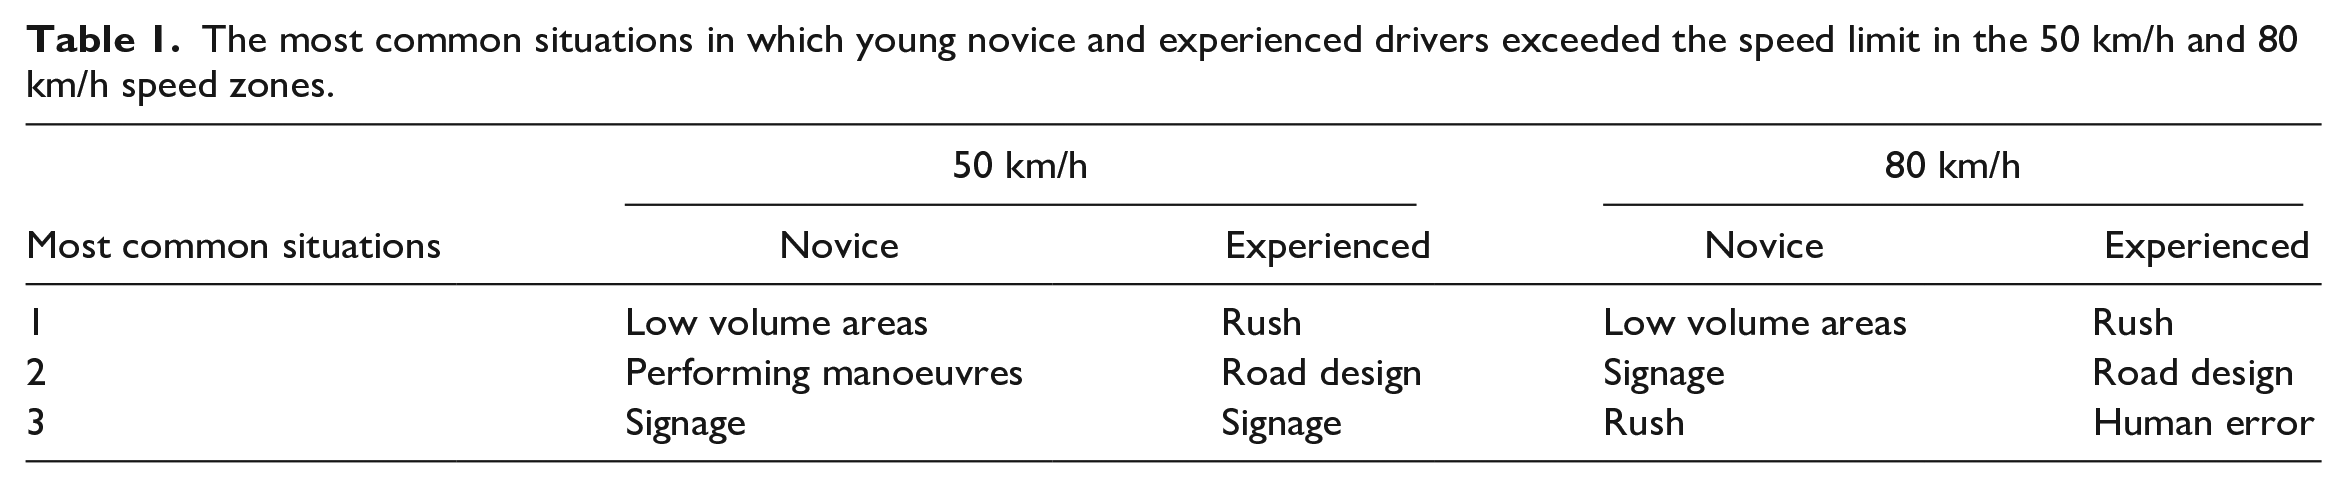
Young drivers were asked to describe situations in which they exceed the speed limit. Each situation was divided into various sub-categories. Table 1 shows a summary of the most common situations for young novice and young experienced drivers in 50km/h and 80 km/h speed zones.
The most common situations in which young novice and experienced drivers exceeded the speed limit in the 50 km/h and 80 km/h speed zones.
Situations in which young novice and young experienced drivers exceed the speed limit in the 50km/h speed zones
The most common situations where young novice drivers reported to exceed the speed limit in the 50 km/h speed zone were: (1) The low volume areas (23%), where all but one response was due to low number of vehicles on road (94%), and the other response in this category was lack of pedestrians (6%). (2) Performing manoeuvres (17%), which consisted half of the changing lanes (50%) subcategories and half (50%) overtaking, in which drivers sped to perform these vehicle manoeuvres. (3) Signage (14%), which mainly contained the speed limit sign unseen subcategory (70%), where participants stated they never saw speed limit signage for this speed zone, and the poor road markings subcategories (30%).
The most common situations where young experienced drivers reported to exceed the speed limit in the 50 km/h speed zone were: (1) Rush (20%) was the most common situation. The most frequent subcategories in this category were: the drivers were running late (64%) to an event or meeting. Other responses include situations such as the drivers needing to use the bathroom (18%), going to and from work (8%), and being in a rush to get somewhere (9%). (2) Road design was the second most common category within the situations listed in this dataset, with nearly half of situations given being within the ‘road type’ (45%) subcategory. This subcategory refers to the people who cite the type of road as the reason they sped, with responses such as ‘I was on a residential road’ fitting into this subcategory. Other situations within the road design category of situations include the geometry of the road (27%) such as its slopes and turns inducing speeding, novice drivers being familiar with the road (18%), and the presence of roadworks (9%), in which the drivers reportedly did not change their speed to match the new speed limit caused by roadworks on the road they were driving. (3) Signage (15%) was the third most common category of situations. This included young experienced drivers reporting not seeing speed limit signage in this speed zone (50%), being unaware of the speed limit of the area (25%) and encountering poor road markings (25%).
Situations in which young novice and young experienced drivers exceed the speed limit in the 80km/h speed zones
The most common situations where young novice drivers reported to exceed the speed limit in the 80 km/h speed zone were: (1) Low volume areas (17%) was the most common category of situations in which young novice drivers were speeding, with all but one of these responses stating that they sped in these areas because of the low presence of other vehicles (92%), with the other being the low number of pedestrians on road (8%). (2) Signage (14%) was reported to be the second most common category. This consisted mainly of the speed limit sign being unseen (70%), with poor road markings (30%) also being part of this category of situations. (3) Rush was the third most common situation (14%), where young novice drivers reported to be in a rush (50%), going to and from work (30%), being pressured by time (10%), and running late for something (10%).
The most common situations where young experienced drivers reported to exceed the speed limit in the 80 km/h speed zone were: (1) Rush (36%) with most of the responses related to running late (78%). Other responses included: being in a rush (11%), going to and from work (6%), and needing to use the bathroom (6%). (2) Road design (12%) was the second most common category within these responses, consisting of an even split of situations related to the road type (50%) and geometry of roads (50%). (3) Human error (10%) was the third most common category of situations, with most responses related to inattention (80%), with the rest stating poor speed management (20%).
Discussion
The main aim of the study was to understand self-reported young novice and young experienced drivers’ speeding behavior, as well as situations in which young novice and young experienced drivers exceed the speed limit.
To address the first research question, all participants were divided into two groups of young novice and young experienced drivers. Further, they were split into four groups based on the Blincoe et al (2006) classification of driver typology (i.e., conformers, deterred drivers, manipulators, and defiers). Participants then answered a number of questions in a survey. One of them referred to a number of km/h that they would usually go over on average, and other young novice and young experienced drivers (young drivers). The answers of each category of drivers were similar across all speed zones. Interestingly, conformers (both young novice and young experienced drivers) reported no speeding, but perceived other young drivers to exceed the speed limit by approximately 13km/h. Other types of drivers, deterred and manipulators, reported similar number of km/h that they would go over as well as other young novice young experienced drivers (i.e., under or approx. 10km/h). Interestingly, defiers (young novice drivers) reported their speeding over 20km/h, and perceived other young novice and other young experienced drivers to exceed the speed limit slightly more than themselves. However, defiers (young experienced drivers) reported own speeding (approx. 17km/h over the speed limit) to be similar to other young experienced drivers but thought that young novice drivers exceed the most (i.e., over 22.33km/h).
To answer second research question, young novice drivers found it most difficult to manage speed in higher (i.e., 80km/h -110km/h) and low-speed zones (i.e., 40km/h). Young experienced drivers found it mostly difficult to manage speed in the low speed zone of 50km/h.
Regarding the third research question, the situations in which young novice and young experienced drivers exceed the speed limit were explored in detail. A number of categories and sub-categories have been identified. The results showed that in low-speed zones of 50km/h and 60km/h (similarly), the most common situations in which they would speed were reported as: low-volume areas (i.e., low number of vehicles on the road and pedestrians on the street), performing manoeuvres (i.e., overtaking or changing lanes) for young novices, while rush and road design (i.e., straight road) for young experienced drivers. The common situation for both groups was signage, where they could not see the speed limit sign (70%), or they never saw a speed limit sign in the area. In the 80 km/h speed zone, apart from the low volume areas and performing manoeuvres, young novice drivers reported being in a rush as a common situation for their speeding. For young experienced drivers, apart from road design and rush, human errors, (i.e., inattention and poor speed management) were reported.
This research confirms that overall young drivers perceive themselves to perform better than other drivers (i.e., Chen et al., 2009; DeJoy, 1992). These findings highlight the importance of further developing and testing training to ‘calibrate’ young drivers’ actual and perceived speeding behavior. Importantly, it is important to examine how to effectively incorporate training interventions to address different ‘types of drivers’. Specifically, what important to understand is the effect of a training intervention (i.e., feedback, Molloy et al., 2021) that showed promise in improving young novice drivers’ speeding behaviour on different types of drivers (conformers, defiers, deterred, manipulators), and on young drivers of different experience (i.e., novice vs experienced). Hence, the focus for further research.
Conclusion
In summary, the results revealed that regardless of experience young drivers find it hard to maintain speed within the speed limit. Specifically, young novice drivers found it hard in both low (i.e., 40km/h) and higher speed zones (i.e., 80km/h-110km/h), while young experienced drivers found it more challenging to manage speed in the 50km/h speed zone. In addition, the drivers who believe not to exceed the speed limit consider that other young novice and experienced drivers manage speed poorly and have speed exceedances. In contrast, the category of drivers who reported to speed regularly, consider both themselves and other drivers just go over the speed limit by 20km/h. Other categories of deterred drivers and manipulators think similarly of themselves and other young drivers and reported to exceed the speed limit by approximately 10km/h.
Amongst the situations in which young drivers exceed the speed limit most often, low-volume areas, performing manoeuvres, signage, rush, road design and human error were most frequently reported. Further research in the field is needed to examine whether the perceived young novice and young experienced drivers’ speeding behavior correspond in real life (i.e., on the road). The present study focussed on answering “what” are those situations in which young drivers speed. Further research should also seek to answer the questions of “why” young drivers speed, and “how” to improve their speed management behavior. Further studies can also investigate young drivers’ actual speeding behaviour on the road and compare situations where they speed (i.e., via an on-road study) with those obtained from self-reported answers. This will allow identifying most common situations for speeding and further develop countermeasures to address them.
These findings highlight the importance of training to reduce speeding among young drivers, as well as the importance of training to maintain travelled speed within or below the speed limit; hence the focus of the next research.
Footnotes
Acknowledgements
We would like to thank all participants for their contribution in this research. The research was made possible through the support of the Department of Infrastructure, Transport, Regional Development and Communications (Road Safety Innovation Fund – RSIF).