
Abstract
While autonomous vehicles are being developed for the future of surface transportation, drivers today still need to be prepared for takeover. The objective of this study is to understand the optimal gaze strategy during the take-over process. First, an affine transfer method was used to link the eye tracking coordinates and pre-defined Aera-of-Interests (AOIs) locations. Then, independent t-tests were applied to analyze the relevance between the gaze strategy determined by the gaze time percentages on various AOIs and the Situation Awareness (SA) and Hazard Perception (HP) levels. The results showed that drivers with higher SA used different gaze strategies before and after they detected the hazards, while drivers with higher HP kept focusing on the center of the road. Explanations and implications of take-over request design are discussed.
Introduction
Background
Autonomous vehicles have become an increasingly popular concept in people’s life nowadays. As technology advances, they provide people with a brand-new driving experience and even influence the whole automobile industry (Anderson et al., 2014). From fully human-driven vehicles to fully self-driving vehicles, human drivers and vehicle control systems undertake different roles in driving. During autonomous control, vehicles can navigate themselves based on the information collected by the sensors, while human drivers get a chance to shift their focus from driving to other tasks. In those cases, human drivers’ attention usually focuses more on events that happened inside the vehicle, such as messages on their phones or social conversation rather than the surrounding environment. When the control system determines that it is no longer safe for it to control, it will give a Take-over Request (TOR). In most cases, the TOR is in the form of a visual display with an audio prompt (Ma et al., 2021), and the system will expect human drivers to take control of the vehicle in a set amount of time.
The allocation of the driving authority is referred to as the taxonomy of automation. The most commonly accepted taxonomy of automation levels is from the SAE international, where 6 levels of automation are defined (SAE, 2021). Much research work focuses on level 3 automation, especially the disengagement of autonomous driving because shifting authority between the autonomous system and human drivers makes it challenging to gain a complete understanding of the surrounding environment in a short period of time.
Relevant Works
Considering that the human drivers are involved in other tasks before TOR is given, it is hard for them to fully comprehend the entire situation in a short period of time, leading to an unstable take-over quality (McCall et al., 2016). In previous studies, researchers have used the take-over time, time to collision, and crash probability as measures of the take-over performance (Feldhütter et al., 2017; Gold et al., 2018). Those factors are directly related to human drivers’ maneuvers in the take-over process. However, given the fact that the current study focuses more on how drivers could gain enough information to conduct a safe and efficient take-over action, other factors work better in assessing take-over performance.
The take-over quality can be affected by various factors, such as road conditions, driver experience, and non-driving tasks. After human drivers take over, they need to perceive the surrounding situation, comprehend the information they get, and foresee the next movement of driving, all of which correlate with the three levels of the Situation Awareness model introduced by Endsley in 1995 (Endsley, 1995). Hence, Situation Awareness is critical to good take-over performance. SAGAT (Endsley, 1988) has been commonly used as a quantitative measurement of SA level, which is also feasible for the driving simulator study (van den Beukel & van der Voort, 2013). At the same time, in previous research, human drivers are expected to face hazardous situations after the take-over action, such as unexpected pedestrians or cyclists, blocked lanes, and bad weather (Cao et al., 2022). It is essential for human drivers to apply efficient visual allocation strategies to detect hazards in time.
Based on the above reviews, a good take-over action includes a good SA level, which indicates that the driver perceived and comprehend the surrounding situations, as well as a fast HP performance, which implies that the driver detects the hazards timely. Although theoretically, SA during driving should include the awareness of traffic hazards, in the current study, we used HP to specifically refer to traffic hazards that appeared on the road or near the road in front of the car, and we used SA to specifically refer to the awareness of other objects and events occurred in the surrounding areas.
Both SA and HP can be evaluated using eye tracking methods. In SA research, it was found that multiple eye tracking features can be used to infer SA (Zhang et al., 2020). Also, eye tracking techniques were applied to assess HP performance using eye fixation on latent hazards by analyzing eye tracking footage (Vlakveld et al., 2018).
In this study, we analyzed the relevance between visual attention allocation strategy and SA level and HP level in the take-over process. SAGAT questions were used to assess human drivers’ SA levels. Drivers need to answer questions about the information they have seen in the simulated driving scenarios. HP time was used to calculate human drivers’ HP level. Human drivers’ HP time refers to the time length from the TOR given to the time spot when the drivers first gaze at the hazard in the eye tracking video. Each driver’s visual attention allocation strategy was evaluated by the gaze time allocated to pre-defined Aera-of-Interests (AOIs).
Methodology
Participants
Forty-eight drivers, between 18 – 55 years old (M = 31.56; SD = 4.13), with a valid Canadian Driver’s License (e.g., Ontario G or G2) and at least one year of driving experience were involved in the current study. The participants comprised 22 females and 26 males, and their mean driving experience was 13.31 years (SD = 10.18).
Experimental Design
The experiment used a two-by-four within-subject design, including eight different conditions. The independent variables were driving condition (four levels: straight highway; curved highway; straight local; curved local) and drive type (two levels: autopilot only versus autopilot with distraction tasks). In the scenarios of autopilot with distraction tasks, participants were asked to perform one of the three non-driving-related in-vehicle tasks, while the vehicle was under autonomous control. The three types of distraction tasks were Auditory N-Back Task (Kirchner, 1958), Surrogate Reference Task (SuRT) (Regan et al., 2008), and the Critical Tracking Task (CTT) (Jex et al., 1966). The order of scenarios was counterbalanced across subjects.
In the scenarios, the participants turned on the autopilot function from the beginning, and the level 3 semi-autonomous vehicle would drive at a pre-set speed (90 km/h on highway and 30 km/h at local). There was moderate traffic in all scenarios, and pedestrians and cyclists in the four scenarios took place on local roads. During each scenario, scripted hazards, including vehicle collision, stopped lead vehicle, or road debris, would appear after a few minutes of autopilot driving. The vehicle would give human drivers a Take-over Request (TOR) 7 seconds before the ego vehicle collides with hazards. As Shown in Figure 1, the TOR was in the form of a flashing steering wheel icon with a continuous ring sound. After passing the hazard spot, the human driver would continue to drive manually for a further 50 meters and the scenarios would end automatically.
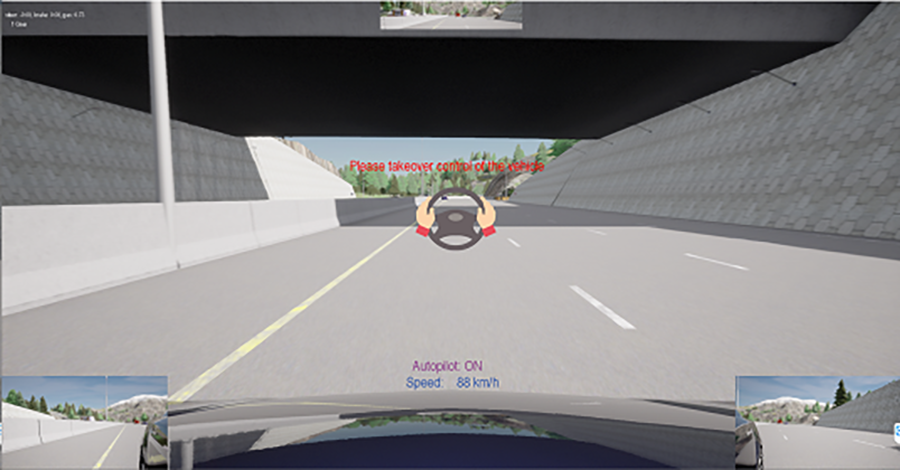
The Take-over Request (TOR) Icon.
Procedure
The participants’ consent was obtained before they came to the experimental location to make sure that they understood the purpose of the experiment. They were asked to complete a demographic questionnaire to indicate their age and driving experience including autonomous vehicles. Before the start of the experiment, the participants were briefed about the procedures of the experiment and their role in driving the semi-autonomous vehicle. They were informed that they did not need to monitor the system during the autopilot time if they feel conformable with that, and they should focus on the in-vehicle tasks in some scenarios. Also, they were notified that there would be a TOR when the system was incapable of continuing the autonomous control, and they should take over the vehicle and continue driving manually. After each scenario, two SAGAT questions would be asked. The questions were selected from the pool asking about surrounding cars, speed limit signs, or ego vehicle speeds after the TOR. They did not need to memorize any events that happened long ago, but only within one or two minutes before the questions were asked.
To collect participants’ eye gaze data, they will be asked to wear eye tracking glasses before the commencement of the experiment. They will be instructed about how to complete the calibration process and tips for keeping the eye tracking accurate during the experiment.
Equipment
The participant’s eye movement was captured by an Ergoneers Dikablis 3 eye-tracker, which is a wearable wired binocular eye-tracker with 60 Hz eye camera tracking frequency, 0.05° visual angle pupil tracking accuracy, and 0.1–0.3° visual angle glance direction accuracy.
The driving scenarios were programmed by the simulation software CARLA (Dosovitskiy et al., 2017), which was installed on a CyberPower PC Gaming Desktop. The driving simulator was equipped with a 27-inch 1080p monitor, a Logitech G29 steering wheel with force feedback and a set of pedals, and a GTR racing seat with horizontal adjustment. The distraction tasks were presented on a Dell laptop with a 15-inch screen.
Result
Data Pre-processing
The Area-of-Interests (AOIs)
The AOIs are areas in the driver’s view, which contain information related to the tasks. Researchers defined the AOIs based on various factors, including experts’ experience, attention-map, or clustering algorithms (Mao et al., 2021a), and the gaze patterns on AOIs have been used to evaluate human performance. Considering that most information of driving in current study should be demonstrated on the monitor screen used in the experiment, most AOIs are defined inside the monitor screen based on the layout of driving scenarios. In the current study, the six pre-defined AOIs are shown in the Figure 2.

Six AOIs defined in the current study. (The “Other” AOI covers all the remaining area.).
Gaze & Markers
Four paper markers with specific shapes printed on them were stuck to the four corners of the screen, and they can be automatically recognized by the eye tracking software. Both the markers’ coordinates and the eye gaze coordinates are generated by the eye tracking software in the form of (x, y). This coordinate system is built on the whole gaze frame from the scene camera of the eye tracker (1920 × 1080 pixels), with an origin point located at the top left corner (Figure 3).
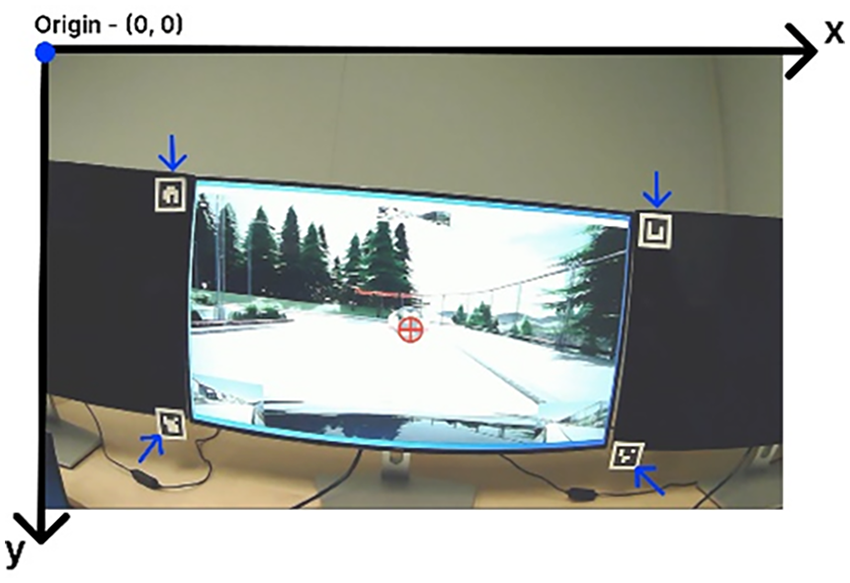
Markers and gaze coordinate system.
Coordinates Affine Transfer Method
To identify the drivers’ gaze locations upon various pre-defined AOIs, a transfer method needs to be established to connect the gaze coordinates and the AOIs’ locations. For each frame of the eye tracking footage, the four markers, forming a quadrilateral shape in the scene camera reference frame (Figure 2), have their original locations in the screen reference frame that form a rectangle. A transfer matrix M can be calculated because a quadrilateral and a rectangular have an affine transfer relationship. Once the M is calculated, we can multiply the eye gaze coordinates with the inverse matrix of M and get the gaze location on the screen reference frame, so we know which AOI it lands into.
Time Windows
In the experiment, there were usually 3-4 minutes of autonomous driving time before the TORs were given, but the focus of the current study is the time before and after the take-over action. Since the road lengths of different scenarios are different, different scenarios require different time durations to complete, so we extracted two important time windows: (1) from the TOR to hazard perceived by the driver, and (2) from hazard perceived by the driver to the end of the scenario.
Gaze Strategy
In the current study, human drivers’ gaze strategy refers to the percentages of time they spend on each pre-defined AOI, within a specific Time Window. Considering all six AOIs fill the whole gaze view, all six percentages add up to one.
SA levels & HP levels
The human driver’s SA level of each trial was measured using the SAGAT with two questions at the end of each scenario. The responses to the SAGAT questions were scored and averaged into a value ranging from 0 to 2. In the current study, a score equal to or higher than 1.5 would be considered a high SA level. Otherwise, it would be a low SA level. After labeling the time stamp of a driver gazed at the hazard using the eye tracking video, we got the HP time duration for each trial. Here we took the trial with the top 20% short HP time as the higher HP level group. Otherwise, it would be in the lower HP level group.
In the following analysis, all trials (48 participants * 8 scenarios for each person) were classified into high/low SA and high/low HP groups based on their SAGAT score and HP time.
Data Analysis
Independent-sample t-tests (Python, the Scipy package) were used to analyze human drivers’ gaze strategy on various AOIs, to determine if there are any significant differences between trails with high SA levels and low SA levels, as well as trails with high HP levels and low HP levels, at different time windows.
SA Levels Analysis
The bar charts above indicate the mean percentages of time that eye gaze allocated on each AOI among all trials. T and p values are reported in Table 1.
T-tests results between lower and higher SA groups at different time windows.
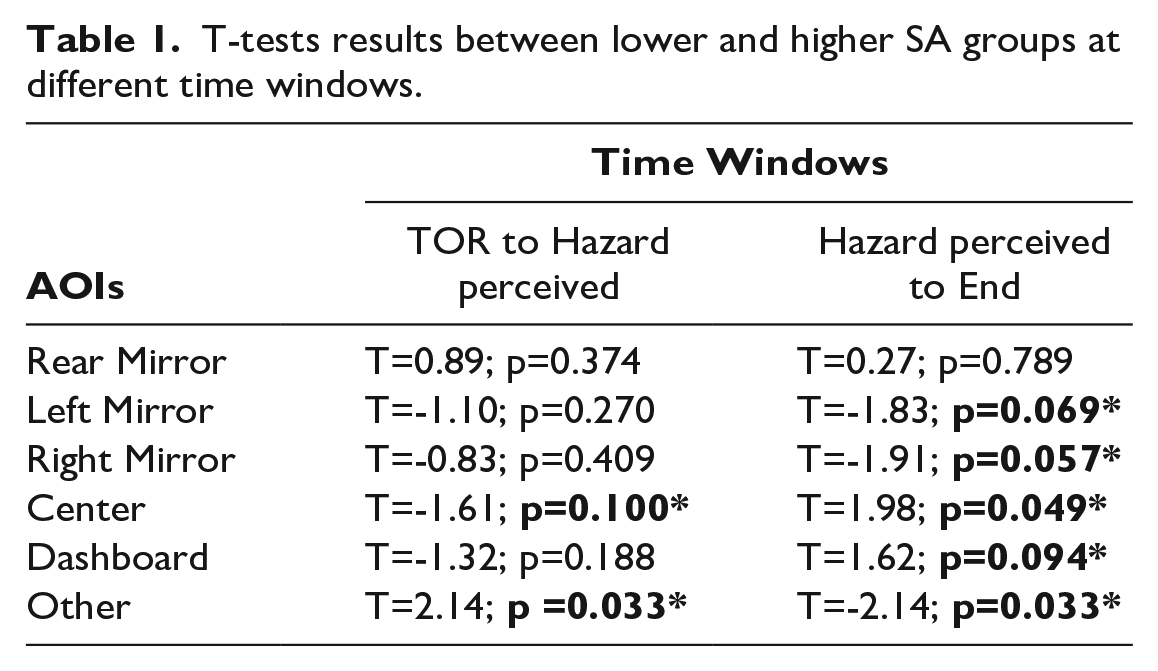
In Figure 4, the chart on the top refers to Time Window from the TORs given to the hazards perceived. During this period, the gaze time allocated to the “Center” and the “Others” AOIs are significantly different between the two SA groups. The chart on the bottom is Time Window from the hazards perceived to the trials ending. Though out this period, the gaze time allocated to all five AOIs except the “Rear-view Mirror” are all significantly different between the two SA groups. Additionally, the higher SA group allocated more time to the “Center”, and less time to “Others” before the hazards were perceived. However, this trend reversed afterward. The time that the high SA group distributed to “Left Mirror”, “Right Mirrors” and “Others” are all significantly higher than the lower SA group, except they spent significantly less time to the “Center”.
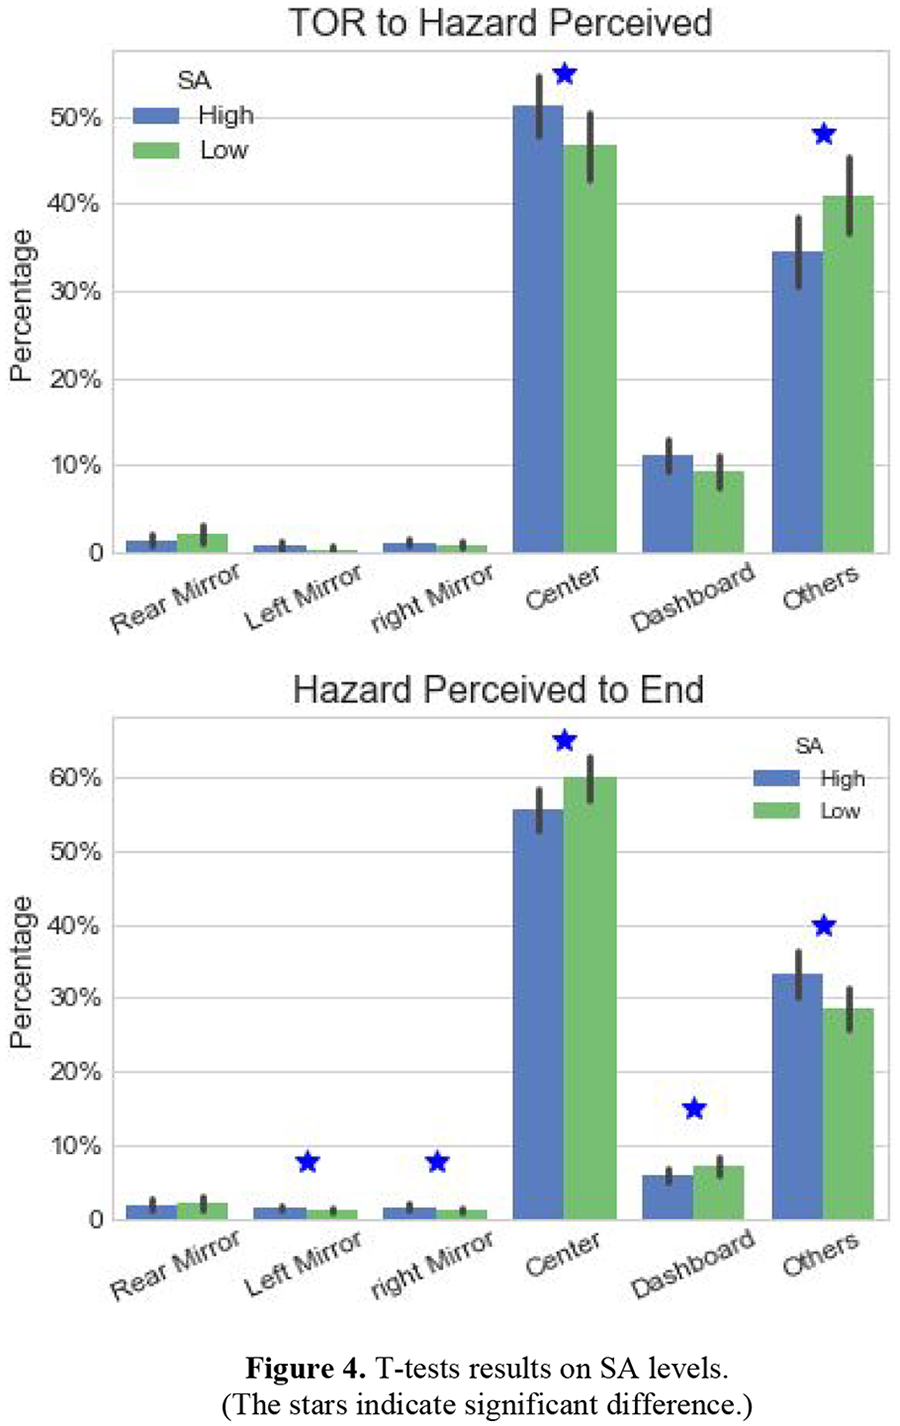
T-tests results on SA levels. (The stars indicate significant difference.).
HP Levels Analysis
Similarly, Figure 5 shows the mean percentages of time human drivers allocated on each AOI among trials with low or high HP levels. T and p values are reported in Table 2.
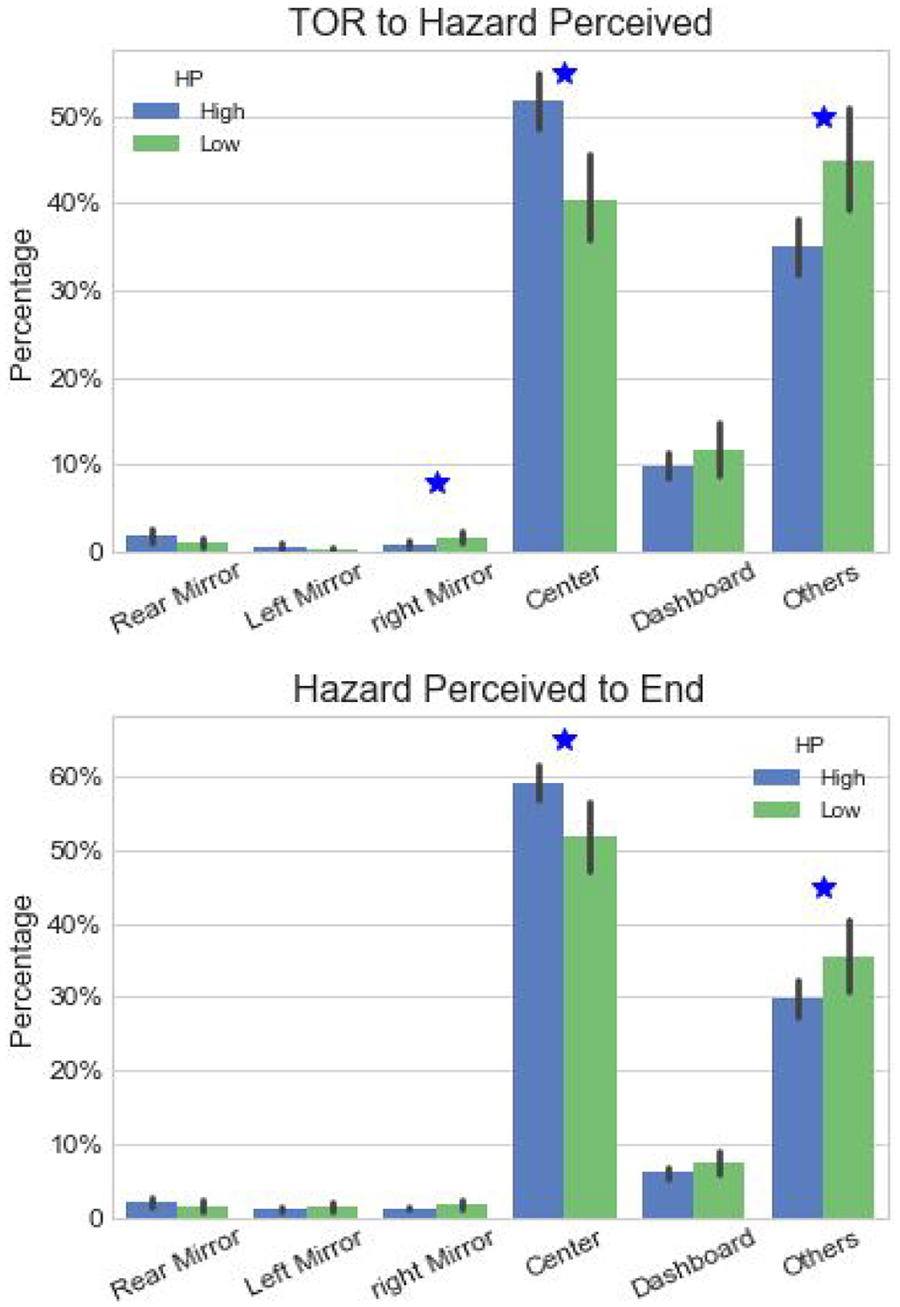
T-tests result on HP levels. (The stars indicate significant difference.).
T-tests results between lower and higher HP groups at different time windows.
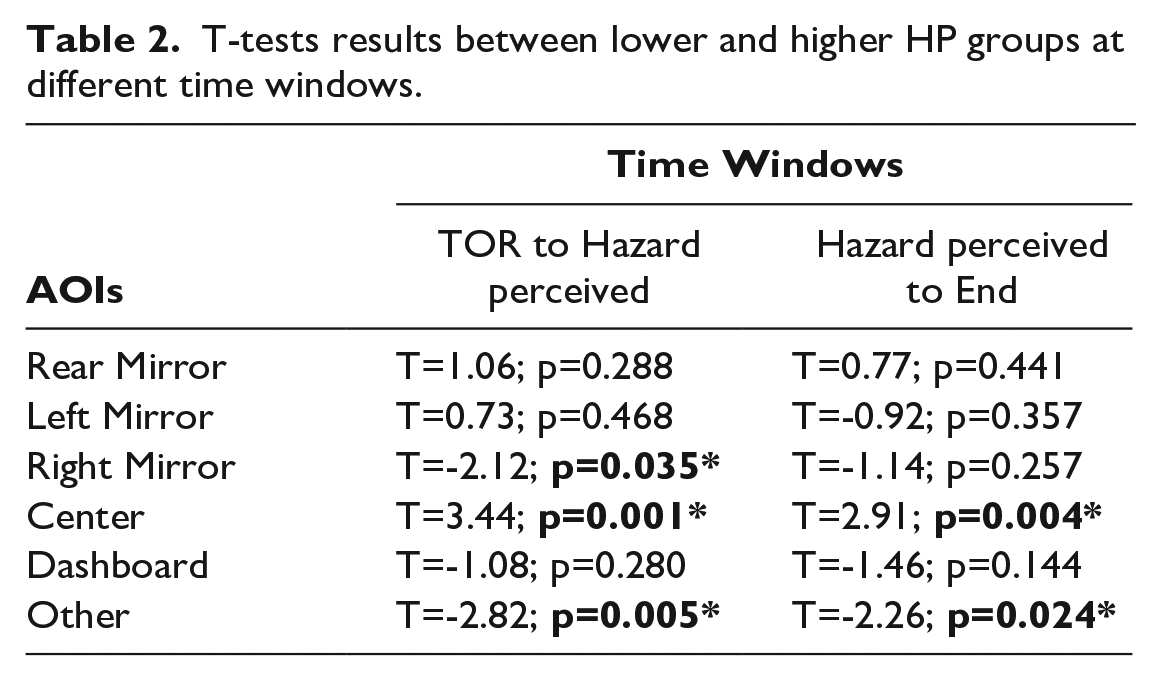
Results revealed that the gaze time allocated to the “Center”, “Right Mirror”, and the “Others” are significantly different between the two HP groups before the time when hazards were perceived. But after the hazards were perceived, only gaze time allocated to the “Center” and “Others” are significantly different between the two HP groups. Meanwhile, the high HP group allocated more time to the “Center”, and less time to “Others” both before and after the hazard perceived.
Discussion and Future Works
Based on the analysis above, the human drivers with a high SA level and a high HP level seem follow different gaze strategies in the take-over process. Both the SA level and the HP level are considered important in the take-over process. The high SA group would allocate more attention to the center of the road but less to the other parts of their view after the TOR. But after they detected there were hazards in front of them, they would focus less on the center of the road and spread their attention more to various areas. However, the high HP group kept focusing on the center of the road the whole time, from the TOR to the end of the trial. The conflict between the gaze strategies from the high SA group and the high HP group was an unexpected finding because we assumed that the drivers’ optimal gaze strategy should be similar.
The result could be caused by a few reasons. In the current study, drivers’ SA level of each trial was obtained from their answers to the SAGAT questions, which tested information about the surrounding environment after the TOR. Therefore, to gain a higher SA level, they need to expand their attention to multiple areas in their view and observe more incidents. Meanwhile, to timely detect the hazards, which happened on the road or by the roadside, drivers ought to focus more on the center part of the view. One thing to notice about the take-over process is that once the driver sees the hazard and feels confident enough that no collision will occur, he or she will no longer need to focus too much on the hazard location. The fact that high HP groups kept focusing on the “Center” may be caused by visual tunneling, which is a narrowing of drivers’ visual attention due to cognitive pressure (Briggs et al., 2011).
In this study, we focused on drivers’ eye movement data and aimed at discovering what is the best gaze strategy to ensure a safe and efficient take-over action. In conclusion, the best gaze strategy depends on the time windows. Before the hazard is perceived, it is better to focus more on the center of the view area to find out the hazard location as soon as possible. After the hazard is detected, a driver should spread their visual attention to multiple areas in the view to gain more surrounding information and to obtain a high SA level. In other cases, there might be other triggers for the TOR, so the drivers should try to find that trigger first before spreading their attention to other areas.
This finding can provide some implications for the future design of the Take-over Request. If some guidance about the reason for Take-over Requests can be provided, drivers might have better performance during the take-over process. Following the guidance, it could take them a shorter time to understand the adverse event leads to TOR and help them feel confident in expanding the visual scan areas. In future work, we could target finding the difference in drivers’ gaze strategies between situations with or without the guidance provided together with the TOR.