
Abstract
Conducting randomized controlled trials entails a prolonged, costly study start-up (SSU) process that may create significant delays. Optimizing the operational aspects of multisite trials requires identifying benchmarks in the SSU process and the potential delays associated with them. We engaged in a collaborative effort to identify and describe key SSU intervals that correspond with necessary procedures and processes for activating multisite clinical trials in the US. After developing definitions for SSU benchmarks and obtaining data from research coordinating entities, we identified factors that were significantly associated with reduced cycle times, including the use of central institutional review boards for study approval and status as a private practice or independent research site. However, small sample sizes and large proportions of missing data hamper the interpretability of our results. Future development of standard measures of SSU efficiency will be critical to analyzing and improving study initiation processes at US research sites.
Keywords
Introduction
Randomized controlled trials (RCTs) are the most reliable means for assessing the balance of benefit and risk associated with medical therapies. 1 However, conducting RCTs entails a prolonged, costly process 2 that may delay access to new interventions, hamper research into new uses for existing medical products, and impair critical comparisons among alternative treatment strategies. In addition, the perceived inefficiency of the US clinical trials enterprise (CTE) 3 is one of the reasons that industry is pushing research (including federally funded projects) abroad, despite doubts about whether findings from such research will be generalizable to US populations. 4–6 Although current data suggest that most clinical studies involve a single research site and small numbers of participants, 7 clinical trials capable of generating meaningful evidence that can inform practice are typically large, complex, multisite investigations.
If meaningful evidence is to be generated quickly, the operational aspects of multisite trials must be performed rapidly and with high quality. At the highest level, this requires minimizing the time between when an important medical question is formulated and when it is answered. One key factor in multisite trials is the time needed to ensure that all sites have completed the administrative activities required to begin enrolling patients. While considerable time may be spent on study feasibility, presite visit selection, and site selection, a convenient time to begin measurements for multisite studies that can be compared across trials is when a final study protocol is sent to participating sites, representing a benchmark “start time” for evaluating the duration of study initiation at a given site. Several critical checkpoints for study start-up (SSU) occur between the time a protocol is submitted to the site for review and the time that the first study participant is enrolled: institutional review board (IRB) submission, time of IRB final approval, and time of contract execution. Potentially costly delays can occur at or between any of these checkpoints. In a systematic review, Abbott and Grady 8 showed that US IRBs differentially apply federal regulations and display large variations in time required to review studies and in the decisions made. However, across the CTE as a whole, measurable outcomes of SSU remain poorly characterized.
In this article, we describe a collaborative, 2-stage effort to identify and describe key SSU intervals that correspond with necessary procedures and processes for activating multisite clinical trials in the US. Our aims were to (1) develop a collaborative approach to describing the current efficiency of SSU in the US CTE and (2) create effective approaches for improving it, including the development of standard terms and time points to be collected.
Methods
In November 2010, the Clinical Trials Transformation Initiative (CTTI, https://www.ctti-clinicaltrials.org/), a public-private partnership that seeks to identify generalizable, effective practices for clinical trials, organized a retrospective data analysis of multicenter clinical trials. This analysis sought to identify SSU process-related data already being captured by sites and sponsors and to determine whether several high-level attributes of sites or sponsors/clinical research organizations (CROs) contribute to shorter SSU time among participants.
Retrospective Data Analysis
CTTI members represent stakeholders from across the CTE. Membership is open to organizations that are interested in working with others to identify ways to make clinical trials more efficient and of higher quality. Current membership includes 17 academic institutions, 8 pharmaceutical companies, 7 government members and liaisons, 6 biotechnology companies, 4 professional societies, 4 CROs, 4 trade organizations, 3 nonacademic clinical investigator groups, 3 device/diagnostics companies, 2 IRBs, 1 professional service organization, 1 industry–other, and 1 standard setting organization. CTTI invited 34 of its member organizations (8 academic, 6 academic research organizations [AROs]/CROs, 4 investigator, 3 biotechnology, 3 medical device, 2 government, and 8 pharmaceutical) to submit retrospective data for its “Site Metrics for Study Start-Up” project. A total of 19 organizations submitted data (2 academic, 4 ARO/CRO, 2 biotechnology, 2 medical device, 1 government, 2 investigator, and 6 pharmaceutical) for an overall response rate of 54.3%. Each participating organization was asked to provide data for all phase 3 studies in SSU mode across all therapeutic areas from January 1, 2009 through January 1, 2010. If an organization did not have data for an interval, they were asked to submit data for a 1-year window as close to the defined interval as possible. In some instances, sites did not have phase 3 data, and these organizations provided data for phase 2 studies only. Of the 5396 studies, 5216 were phase 3 (96.7%), 101 were phase 2 (1.9%), and 79 were device only (1.5%).
Twelve data fields reflecting simple, broadly available metrics were requested from each organization (Table 1). Data were stored in Excel 2010 for Windows (Microsoft Corp, Redmond, WA, USA). Statistical analyses were performed using SAS version 9.1.3 (SAS Institute Inc, Cary, NC, USA) and R software (R version 2.13.1, R Project, Wirtschafts Universität, Vienna, Austria). Qualitative variables were analyzed by calculating absolute and relative frequencies. Cycle times were calculated by determining the number of days between relevant date fields. Cycle time metrics were then analyzed by calculating medians and interquartile ranges (IQR) and compared by various subcategories using the Kruskal-Wallis 1-way ANOVA test for nonparametric data. 9 We used a Bonferroni-adjusted threshold level of significance of .007 for each cycle time to account for multiple testing across 7 cycle times to arrive at an overall threshold level of .05 for the analysis. Missing observations were not included as a category for these analyses. When the results for the Kruskal-Wallis test were significant, post hoc multiple comparisons were run to help determine which groups were different while appropriately adjusting for pairwise comparisons. The type of IRB used by site type and by therapeutic area was both analyzed using the Fisher exact test to account for small sample sizes.
Field names and definitions.
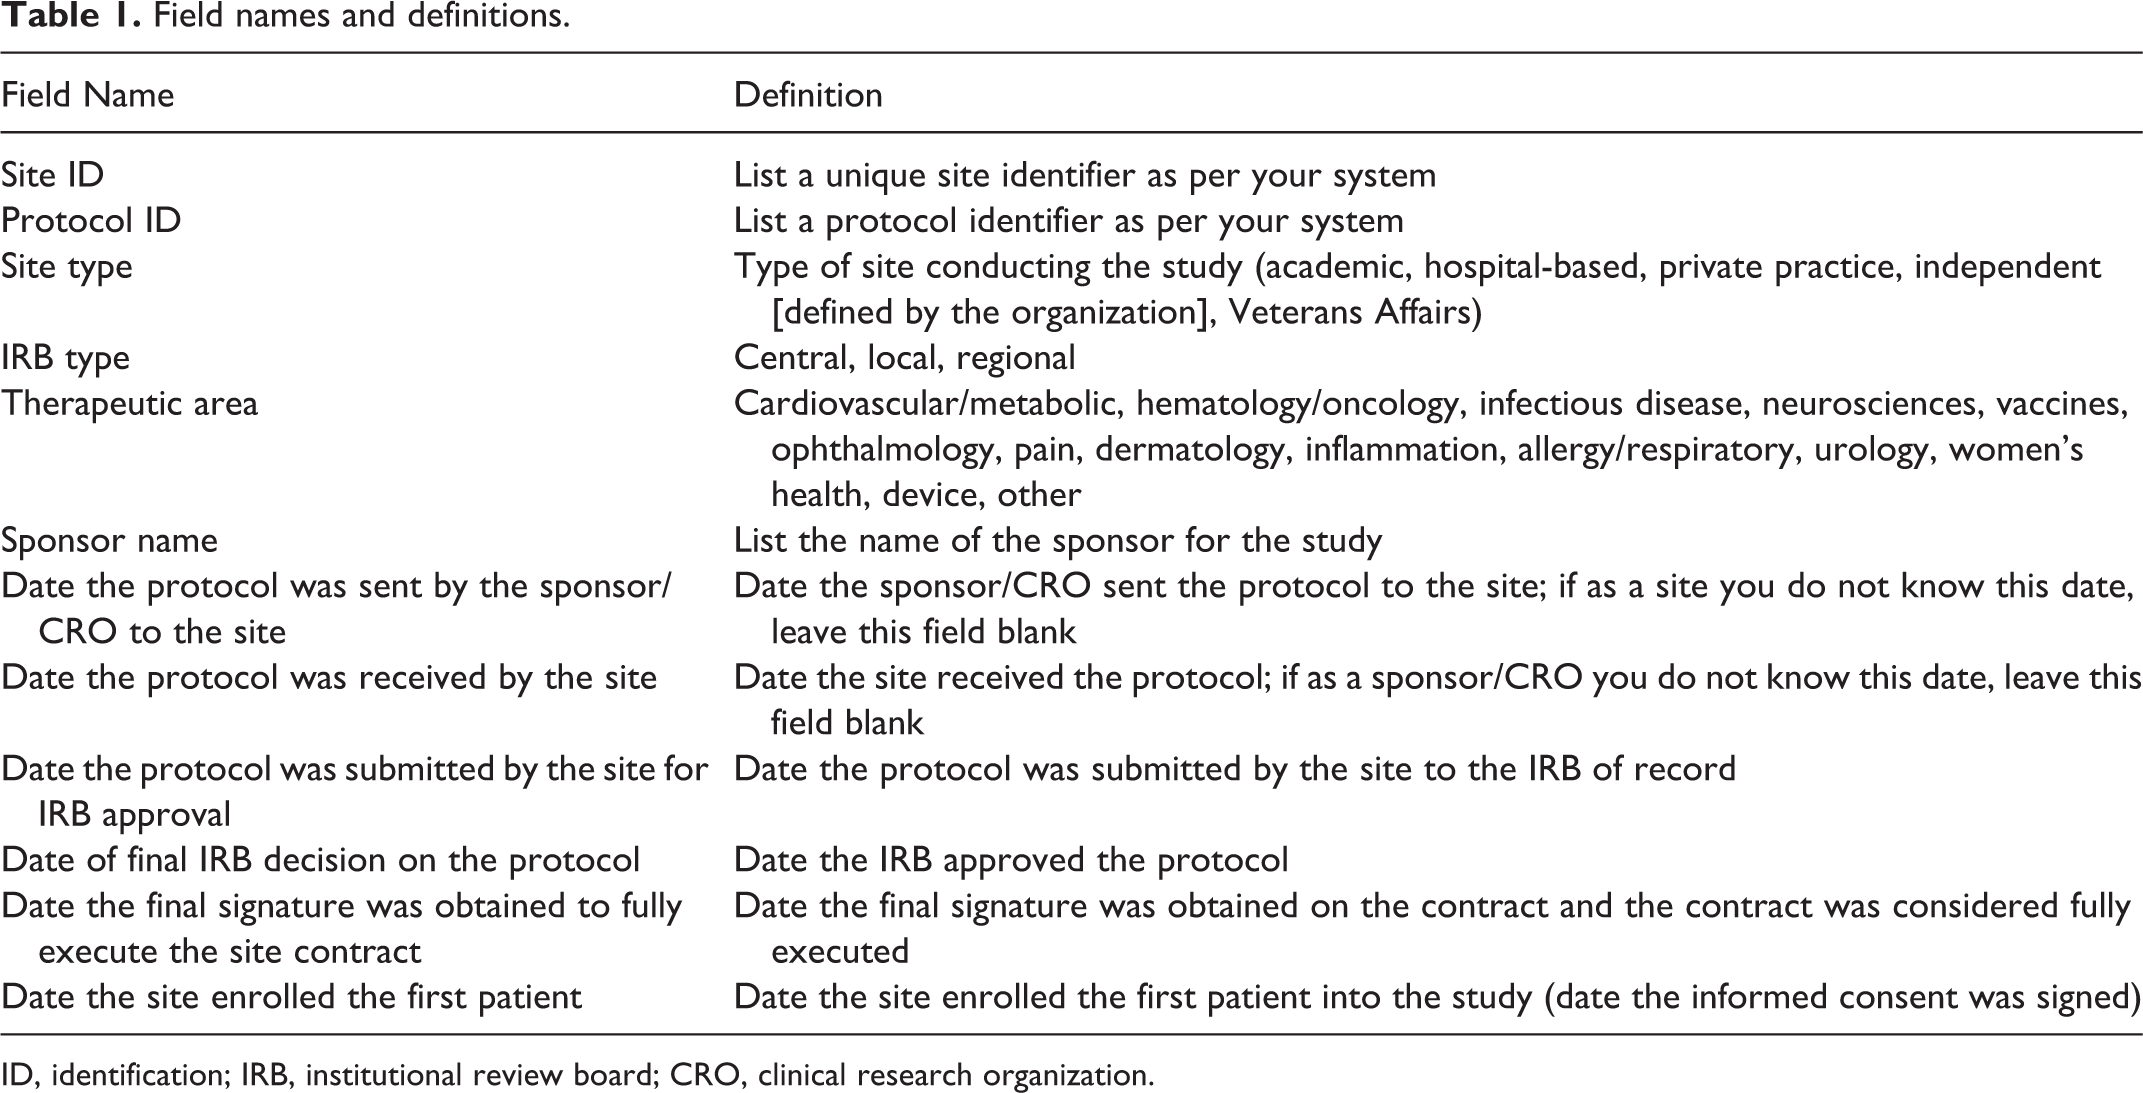
ID, identification; IRB, institutional review board; CRO, clinical research organization.
Proposed Data Elements and Cycle Time Metrics for Prospective Analysis
In May 2011, CTTI convened a meeting of subject matter experts in Rockville, Maryland. A total of 52 participants attended, including representatives from CTTI member organizations, patient advocates, clinical investigators, and other interested parties (Appendix A). At this meeting, participants reviewed and approved a proposed list of standard metrics for SSU activities to be used in prospective data collection and analysis. Standard, specific, and measurable definitions for all variables were proposed and agreed upon.
Cycle Time Metrics
Each participating organization submitted data from 6 different dates in their study cycle: (1) the date the protocol was sent by the sponsor/CRO to the site, (2) the date the protocol was received by the site, (3) the date the protocol was submitted to the IRB, (4) the date of the IRB’s final decision, (5) the date the contract was executed, and (6) the date the first study participant was enrolled. When definitive records were not available, organizations submitted approximate dates, and these deviations from requested fields were reviewed prior to inclusion in the final dataset. From the submitted date fields, we defined 7 cycle times of interest (Table 2). All cycle times were computed as a simple difference between the 2 dates.
Key study start-up cycle times.
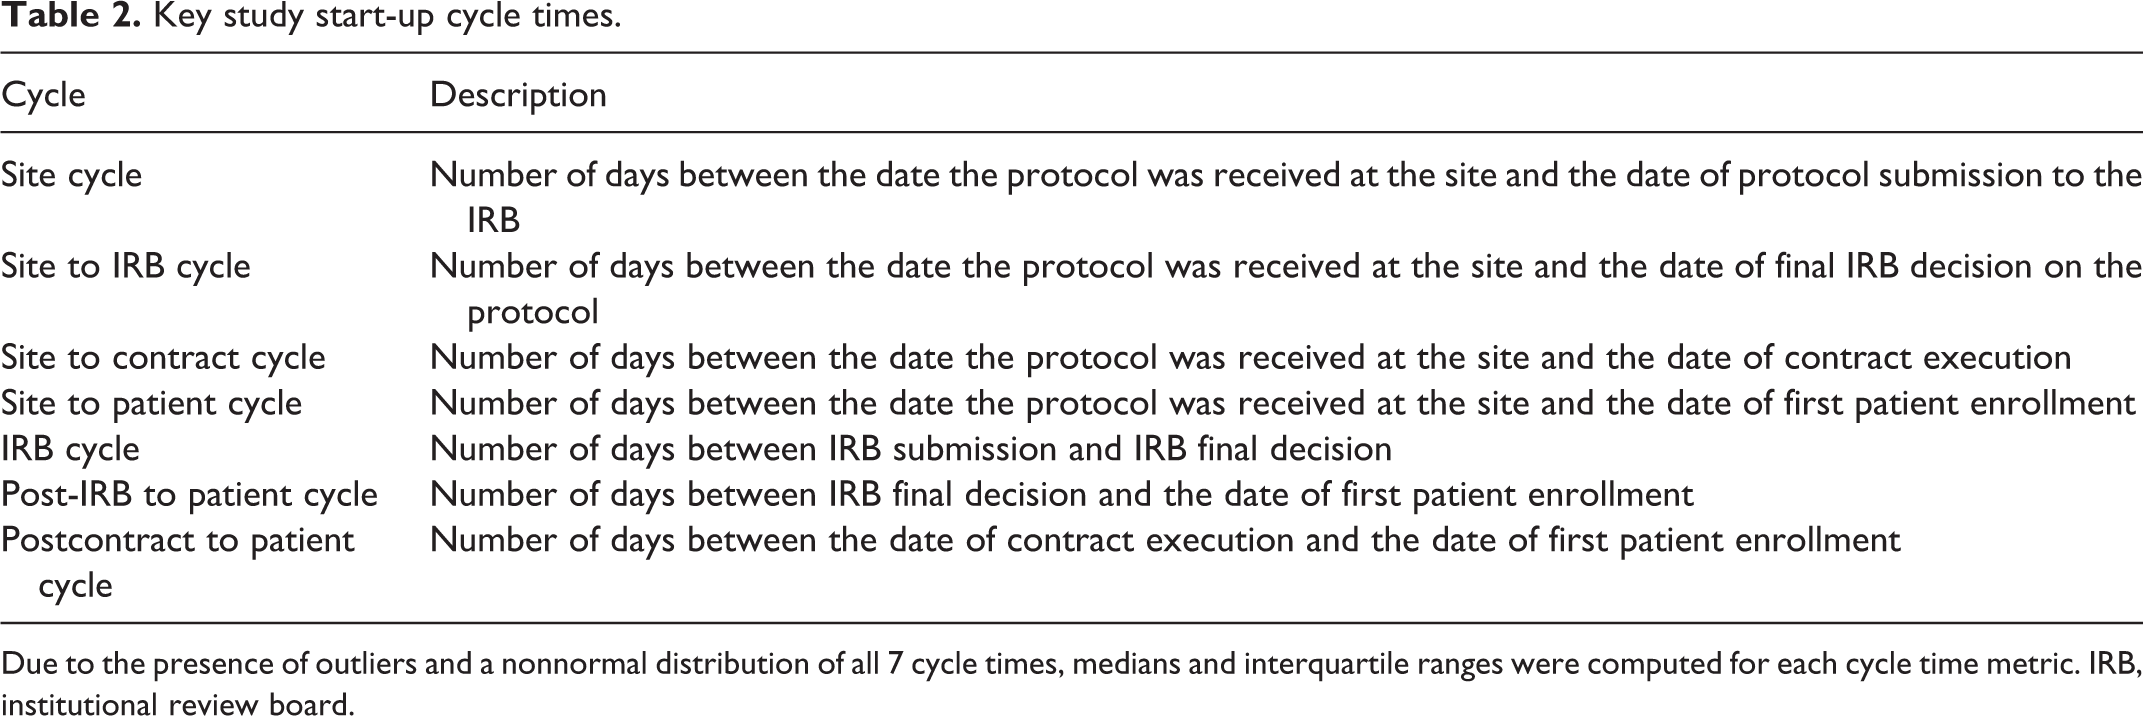
Due to the presence of outliers and a nonnormal distribution of all 7 cycle times, medians and interquartile ranges were computed for each cycle time metric. IRB, institutional review board.
Results
Demographics and Data Availability
The 19 participating organizations collectively submitted 10,673 lines of original data. Some organizations submitted additional data outside of specified parameters; data from these organizations were restricted to include uniform phase data (ie, phase 2, phase 3, or device only) spanning a 1-year interval. Following this restriction process, 5396 lines (50.6%) corresponding roughly to 5396 sites remained. A precise number of unique studies could not be obtained. While we recognize that there could be some duplication of studies in the data (eg, clinical researcher and CRO/sponsor might have reported on the same study), we did not attempt to collect this data because (1) collecting this information would have been onerous since organizations tend to track studies by their own unique identifiers, and (2) we did not anticipate that the volume of duplication would be large and therefore did not attempt to qualify it. Pharmaceutical companies submitted 63.9% of final data lines, AROs/CROs submitted 13.0%, academic organizations submitted 10.4%, and biotechnology organizations submitted 9.5%. The remaining 3.2% of data were submitted by other organizational types (Table 3).
Number and percentage of site-level data reported by participating institutions.
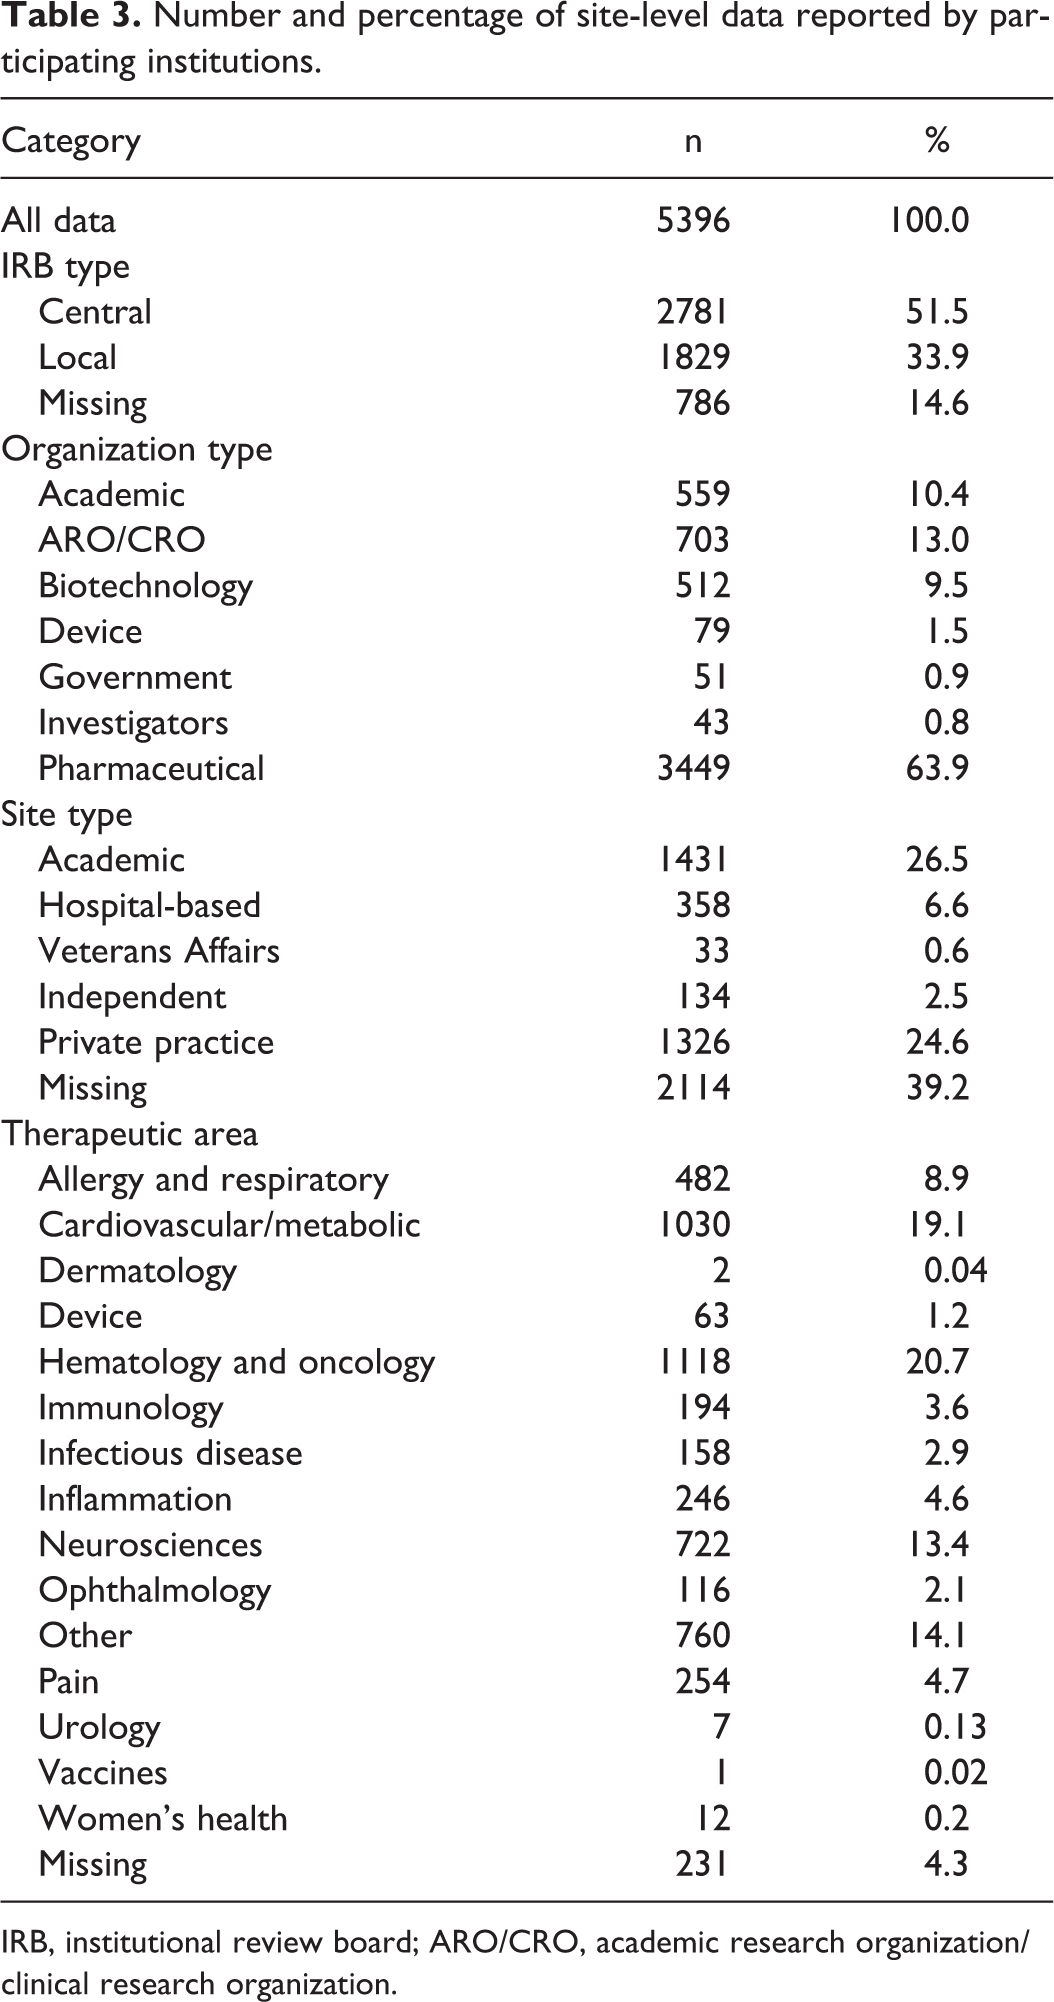
IRB, institutional review board; ARO/CRO, academic research organization/clinical research organization.
The distribution of site types included academic (26.5%), private practice (24.6%), hospital-based (6.6%), and independent or Veterans Affairs (VA) sites (3.1%); 39.2% of responses lacked data for site type classification. Private practices were the most common type of site for AROs/CROs (40.5%), biotechnology companies (71.5%), and investigator groups (79.1%), whereas hospital-based sites were most common for device companies (40.5%). Academic sites were the most common site type for pharmaceutical companies (21.5%).
The most common therapeutic areas were hematology/oncology (20.7% of trials) followed by cardiovascular/metabolic (19.1%), “other” (14.1%), neurosciences (13.4%), allergy/respiratory (8.9%), pain (4.7%), and inflammation (4.6%) (Table 3). Just over half of the data came from trials using central IRBs (CIRBs) (51.5%); the remainder was collected under local IRB oversight (33.9%) or was missing IRB type data (14.6%). Private practice and independent sites were more likely to use a CIRB, while academic, hospital-based, and VA sites were more likely to use local IRBs (P < .001). CIRBs were used more often than local IRBs in all major therapeutic areas except for “other,” infectious disease, and device studies (P < .001).
Because participating organizations were required to submit data within approximately 2 months, the amount of missing data in this study serves as a proxy for the technical and logistical feasibility of collecting certain data elements across disparate organizations. Table 4 summarizes the amount of missing data for each of 6 date fields and for site type classifications. Academic centers and government organizations had the highest rates of missing data across all categories, with the exception of the date of the IRB’s final decision for academic centers and the date the protocol was sent by the sponsor for government organizations, with rates of 100% missing data for some variables. Biotechnology companies completely lacked data for the date the site received the protocol, and device and biotechnology companies both had high rates of missing data for the date of first patient enrollment. For investigator sites, complete data were available for the date the site received the protocol, the date of protocol submission to the IRB, and the date of the IRB’s final decision.
Summary of missing data by date field and organization type.
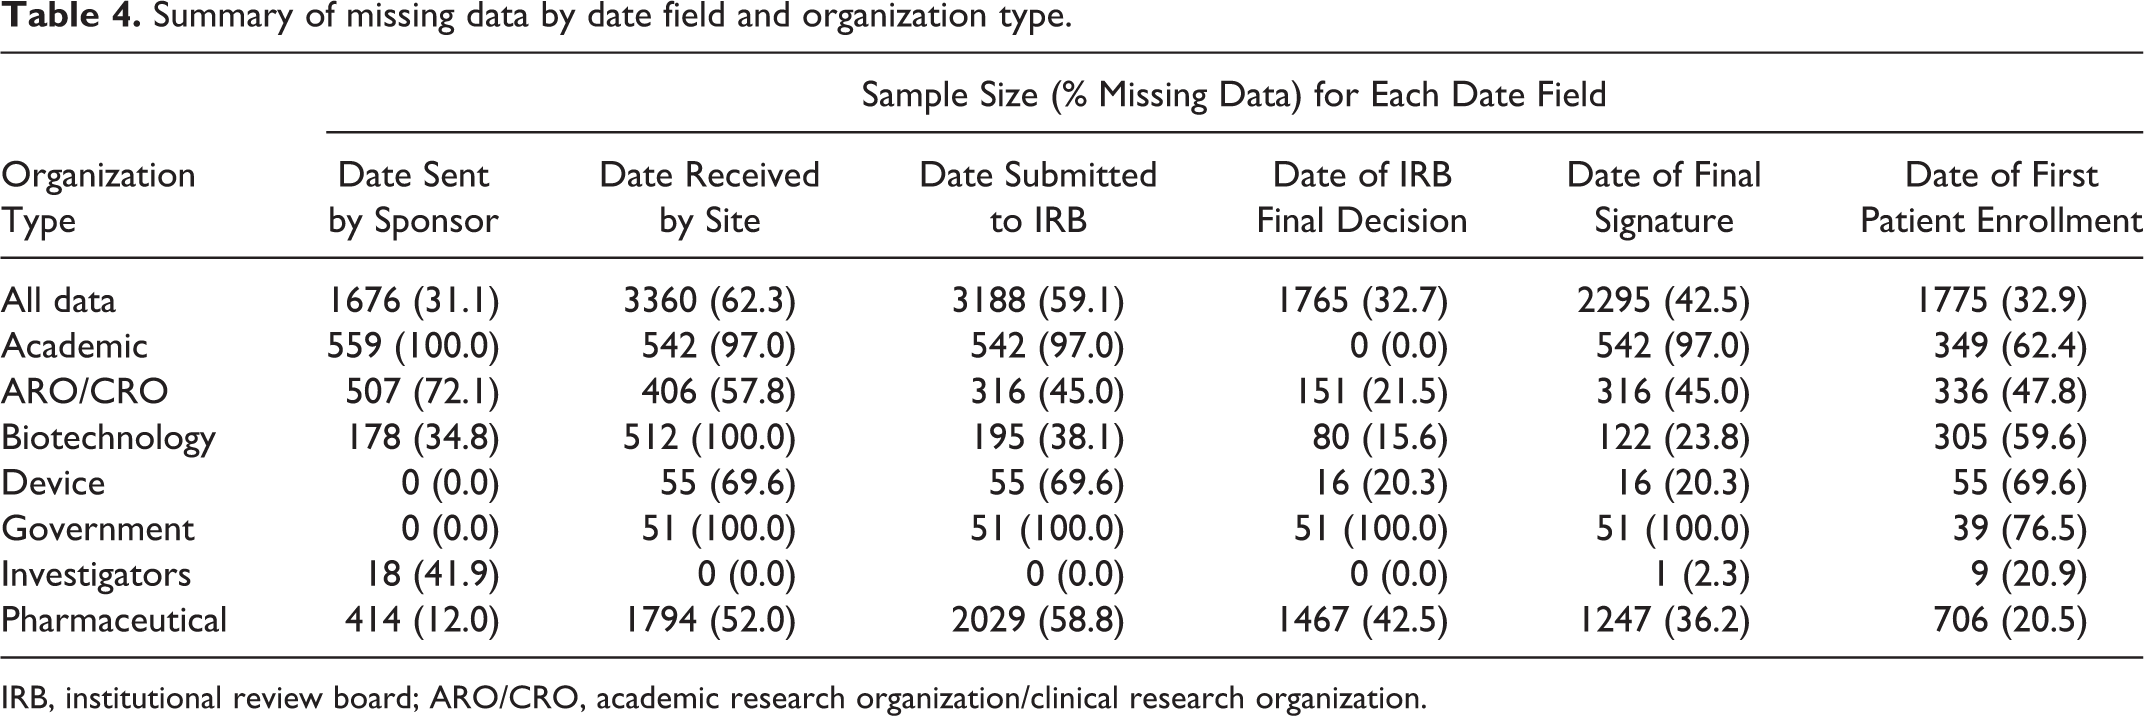
IRB, institutional review board; ARO/CRO, academic research organization/clinical research organization.
Cycle time metrics are reported in Tables 5 and 6. Private practice and independent sites had the shortest elapsed times for site cycle, site to IRB cycle, site to contract cycle, site to patient cycle, and IRB cycle variables. However, these 2 types of sites had the greatest elapsed time for the postcontract to patient cycle.
Cycle time metrics, part 1.
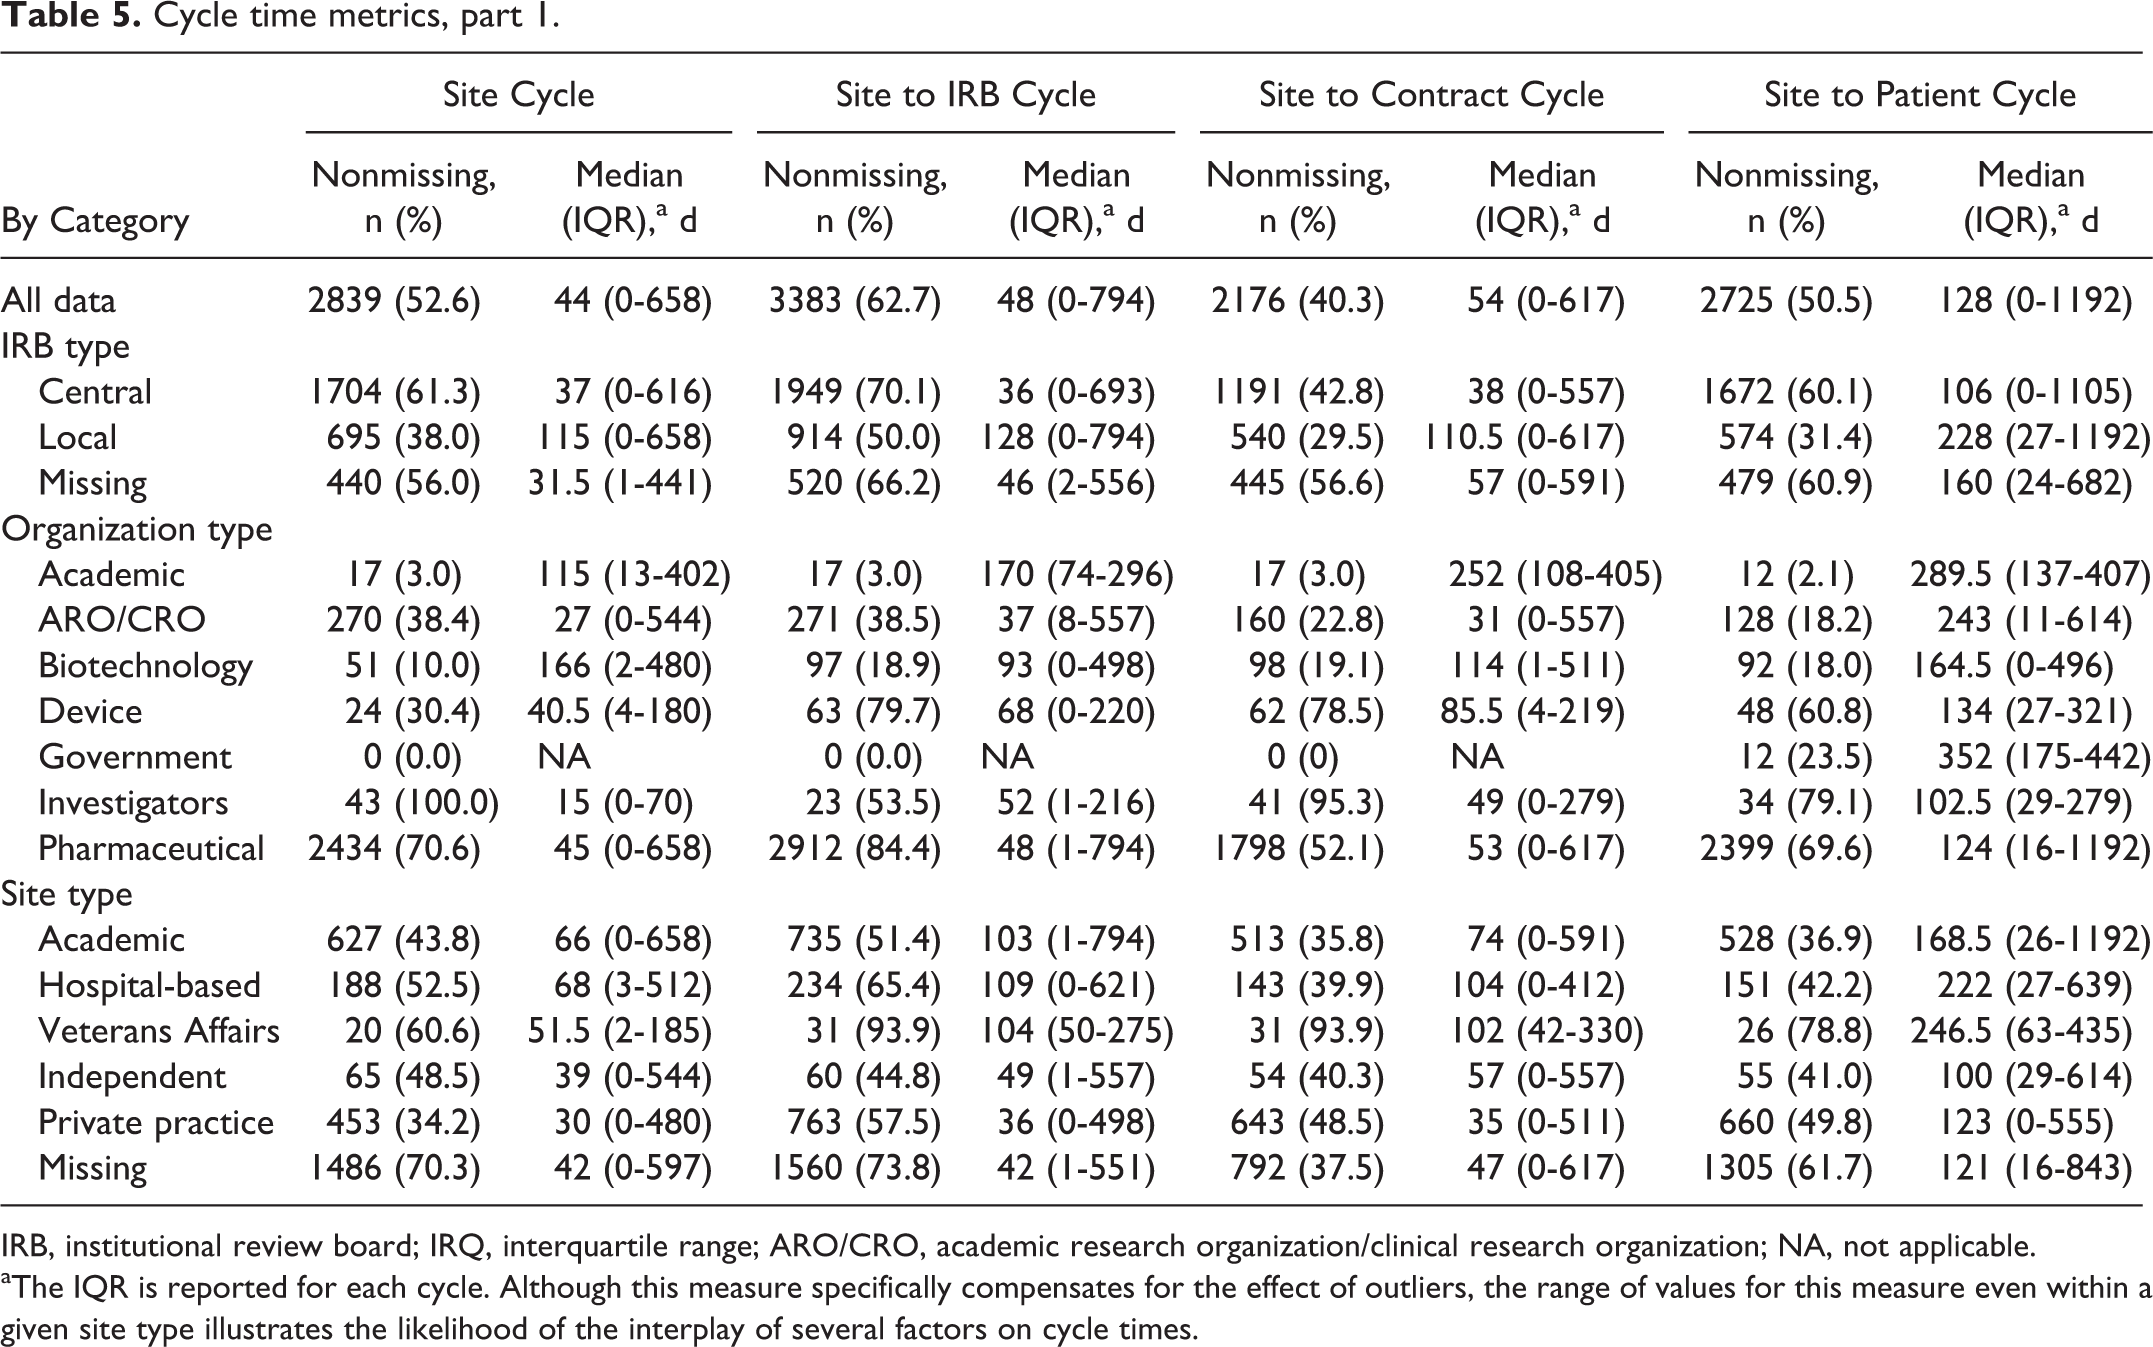
IRB, institutional review board; IRQ, interquartile range; ARO/CRO, academic research organization/clinical research organization; NA, not applicable.
aThe IQR is reported for each cycle. Although this measure specifically compensates for the effect of outliers, the range of values for this measure even within a given site type illustrates the likelihood of the interplay of several factors on cycle times.
Cycle time metrics, part 2.
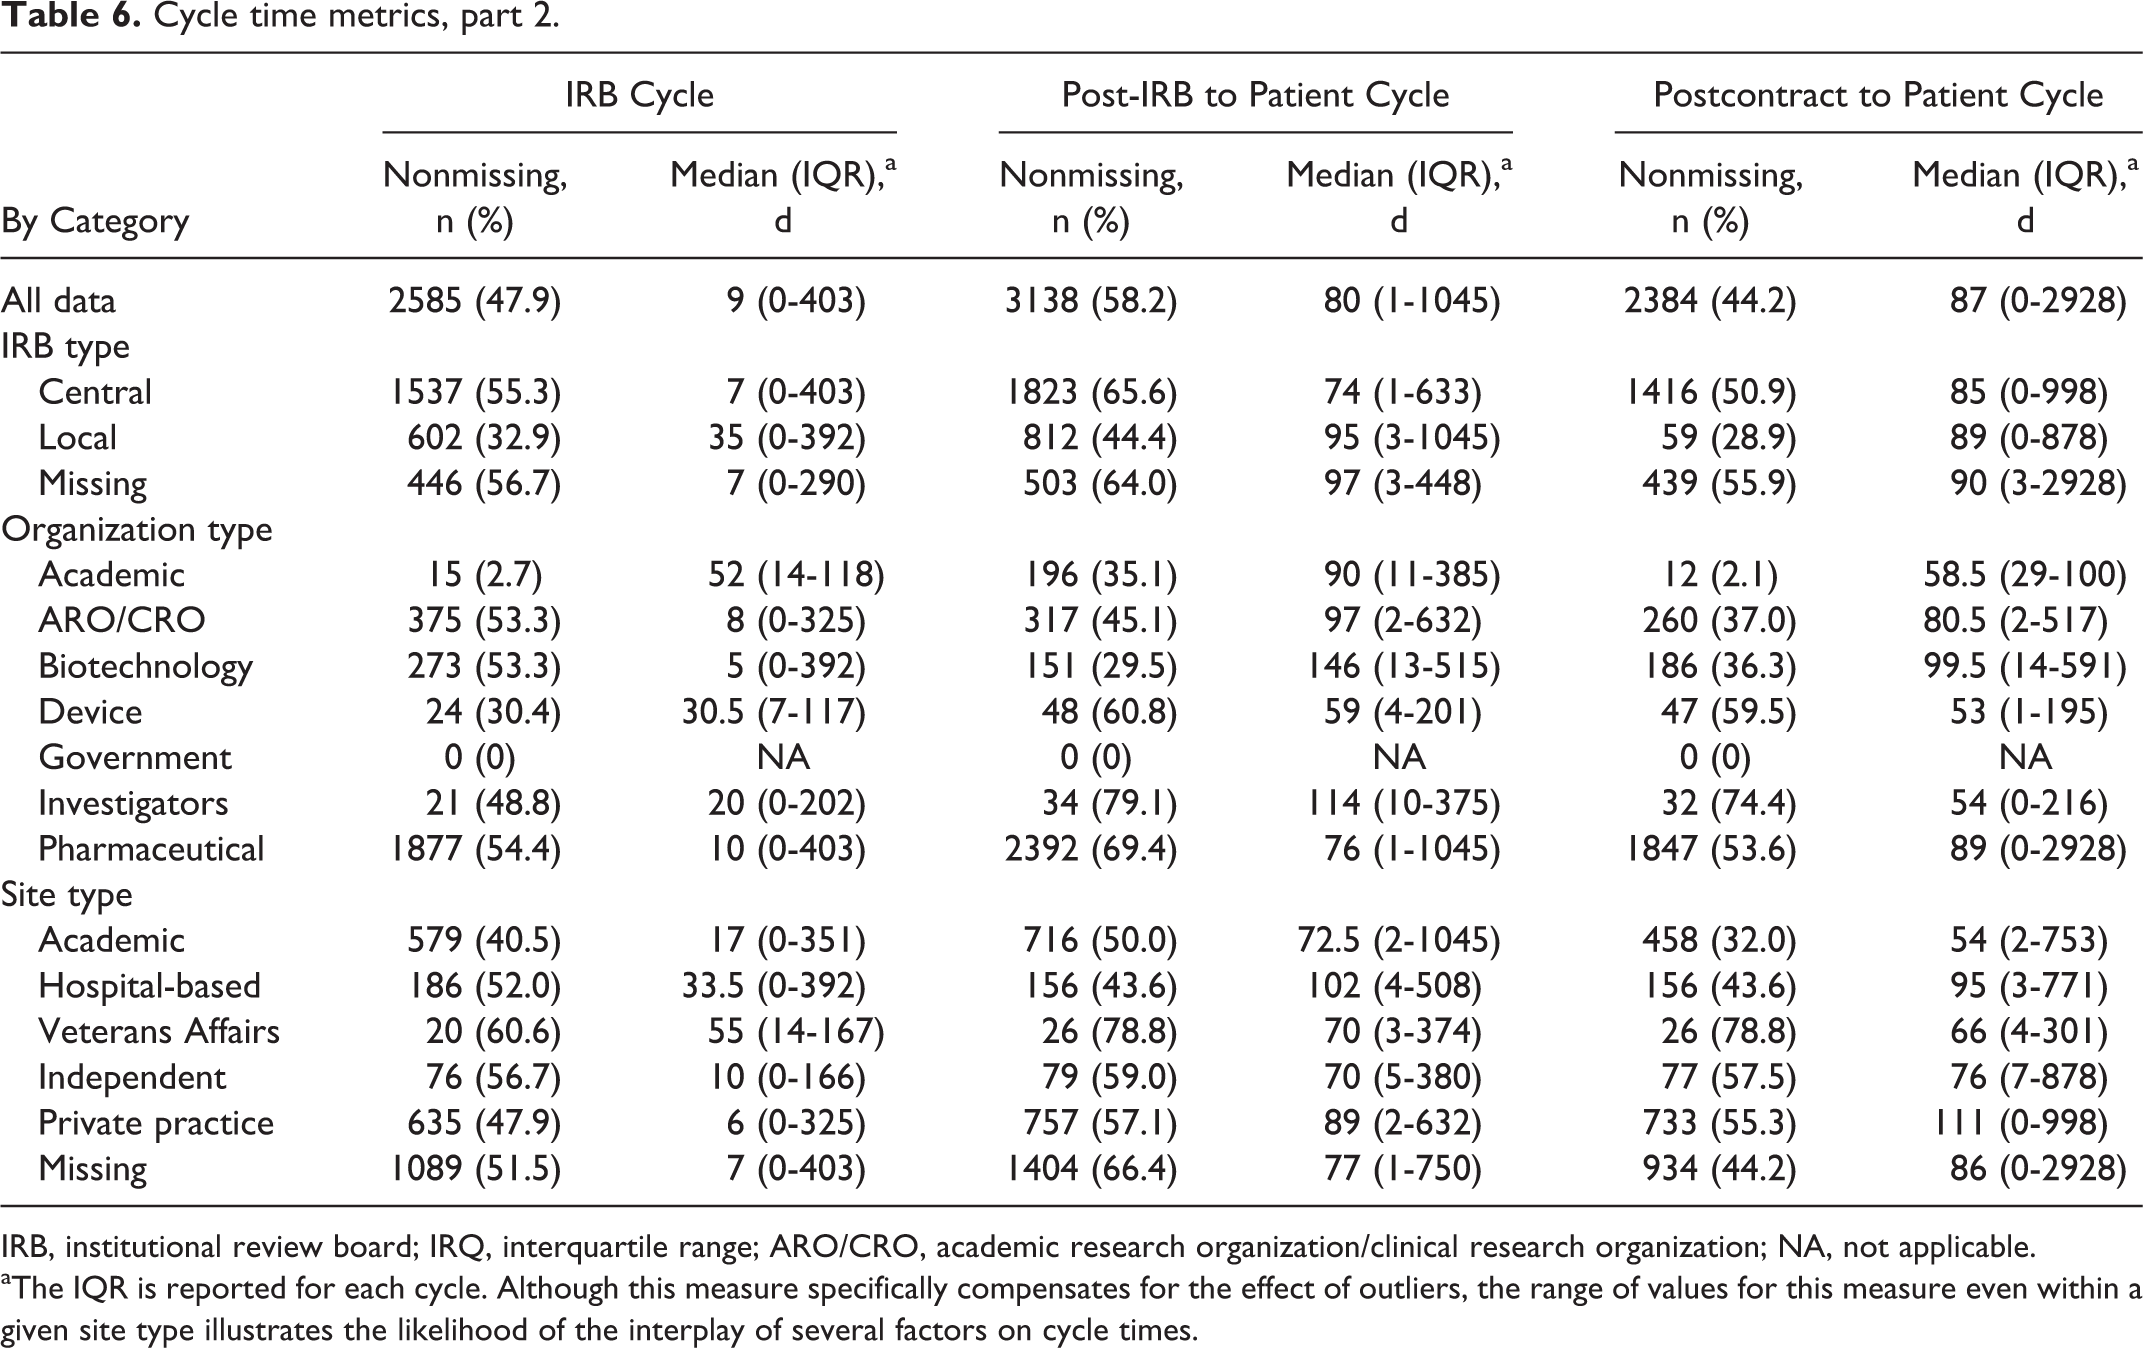
IRB, institutional review board; IRQ, interquartile range; ARO/CRO, academic research organization/clinical research organization; NA, not applicable.
aThe IQR is reported for each cycle. Although this measure specifically compensates for the effect of outliers, the range of values for this measure even within a given site type illustrates the likelihood of the interplay of several factors on cycle times.
Figure 1 summarizes significant findings of the cycle time analysis for all data and for the data by site type and IRB type for 4 cycles of particular interest: site to IRB cycle, IRB cycle, postcontract to patient cycle, and site to patient cycle. The dashed vertical lines indicate the divisions between the “all data” classification, site type classification, and IRB type classification in the graph. The median time for site cycle was 44 days (IQR, 0-658 days), with significantly lower median times of 30 and 39 days for private practice and independent sites, respectively, compared with higher median times of 51.5, 66, and 68 days for VA, academic, and hospital-based sites, respectively (Kruskal-Wallis, P < .001). Site to IRB cycle and site to patient cycle both showed the same trend of significantly lower median times for private practice and independent sites compared with VA, academic, and hospital-based sites (P < .001 for both).
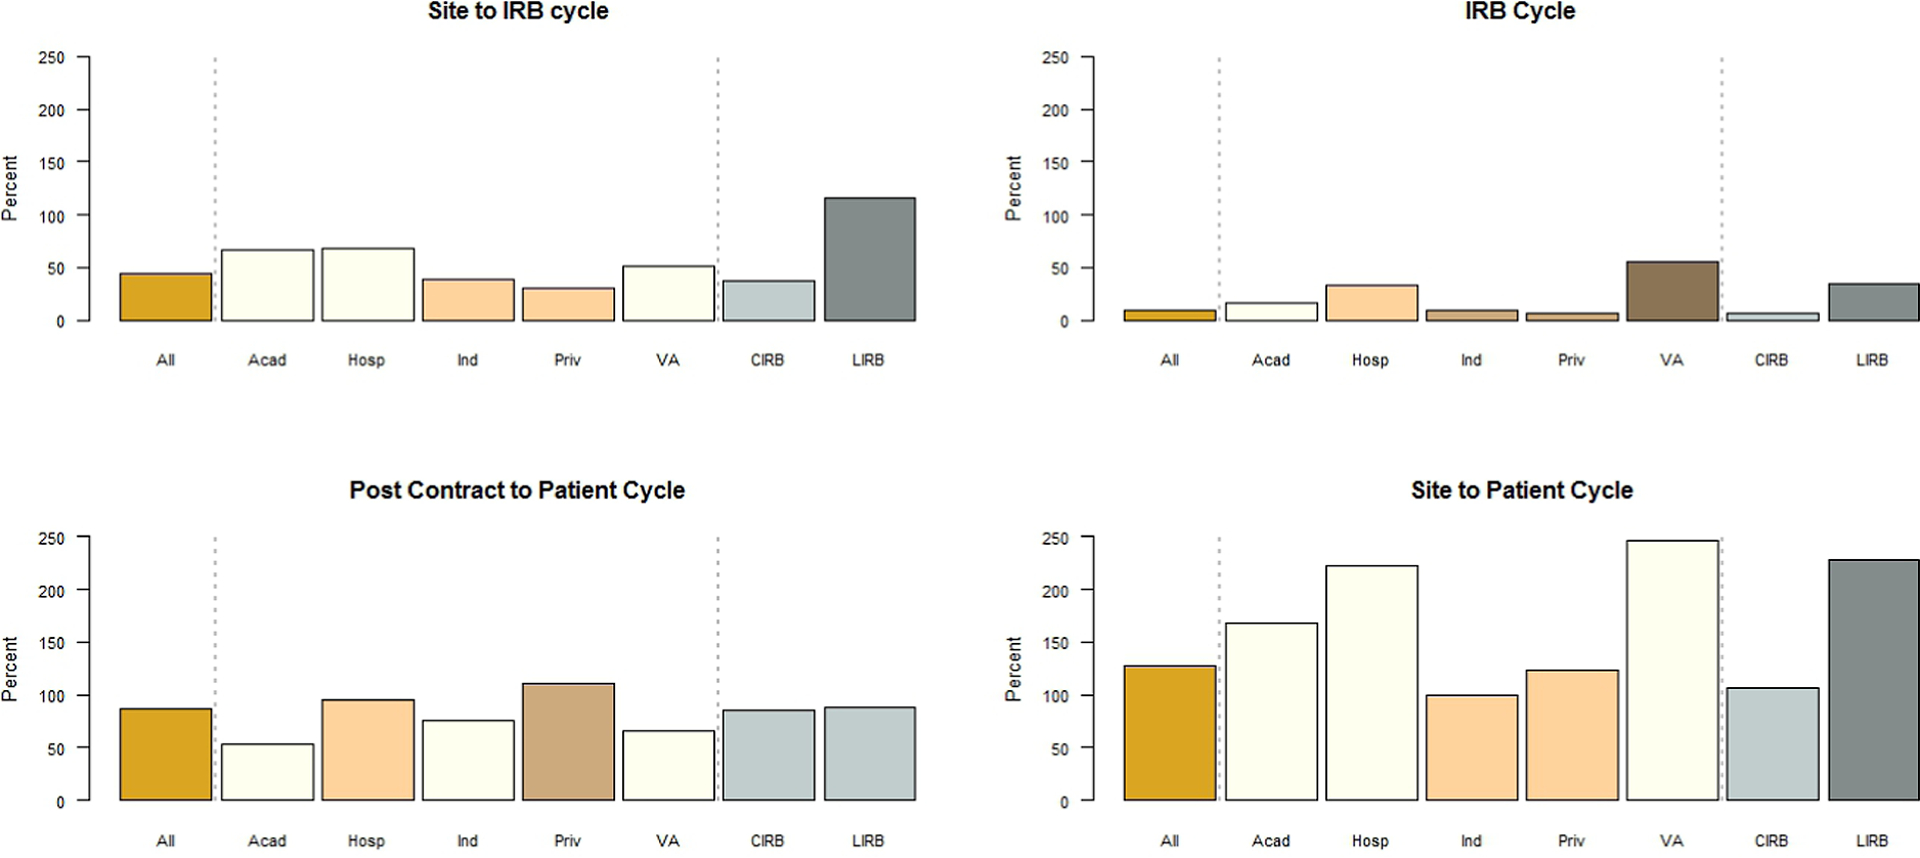
Median cycle times for all data and for data by site type and IRB type.
Site type was also significantly associated with site to contract cycle (P < .001), with private practice sites (median, 35 days) significantly differing from all other site types (median, 57, 74, 102, and 104 days for independent, academic, VA, and hospital-based sites, respectively). Site type and IRB cycle were also significantly associated (P < .001). Private practice and independent sites had significantly lower median times (6 and 10 days, respectively) compared with academic sites (17 days), which in turn had a significantly lower median time than hospital-based sites (33.5 days), which was itself significantly lower than VA sites (55 days). While post-IRB to patient cycle was significantly associated with site type (P < .001), additional analysis failed to identify any distinguishable groupings among the different sites. Last, postcontract to patient cycle also showed a significant difference based on site type, with academic, VA, and independent sites showing significantly lower median times compared with hospital-based sites, which in turn showed significantly lower median times than private practice sites (P < .001).
Six of 7 cycle time variables were significantly associated with IRB type (P < .001); postcontract to patient cycle was the only one that did not attain significance (P = .45). For all other defined cycles, use of CIRBs was associated with significantly shorter cycle times.
Discussion
The results of our retrospective analysis illustrate the need for improvements in data capture before SSU can be rigorously characterized and investigated and a reliable baseline established. The definitions that we provided were not sufficiently detailed, and many data elements were not routinely captured—factors that highlight the limitations of our understanding SSU metrics for the CTE as a whole. Although we identified factors significantly associated with reduced cycle times, the small sample sizes for many subcategories, large proportions of missing data, and lack of standard data element definitions limit the interpretability of these results. Furthermore, since only 54.3% of invited CTTI organizations participated in this study, the generalizability may be limited, particularly if nonresponding organizations were different in some way from those that responded.
However, our study shows that lengthy SSU cycle times are prevalent within the current US CTE. Ample documentation exists that a much more efficient system will be needed to provide the evidentiary basis for new product development 7 and for informing clinical practice; currently, more than 85% of clinical practice guideline recommendations in the US lack high-quality supporting evidence. 10 , 11 In addition, numerous recent examples of erroneous clinical practices 12 underscore the deleterious effects that operational inefficiencies of multisite clinical trials have on the public health since decisions and recommendations will be made even if evidence does not accrue to supply appropriate evidence for practice.
Despite the large amount of missing data in this retrospective analysis, there was a clear association between IRB type and cycle time metrics. For 6 of the 7 cycle times investigated in this study (site cycle, site to IRB cycle, site to contract cycle, site to patient cycle, IRB cycle, and post-IRB to patient cycle), CIRBs had significantly shorter cycle times compared with local IRBs. For example, CIRBs took an average of 7 days to reach a decision on protocols submitted for final review compared with 35 days for local IRBs. These significant differences could reflect more efficient processes employed by CIRBs and industry or could be due to the types of trials and centers that tend to use CIRBs rather than local IRBs. A prospective analysis of data collected across multisite organizations could identify the cause of these differences.
Our data also suggest variations in cycle times by sponsor and site type. For all cycles except post-IRB to patient, significant differences in cycle time by site type were observed. Follow-up analysis revealed that academic, hospital-based, and VA sites generally had longer cycle times than did independent and private practice sites. For example, the site to patient cycle took an average of 168 to 247 days for academic, hospital-based, and VA sites compared with an average of 100 to 123 days for independent and private practice sites. Prospective analysis of SSU data across site types may elucidate the causes of these differences. One possible explanation for this difference is that site type and study type are correlated. For example, the sites with longer site to patient cycle times could be due to a site conducting in-patient studies in which research participants cannot be actively recruited, such as occurs in surgical studies for instance.
Various research articles have explored factors affecting SSU time. 13–21 Dilts and colleagues 15–19 examined SSU for cooperative groups involved in oncology trials, rigorously identifying hundreds of distinct processes and working steps and the subsequent decision points, processing loops, and stopping points between concept initiation and trial activation. In a recent publication, Dilts et al 19 noted that improvements to both the quality of the processes and to the time required to develop clinical trials should be made collaboratively and not in isolation.
While certain SSU subprocesses (such as IRB processes) dominate the literature, 22–31 this study is unique in seeking to identify the locus of potential SSU obstacles along the continuum from the time that a protocol is first sent to a site to the time of first patient enrollment. Although specific populations (eg, phase 3 oncology trials) have been studied in depth, such studies have not hitherto been attempted in broader populations that cross therapeutic areas and center-specific processes. 13–21 Thus, the broad scope of the present study allowed us to identify several critical elements that contribute significantly to SSU time.
Prospective Study: Data Elements and Cycle Time
While our retrospective data analysis identified important trends in SSU, a well-planned, clearly defined prospective analysis is needed to overcome limitations of the retrospective analysis and elucidate the root causes of these trends, some of which may have far-reaching effects. Longer start-up times are problematic for patients and providers, for companies trying to develop treatments, for persons formulating policy, and for the US economy. Based on our findings, we recommend measuring key intervals in the cycle as a standard for performing multisite trials. At the site level, this provides metrics for internal quality assurance and improvement and helps ensure sponsor integrity. In addition, these metrics will allow sponsors to identify high-performing sites and reward them by selecting them for future studies, thus yielding additional cost savings for sponsors. Finally, at the level of the national CTE, this standard will help us quantify the efficiency of the enterprise and identify areas that need improvement.
When subject matter experts gathered at the May 2011 meeting described above, participants agreed that the following key data should be collected for US sites participating in multicenter trials: (1) the date the final protocol was sent to the site, (2) the date of the IRB’s decision (both local IRBs and CIRBs), (3) the date the contract was sent to the site (applies to the initial draft contract template only and does not include a separate budget metric), (4) the date the site contract was executed (ie, the date that the final signature is obtained after agreement of terms from both the sponsor and the site), (5) the date of site activation (the date upon which the site has full permission to enroll after completion of all contractual, regulatory, and prestudy start requirements), and (6) the date of the first patient’s consent (the date of the first signed informed consent form for the protocol at the site). Standard definitions for key data elements were also agreed upon and are listed in Supplementary Table S1.
Cycle time metrics for this prospective quality improvement system could be defined as the time elapsed between each of the elements described above as well as composite elapsed times. Additional date-related elements that impose additional data collection burdens on sites will be considered at a later time. These elements include the following: the date the protocol was received by the site, the date the sponsor executed the contract, dates of drug supply milestones, dates of regulatory compliance/approval components, dates of budget negotiation milestones, and dates of protocol amendments.
Meeting participants also identified a key question affecting multicenter SSU: What is the interval between a site receiving a final protocol and enrolling the first participant? Follow-up questions include the following: (1) After a site receives a final protocol, how long until all patients are enrolled at that site? (2) What is the interval between formulating a research question and answering it? Answering these questions will require that we determine how best to measure such broad “outcomes” without incorporating detailed process metrics that vary considerably among sites. Meeting participants elected to collect data that capture a “big picture” overview and then assess gaps in an iterative fashion.
Limitations
Despite our attempts to provide simple data element definitions, certain fields proved problematic for many collaborating centers, and extensive data cleaning was required. Many data elements were missing, although blank fields were evaluated to see whether missing data could be reasonably derived from other data fields, for example, identifying the site type from the site’s name or calculating actual dates from elapsed times. Sites may also have used their own data definitions, especially for trials that crossed therapeutic areas, thereby confounding classifications. In addition, sites and sponsors may have reported the same trial more than once, thus skewing the findings. Our data collection methods collected the date the protocol was sent by the sponsor or CRO but did not collect information regarding protocol amendments. Understanding the role that amendments have on the SSU process is worth additional research. Lastly, only cycle time was assessed in this study. The quality of the process was not investigated, a particularly relevant point with regard to IRB processes.
Conclusion
In summary, we found that the US CTE is not collecting standardized measures of cycle times, although such practice is routine in most other industries. Although problems with data quality limit the robustness of our conclusions, CIRB use is clearly associated with shorter cycle times compared with local IRBs, and private practice and independent sites initiate trials faster than other types of sites. To furnish the knowledge needed to support evidence-based health care, the US CTE should develop standard measures of efficiency and focus on systematic reforms to provide this crucial evidence in a timely manner. By convening a meeting of subject matter experts to identify and define critical data elements that should be prospectively collected across sites, we have taken a first step in this direction. Continued collaboration across stakeholder groups will enable progress in both measuring and improving the SSU process.
Footnotes
Supplementary material for this article is available on the journal’s website.
Declaration of Conflicting Interests
The author(s) declared the following potential conflicts of interest with respect to the research, authorship, and/or publication of this article: Christine Pierre is president and owner of a site network, RxTrials. RxTrials manages clinical research sites.
Funding
Financial support for this work was provided by cooperative agreement U19FD003800 from the US Food & Drug Administration awarded to Duke University for the Clinical Trials Transformation Initiative.