
Abstract
Adolescent social adversity (discrimination, bullying) enhances paranoia—the perception others want to harm or upset you. In this preregistered study (AsPredicted No. 154322), we tested the impact of prior social adversity and current social exclusion on paranoia, self/other beliefs, and latent social-learning processes in UK mid-adolescents (15–17 years, N = 502). In an experimental design, participants completed baseline social-adversity measures before random allocation to a social inclusion/exclusion manipulation (Cyberball), after which the Intentions Game assessed cognitive flexibility. We tested (a) whether adversity and exclusion interact to increase paranoia (b) via (mediated) negative self/other beliefs and (c) if this was moderated by cognitive flexibility. Social exclusion increased paranoia, which was intensified by prior social adversity and restricted learning rate in the Intentions Game. Negative self- and other beliefs mediated the link from social adversity to paranoia, but cognitive flexibility did not moderate. Three distinct discrimination-to-paranoia routes emerged. Findings highlight possible explanatory and intervention targets for reducing adolescent paranoia.
Keywords
Social adversity (e.g., discrimination, bullying, trauma) during childhood and adolescence increases the risk of developing a range of mental-health problems, including serious and enduring conditions (Bloomfield et al., 2021; Lewis et al., 2019; Varese et al., 2012). Paranoia—the belief that others intentionally want to cause you harm (Freeman & Garety, 2000)—is a central feature of psychosis but also exists in an attenuated form in the general population (Bebbington et al., 2013). Paranoia is common in adolescents, with elevated rates reported in 20% to 30% of general population samples (Kingston et al., 2022). Adolescents report that paranoia is distressing and has a significant negative impact socially, personally, educationally, and prospectively on reduced self-esteem and well-being (Bird et al., 2022; Gonzálvez et al., 2022; Kingston et al., 2022). Paranoia occurs alongside numerous mental-health symptoms and is one of a small cluster of symptoms that pose a pluripotent risk for multiple future psychiatric disorders (Bird, Freeman, & Waite, 2022). Social adversity is a reliable and replicable risk factor for paranoia in adolescents (Kingston, Ellett et al., 2023; Kingston et al., 2025), but the mechanisms that account for this are poorly understood. Identifying how social adversity affects vulnerability to paranoia in adolescents is a vital area for research and has the potential to identify tractable, early intervention treatment targets (Bloomfield et al., 2021).
Based on existing models of paranoia in adults (e.g., Freeman et al., 2005; Kesting & Lincoln, 2013) and the development of social cognition during adolescence (Kilford et al., 2016), the theoretical model of unhelpful suspicious thoughts (TRUST) in adolescents (Kingston & Taylor, under review) proposes that psychological and physiological changes during adolescence precipitate a developmental spike in social-evaluative concerns, suspicion, and mistrust. Although for many this is transient, for some, this will escalate into increasingly severe paranoid beliefs. Social adversity is hypothesized to be one key risk factor for this escalation, partly by fostering negative self- and other beliefs, which become activated by everyday stressors, such as social exclusion or peer rejection (Kesting & Lincoln, 2013; Kingston & Taylor, under review). Kingston and Taylor (under review) identified altered flexibility in belief updating (“cognitive flexibility”) as one important psychological mechanism. Low cognitive flexibility is characterized by an overreliance on prior beliefs and preferences for processing incoming information; rather than learning about others via real-time incoming information (i.e., their behavior, how they are interacting with you), the individual unduly relies on preexisting and generalized beliefs about others, perpetuating an impression of others as hostile by disrupting normal belief-updating processes. Thus, we propose that affected adolescents may miss signs of others being prosocial, trustworthy, and cooperative, instead misinterpreting them in line with preexisting negative other beliefs (e.g., self-serving, competitive, and hostile; Ellett et al., 2013; Rusch et al., 2020).
Prior work building on existing models of cognitive flexibility in adults (Barnby, Dayan, & Bell, 2023; Moutoussis et al., 2016; Tarantola et al., 2017) has examined the degree to which participants rely on their own preferences to make sense of others and how “flexibly” they can move away from prior knowledge to incorporate new observations (Barnby et al., 2025). Using a dynamic social-value-orientation (SVO; Murphy et al., 2011) paradigm, adults can be hypothesized to use two key processes to make sense of their own choices and the choices of others: self-insertion (the assumption that “you will act like me”; Andersen & Chen, 2002) and social contagion (the process whereby “I become more like you after observing you”; Deutsch & Gerard, 1955; Toelch & Dolan, 2015). The extent to which social adversity affects cognitive flexibility and the interplay between this and paranoia in adolescence remain unknown.
In the present study, we examined the impact of prior social adversity (bullying, discrimination, adverse life events [ALEs]) and current (manipulated) social exclusion on state paranoia in adolescents (15–17 years). Social exclusion is an ecologically valid social stressor that reliably triggers paranoia in adults (Ellett et al., 2023) and has specific relevance to adolescents, who are attuned to and often preoccupied with acceptance versus rejection. Social exclusion benefits from its capacity to be experimentally manipulated in laboratory settings, standardizing the exposure across participants and enabling an examination of when and how paranoia unfolds in analogue conditions. We used Cyberball (K. D. Williams & Jarvis, 2006), a well-established paradigm in which participants are either included or excluded from a virtual ball-throwing game based on the number of throws programmed for them to receive from other players.
Based on the aforementioned theoretical ideas, we hypothesized the following:
Hypothesis 1: Exposure to prior social adversity will be associated with higher state paranoia following Cyberball irrespective of condition (inclusion/exclusion).
Hypothesis 2: Paranoia will be greater following exclusion versus inclusion.
Hypothesis 3: Social adversity and Cyberball exclusion will interact such that state paranoia will be higher in participants with prior social adversity and current Cyberball exclusion.
Hypothesis 4: State paranoia will be associated with negative self- and other beliefs.
Hypothesis 5: Negative self- and other beliefs will mediate the association between social adversity and paranoia.
Hypothesis 6: State paranoia following exclusion will be associated with lower latent cognitive flexibility (overreliance on prior beliefs and insensitivity to incoming information about the other).
Hypothesis 7: More specifically, the link between social adversity and paranoia will be mediated by negative self/other beliefs when latent cognitive flexibility is low but not high.
For a simple visual representation, see Figure S1 in the Supplemental Material available online. Exploratory analyses, analogous to prior work (Barnby et al., 2025), also investigated the impact of paranoia and exclusion on social-learning processes.
Transparency and Openness
Preregistration
The study hypotheses, design, and analysis plan are preregistered (AsPredicted No. 154322: https://aspredicted.org/hnt4-jtsz.pdf 1 ). In the results that follow, some exploratory analyses related to the Intentions Game have been added. To indicate this, the analyses are stated as exploratory.
Data, materials, code, and online resources
The data and code are publicly available (GitHub: josephmbarnby/adolescence_self_other_transfer: Data and code for Kingston, Ellett, Richards, Burgess, Barnby, 2025).
Reporting
We report how we determined our sample size, all data exclusions, all manipulations, and all measures in the study.
Ethical approval
The protocol was approved by an institutional review board, and the research was carried out in accordance with the provisions of the World Medical Association Declaration of Helsinki.
Method
Design and participants
A cross-sectional experimental design recruiting UK adolescents (15–17 years old; N = 502) via the Qualtrics online participant-recruitment service (with parent ascent) was conducted. The hypothesized independent variable was prior exposure to social adversity (bullying, discrimination, ALEs). Following assessment of this, participants were randomly assigned to a current inclusion or exclusion manipulation using Cyberball. The hypothesized mediator was a state assessment of negative self- and other beliefs (assessed in the context of Cyberball; see measures), and the dependent variable was state paranoia (also assessed in the context of Cyberball; see measures). The hypothesized moderator was cognitive flexibility, assessed after Cyberball, using the Intentions Game (described below) and indexed as an overreliance on prior beliefs and insensitivity to incoming information about the other.
For small effect sizes of 0.2 between groups on continuous parameters from both behavioral and model-derived estimates to be detected per condition (exclusion/inclusion), with a power of 80% and an alpha of .05 (Cohen, 1992), we required a minimal sample size of 785 participants; we were able to recruit 502 participants after exclusions, allowing us to detect effect sizes of 0.25. As detailed in the preregistration, participants were excluded if they did not complete all consents, failed attention and comprehension checks distributed within the questionnaires, responded in less than half of the median completion time, had a geographical location that does not correspond with the stated location, dropped out without completing all measures and tasks, did not fulfill age or quota conditions, had previously completed Cyberball, gave nonsensical responding to open-text boxes, and had unified responses. In line with our preregistration, we treated all data as valid aside from those identified as exclusions based on the above, meaning that outliers were maintained and managed via bootstrapped analyses. There were no deviations from these criteria.
Quota sampling ensured 50:50 gender and age distribution. One thousand twenty-five parents opened the survey link, and 877 parents and adolescents consented and completed questionnaires. Five hundred two also completed the Intentions Game. There were no significant differences on study variables when comparing participants who only completed questionnaires versus participants completing everything.
Measures and materials
Sociodemographic information
Participants completed measures on age, gender (male, female, trans female, trans male, gender queer, other), ethnicity (White, mixed/multiple ethnic group, Asian/Asian British/Asian America, Black/African/Caribbean/African American/Black British, other ethnic group), country of birth, socioeconomic status (“Compared to your friends, is your family richer, about the same, poorer or you don’t know?”), parent marital status (single, married, living with partner, with partner living separately, separated, divorced, widowed, other), self-reported mental-health status (“Do you have any mental health conditions confirmed by a doctor? (e.g., depression, anxiety, ADHD [attention-deficit/hyperactivity disorder])”; “What mental health conditions do you have? (list all that you know about)”; “Do you take any medication for a mental health condition? Which mental health conditions do you take medication for?”).
The Revised Green et al. Paranoid Thoughts Scale (RGPTS; Freeman et al., 2021), was used to characterize the sample regarding baseline paranoid beliefs. The RGPTS (18 item) assesses ideas of reference (IOR; eight items; e.g., “I spent time thinking about friends gossiping about me”; current sample: α = .94) and persecutory thoughts (10 items; e.g., “I was sure someone wanted to hurt me”; current sample: α = .96). Items are rated on a 5-point scale ranging from 0 (not at all) to 4 (totally); higher total scores (range = 0–40) indicate greater levels of paranoia. IOR scores are classified as average (0–9), elevated (10–15), moderately severe (16–20), severe (21–24), and very severe (25+). Persecutory-thought scores were as follows: average (0–5), elevated (6–10), moderately severe (11–17), severe (18–27), and very severe (28+).
The Adverse Life Events Scale (Tiet et al., 1998), a 25-item measure of ALEs in the last 12 months (e.g., “a close friend was seriously sick/injured”), was used. Participants rate occurrence (yes/no), and for instances of occurrence, subsequent questions assessed how negative the experience was and how affected they were. Established scoring procedures generated a total ALE score (0–25).
The Brief Self-Report Measure of Adolescent Bullying–Victimisation (Murray et al., 2021) assesses frequency of being bullied (e.g., “purposefully ignored”; “hit, bitten, kicked”) in the last 12 months. Higher scores (range = 0–25) indicate greater incidence. Current sample α = .80.
The Everyday Discrimination Scale (D. R. Williams et al., 1997) measures the frequency of discriminatory experiences over the last 12 months. Items range from mild (“treated with less courtesy”) to more chronic (“threatened or harassed”) experiences, and high scores (range = 6–30) indicate greater discrimination (current sample: α = .84).
State paranoia was assessed using an abbreviated (five items) version of the State Social Paranoia Scale (Freeman et al., 2007). We selected items most aligned with the definition of paranoia (intentional harm from others) over more generic items (“Someone in the game . . . was hostile towards me, would have harmed me in some way if they could, had it in for me, was trying to make me distressed, had bad intentions towards me”). Current sample α = .91.
Negative self- and other beliefs during Cyberball was assessed using an adapted version of the Brief Core Schema Scale (Fowler et al., 2006) in which participants rated single-word descriptions of their view of themselves and others during Cyberball (e.g., “During the game I felt . . . worthless, valuable; during the game the other players were . . . harsh, accepting”). Alphas for the current sample are as follows: positive other α = .96, positive self α = .95, negative other α = .93, and negative self α = .96.
Cyberball (K. D. Williams & Jarvis, 2006) is a well-established social-exclusion paradigm within which participants are either included (receive equal throws) or excluded (receive one and then no more throws) from a virtual three-person ball-throwing game. In both conditions, the game lasted 30 throws. Cyberball has been shown to reliably induce state paranoia in adults (Ellett et al., 2023).
The Intentions Game (Barnby et al., 2025; Fig. 1) is a variation on an SVO paradigm (Murphy et al., 2011) and has three phases. In Phase 1, participants were matched with an anonymous (pseudo) partner and over 36 trials decided how to distribute points when faced with 12 prosocial/competitive, individualistic/competitive, and prosocial/individualistic options (e.g., Option 1 = [10, 10], Option 2 = [10, 5]). Participants’ Phase 1 choices were classified as prosocial (preferring equal outcomes), individualistic (maximizing own payoff), or competitive (maximizing relative payoff difference at the cost of lower self-gain). The task environment balanced each type of choice pair (Table S1 in the Supplemental Material).
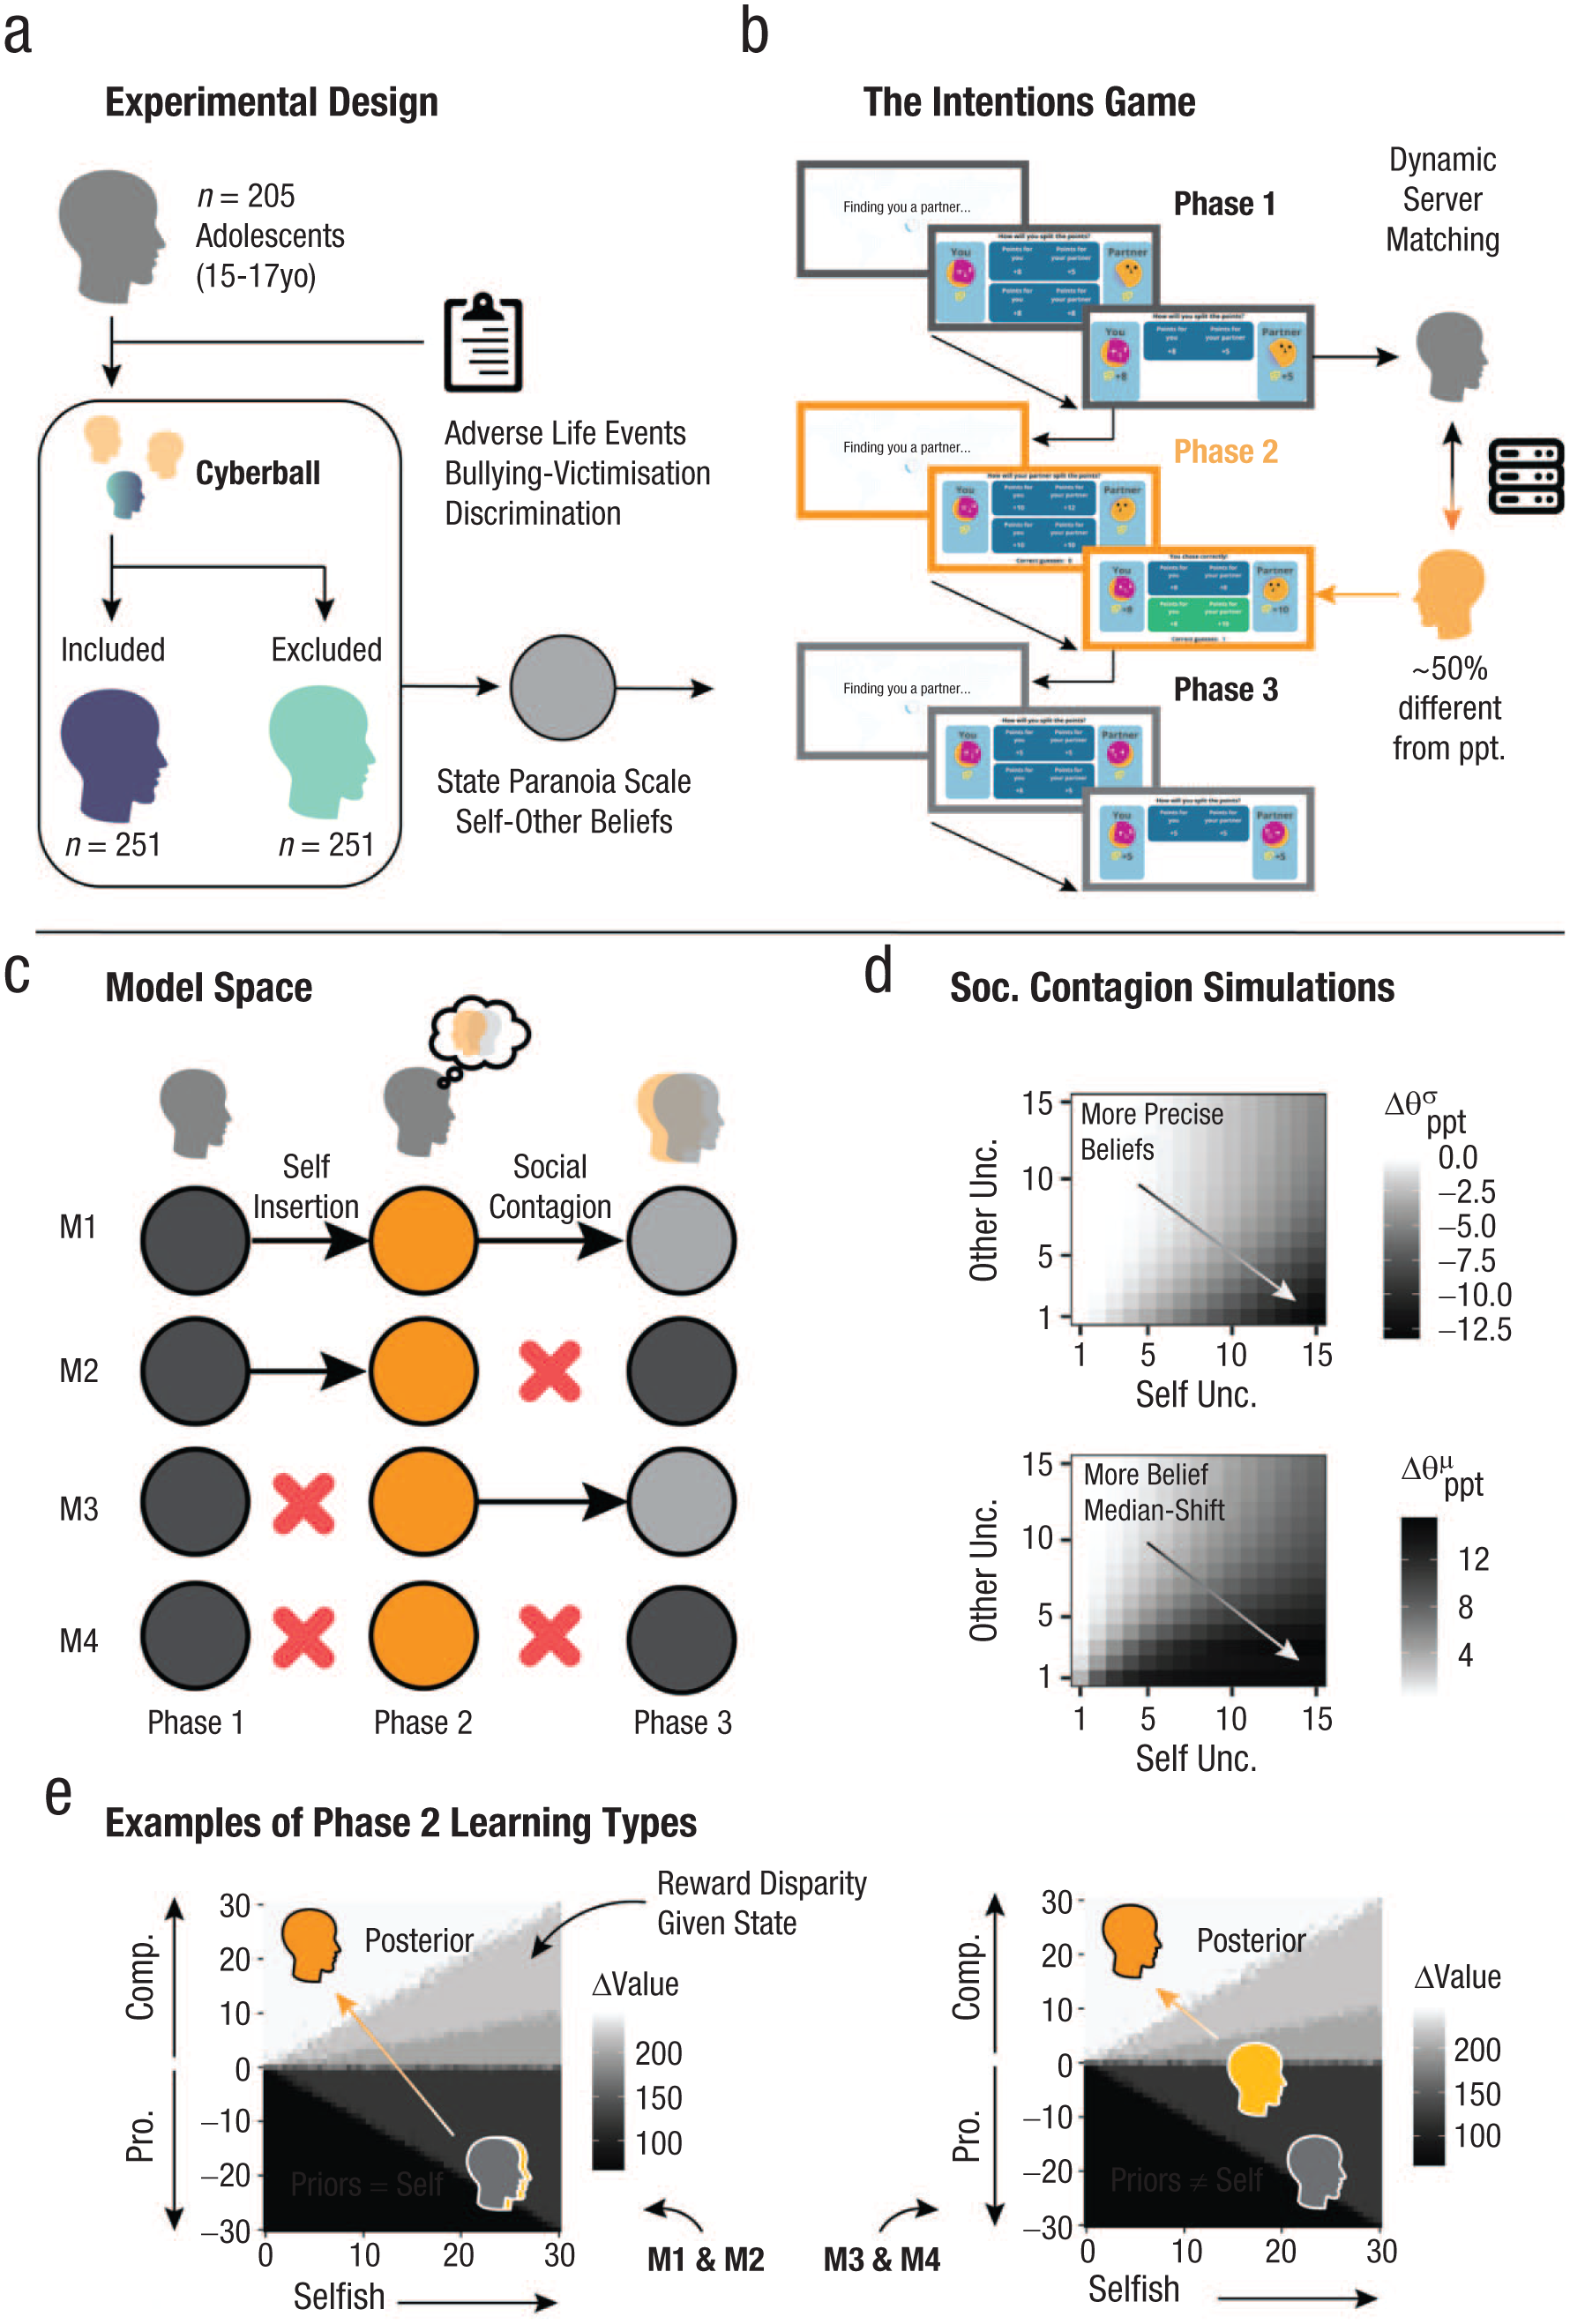
Visual illustration of study phases and computational modeling. (a) Five hundred two adolescents between the ages of 15 and 17 years old were recruited online using a stratified survey software. After filling out several psychometric ratings on adverse life experiences, bullying, discrimination, and negative self-other trait beliefs, they were randomly assigned to be either included or excluded from a Cyberball paradigm. Following the game, participants were asked to rate their current experience of paranoia using the State Paranoia Scale. Finally, participants played the Intentions Game. (b) Participants were invited to play a three-phase, repeated social-value-orientation paradigm—the Intentions Game—with virtual partners. Phase 1 of the Intentions Game lasted 36 trials and asks participants to make a forced choice between two options of how to split points with an anonymous virtual partner. An example of a prosocial-individualistic pair of options could be (self = 5, other = 5) or (self = 10, other = 5). If participants choose Option 1, they could be viewed as less individualistic and more prosocial because the outcomes to the other do not change but the self would earn less. In Phase 2, lasting 54 trials, participants were asked to predict the decisions of a new anonymous partner using the same two-forced-choice setup and the same option pairs; participants were given feedback on whether they were correct or incorrect in their prediction. We used Amazon Web Services to create a novel server architecture to match participants and (virtual) partners (Burgess et al., 2023). Partners in Phase 2 were matched to be approximately 50% different from the participants with respect to their choices in Phase 1 to ensure all participants needed to learn about their Phase 2 partner and to provide a mechanism to examine whether beliefs about partners had an effect on the self. Phase 3 was identical to Phase 1, although participants were informed that they were matched with a third anonymous partner, unconnected to the partners in Phases 1 and 2. At the end of the game, if participants collected more than 1,000 points overall, they were entered into a lottery to win a bonus. (c) We created four models that may explain the data and to test theories of social generalization. Model M1 assumes participants are subject to both self-insertion and social contagion, that is, participants used their own preferences as a prior about their partner in Phase 2, and partner behavior subsequently influenced participants’ preferences in Phase 3. Model M4 assumes participants are subject to neither self-insertion nor social contagion, instead forming a novel prior around the Phase 2 partner rather than using their own preferences and failing to be influenced by their partner after observation. Models M2 and M3 suggest participants are explained only by either self-insertion or social contagion, not both. (d) Simulating our model demonstrates how increasing uncertainty over self-beliefs (Self Unc.) and higher precision over partners (Other Unc.) causally draws participants more toward the beliefs of their partner in Phase 3 and increases their precision over their Phase 3 beliefs (Moutoussis et al., 2016). (e) We can also simulate the value differences of actions across all states, both prosocial-competitive (relative reward; y-axis) and selfish (absolute reward; x-axis). We then overlay a conceptual illustration of how our model demonstrates how (left) self-insertion or (right) no self-insertion during Phase 2. In essence, in self-insertion (Models M1 and M2), participants use their own preferences (estimated in Phase 1; gray) as a prior to learn about others (light orange). Following learning, this prior is then washed out to form a posterior (dark orange). In contrast, in the right figure, we show how the participants’ self-preferences (gray) are disconnected from their prior over partners in Phase 2 (light orange).
In Phase 2, matched with a new anonymous partner, participants acted as “recipient” over 54 trials. At each trial, participants were required to predict their partners’ choice between two options. After each prediction, participants were informed whether their prediction was correct or incorrect in line with what the partners actually chose. Trial numerical values for self and other were identical to Phase 1. Partners’ decisions were determined via a dynamic algorithm to ensure partners were approximately 50% different from the participants based on participants’ Phase 1 choices (Supplementary Text S1 in the Supplemental Material). Phase 2 included feedback on prediction accuracy and was incentivized for accuracy (accruing points).
Phase 3 mimicked Phase 1 except with a new (pseudo) anonymous partner, enabling us to estimate whether participants’ observation of their partner in Phase 2 influenced their choices in Phase 3. Accrued points, across phases, were summed and fed back to the participant at the end of Phase 3. One thousand or more points resulted in entry to a £20 Amazon-voucher lottery.
Cognitive flexibility was assessed through participants’ predictive accuracy during Phase 2. Predictions in Phase 2 depended on whether participants were able to move away from their own SVO determined in Phase 1 and adjust their beliefs about their partners’ social preferences based on ongoing feedback about the partners’ behavior.
Analysis plan
All analysis was conducted in R (Version 4.3.3; R Core Team, 2024) on a Macbook pro (M2 Max; OS = Ventura13.5).
Psychometric assessment
Preregistered hypotheses were assessed using linear models via stats package in R. Sum scores for each psychometric measure were used as individual values. The equations for these models were Ho1 = SP ≈ χi, where χ = [SPS, MABV, ALES]; Ho2 = SP ≈ Context (Cyberball-Excluded = 1; Cyberball-Included = 0); Ho3 = SP ≈ χi:Context; Ho4 = SP ≈ Negative Self (BCSS), SP ≈ Negative Other (BCSS), SP ≈ Negative Self:Negative Other; Ho5 =
For Ho7, we diverged from our preregistered analysis and used the lm package to conduct moderation analysis rather than the mediation package in R.
Behavioral analysis
All individual numeric values extraneous of statistical tests are reported with mean and standard deviation. All statistical tests in which dependent variables mapped one value to one participant (e.g., trait psychometric scores) were conducted as linear models in line with American Psychiatric Association reporting standards and includes the regression coefficient, 95% confidence interval (CI), test statistic (degrees of freedom), effect size (Cohen’s d), and p value. When dependent variables mapped multiple values to each participant (e.g., trial-by-trial accuracy or reaction time), random-effects linear modeling was used with ID as a random variable (using “[1|ID]” in regression models) to account for individual-level interdependence of observations. Correlations used Pearson estimates (r) or Spearman-ranked (ρ) for nonparametric.
Computational analysis
We compared four computational models (Models M1–M4; see Fig. 1 and Fig. S2 in the Supplemental Material) that could explain the Intentions Game data, centered around formal principles of self-insertion (Andersen & Chen, 2002; Krueger & Clement, 1994) and social contagion (Frith & Frith, 2000). In each case, cognitive representations of self and other are allowed to combine to form a new hybrid of the two for the purposes of computational efficiency and/or social bonding. Briefly, self-insertion was operationalized as the degree of transfer of a participant’s preferences from Phase 1 into the prior beliefs about a partner in Phase 2; social contagion is operationalized as the degree of mixture between the participant’s preferences in Phase 1 and a participant’s beliefs about the preferences of the partner in Phase 2. For the detailed formalism of this mapping, see the supplementary file in the Supplemental Material. Model M1 allows for both self-insertion and social contagion to occur. Model M2 allows for only self-insertion. Model M3 allows for only social contagion. Model M4 hypothesizes that participants use neither bias to make sense of their partners’ and their own preferences.
Over all three phases, we assumed participants and their partners used a Fehr-Schmidt utility function (Fehr & Schmidt, 1999) to calculate the utility of two options

Four models explained how participants used their own preferences (
Computational models were fitted using a hierarchical-Bayesian-inference (HBI) algorithm that allows hierarchical parameter estimation while assuming random effects for group and individual model responsibility (Piray et al., 2019). During fitting, we added a small noise floor to distributions (2.22e−16) before normalization for numerical stability. Parameters were estimated using the HBI in native space drawing from broad priors (μ
To conduct model recovery, we simulated synthetic participants (inclusion = 251, exclusion = 251) using their fitted parameters from the dominant model of the group (M3). We then performed model fitting with an identical procedure to the real behavioral data. We tested associations between model responsibility and individual parameters for the real and recovered models and the association between choices and predictions made by the model from simulation and the choices and predictions made by participants in each trial.
Differences between groups for individual-level parameters were estimated using hierarchical Bayesian general linear models. Differences in mean between groups (
Results
Sample characteristics
All participants were current UK residents. Most were born in the UK (n = 458, 91%); the remaining participants were born in Nigeria (n = 11), India (n = 6), Spain (n = 4), Italy (n = 3), Uganda (n = 2), Romania (n = 2), Hong Kong (n = 2), Pakistan (n = 2), and The Netherlands, China, Malaysia, South America, Saudi Arabia, Lithuania, Philippines, Ghana, Czech Republic, Poland, and Cyprus (n = 1 for each). Seventy-five percent were White, 10% were Asian, 9% were Black, 4% were mixed race, and 2% were other. The overall mean age was 15.96 years. Sample characteristics and baseline means (standard deviations) are reported in Table 1, split by condition. Cyberball-excluded versus Cyberball-included samples did not differ on age, gender, perceived social economic status, education (school/college/other), or prior social adversity. Ninety-eight (20%) participants self-reported a mental-health diagnosis (anxiety: n = 36; ADHD: n = 21; depression: n = 21; autism spectrum disorder: n = 15; anorexia/generalized anxiety disorder/ bipolar/seasonal affect disorder/posttraumatic stress disorder: n = 1 for each) for which n = 51 (50%) took medication. IOR scores were in the elevated range, and paranoid thoughts were in the moderately severe range.
Demographics and Psychometrics
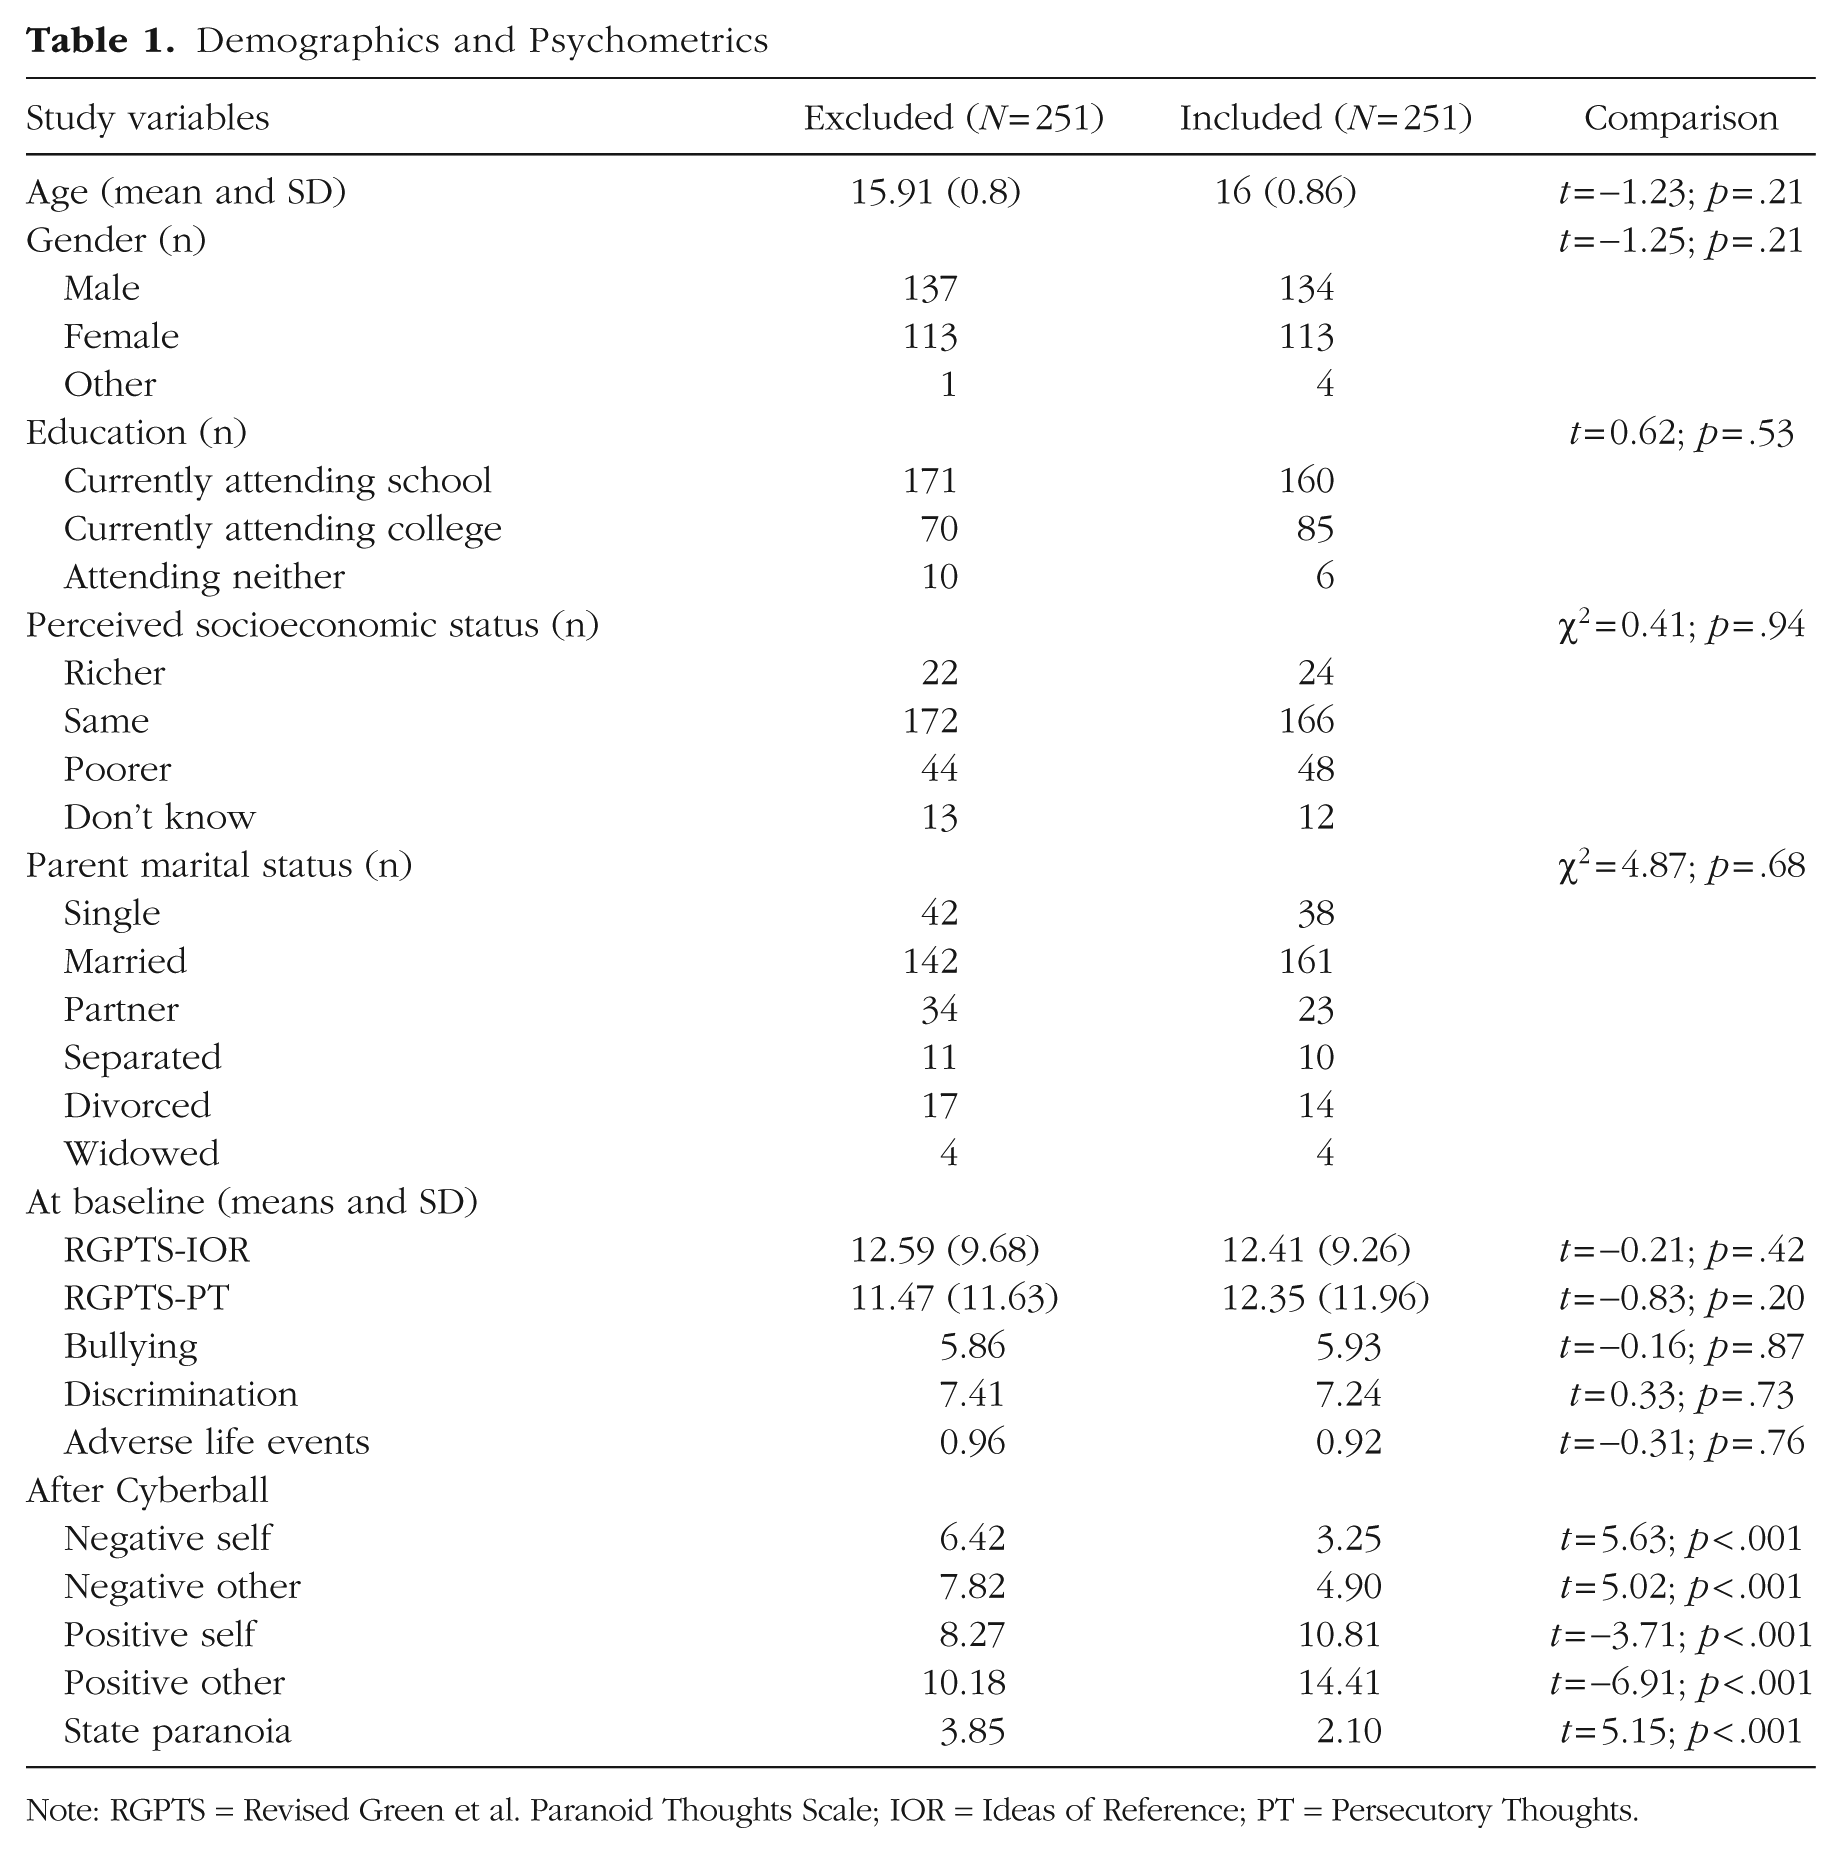
Note: RGPTS = Revised Green et al. Paranoid Thoughts Scale; IOR = ideas of reference; PT = persecutory thoughts.
Hypothesis testing
In line with our preregistration, we model each hypothesis individually to show individual effects and test for interactions (Ho3). Consistent with Hypothesis 1, state paranoia was significantly higher in participants reporting all types of prior social adversity (bullying: linear estimate = 0.27, 95% CI = [0.20, 0.35], t[500] = 6.92, effect size = 0.30, p < .001; discrimination: linear estimate = 0.24, 95% CI = [0.18, 0.29], t(500) = 8.69, d = 0.36, p < .001; ALE: linear estimate = 0.36, 95% CI = [0.15, 0.58], t[500] = 3.32, d = 0.15, p < .001). Consistent with Hypothesis 2, state paranoia was significantly higher after Cyberball exclusion versus Cyberball inclusion (linear estimate = −1.75, 95% CI = [−2.42, −1.08], t[499] = −5.16, d = −0.45, p < .001). Hypothesis 3 was tested via moderation and showed that Cyberball exclusion interacted with individual social adversities to predict elevated state paranoia (Table 2 and Fig. 2); bullying and discrimination was significantly associated with paranoia irrespective of Cyberball inclusion/exclusion, and ALEs were associated only with paranoia following Cyberball exclusion.
Interaction Between Prior Social Adversity and Current Exclusion on State Paranoia in Adolescents
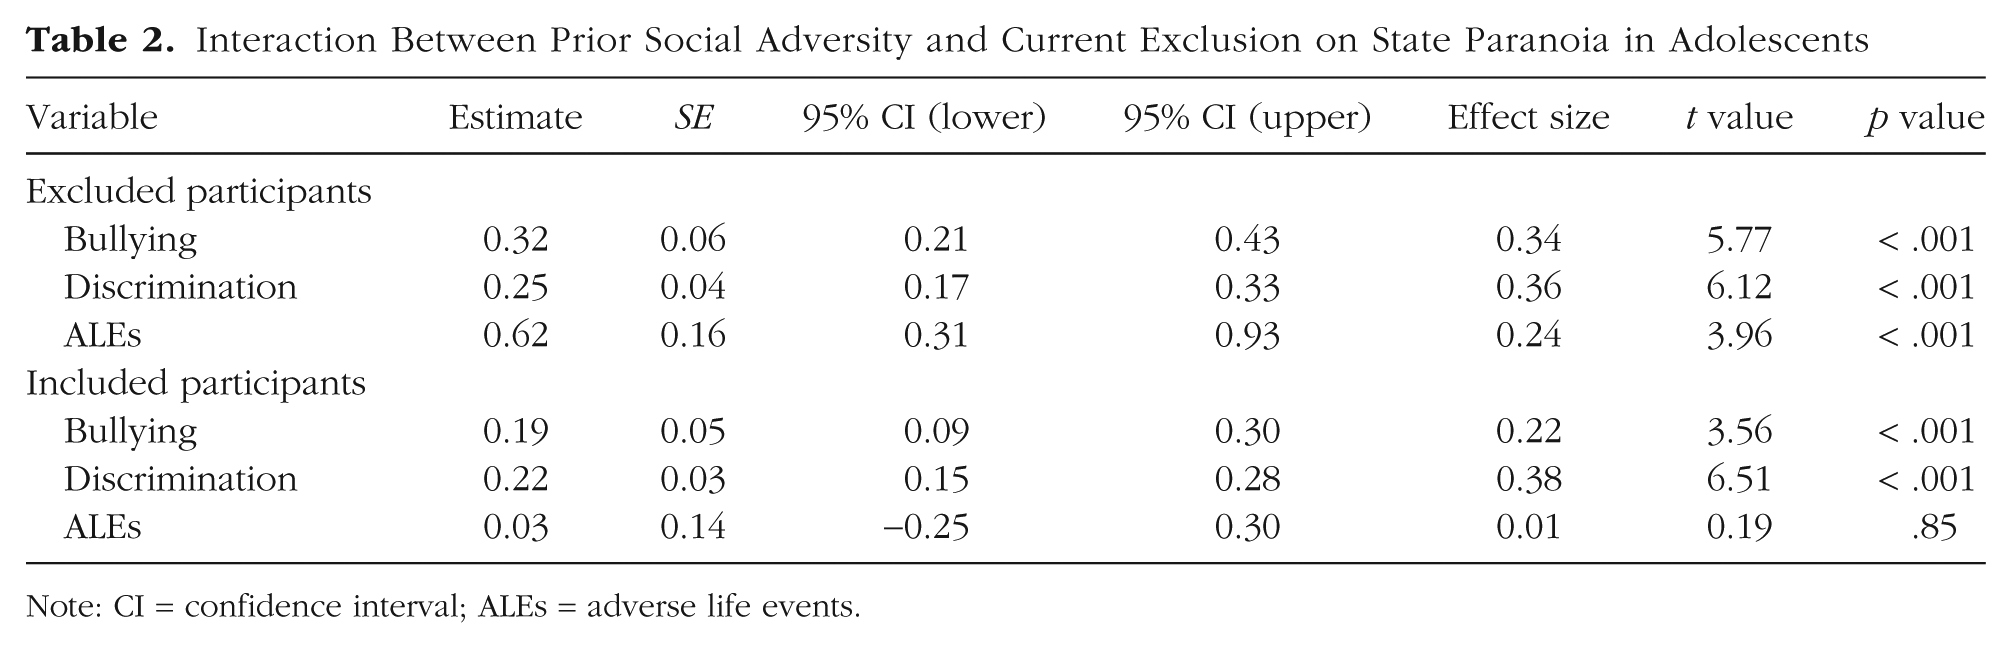
Note: CI = confidence interval; ALEs = adverse life events.
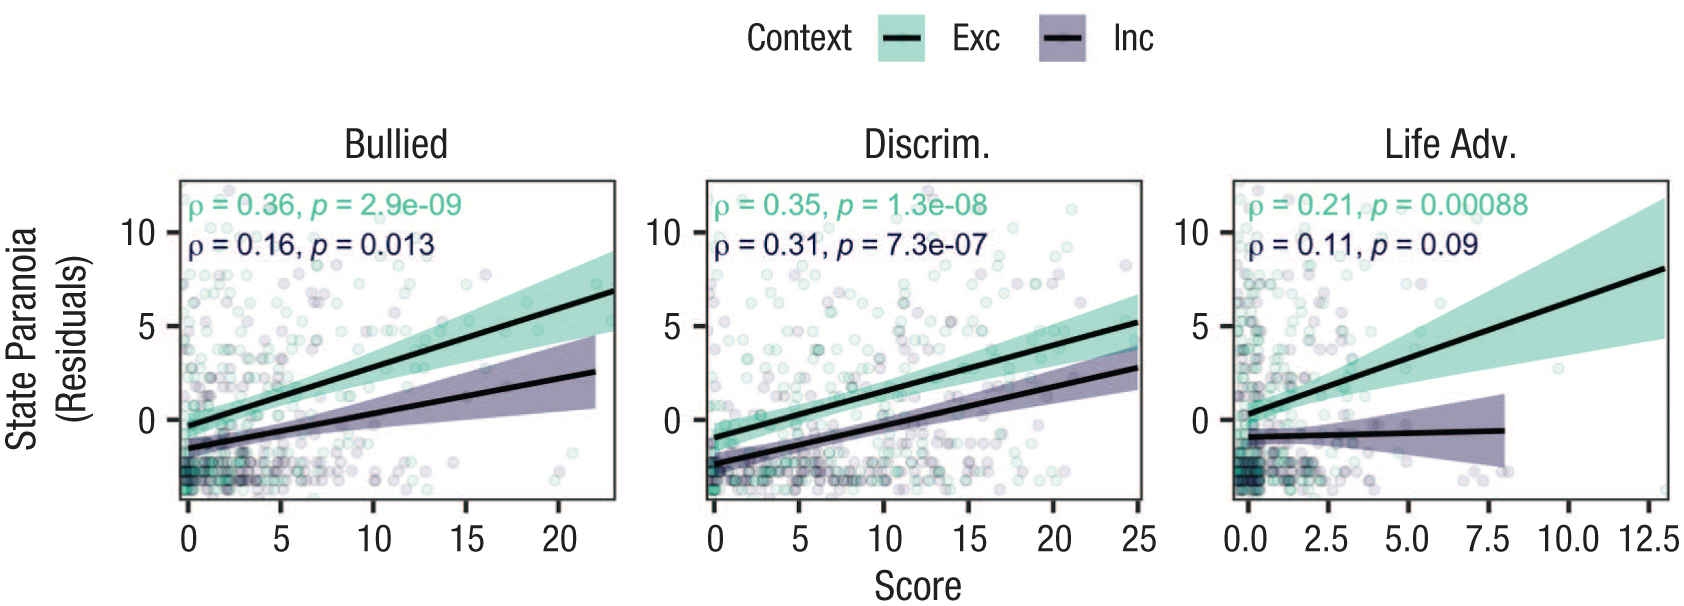
Interaction between prior social adversity and current exclusion on state paranoia in adolescents. Participant task comprehension for the Intentions Game has been regressed out of state-paranoia scores, and the residuals are plotted on the y-axis. Bullied = individual sum score for the Brief Self-Report Measure of Adolescent Bullying–Victimization; Discrim. = individual sum score for the Everyday Discrimination Scale; Life Adv. = individual sum score for the Adverse Life Events Scale; Exc = excluded; Inc = included.
Consistent with Hypothesis 4, state paranoia after Cyberball was associated with greater endorsement of negative self and other beliefs (negative self: linear estimate = 0.42, 95% CI = [0.38, 0.46], t[500] = 22.13, d = 0.70, p < .001; negative other: linear estimate = 0.39, 95% CI = [0.35, 0.43], t[500] = 19.92, d = 0.67, p < .001). Furthermore, consistent with Hypothesis 5, in the context of all adversities, negative self- and other beliefs mediated the impact of the adversity on state paranoia (Table 3).
Relationship Between Social Adversity and State Paranoia, Mediated by Negative Self and Other Beliefs
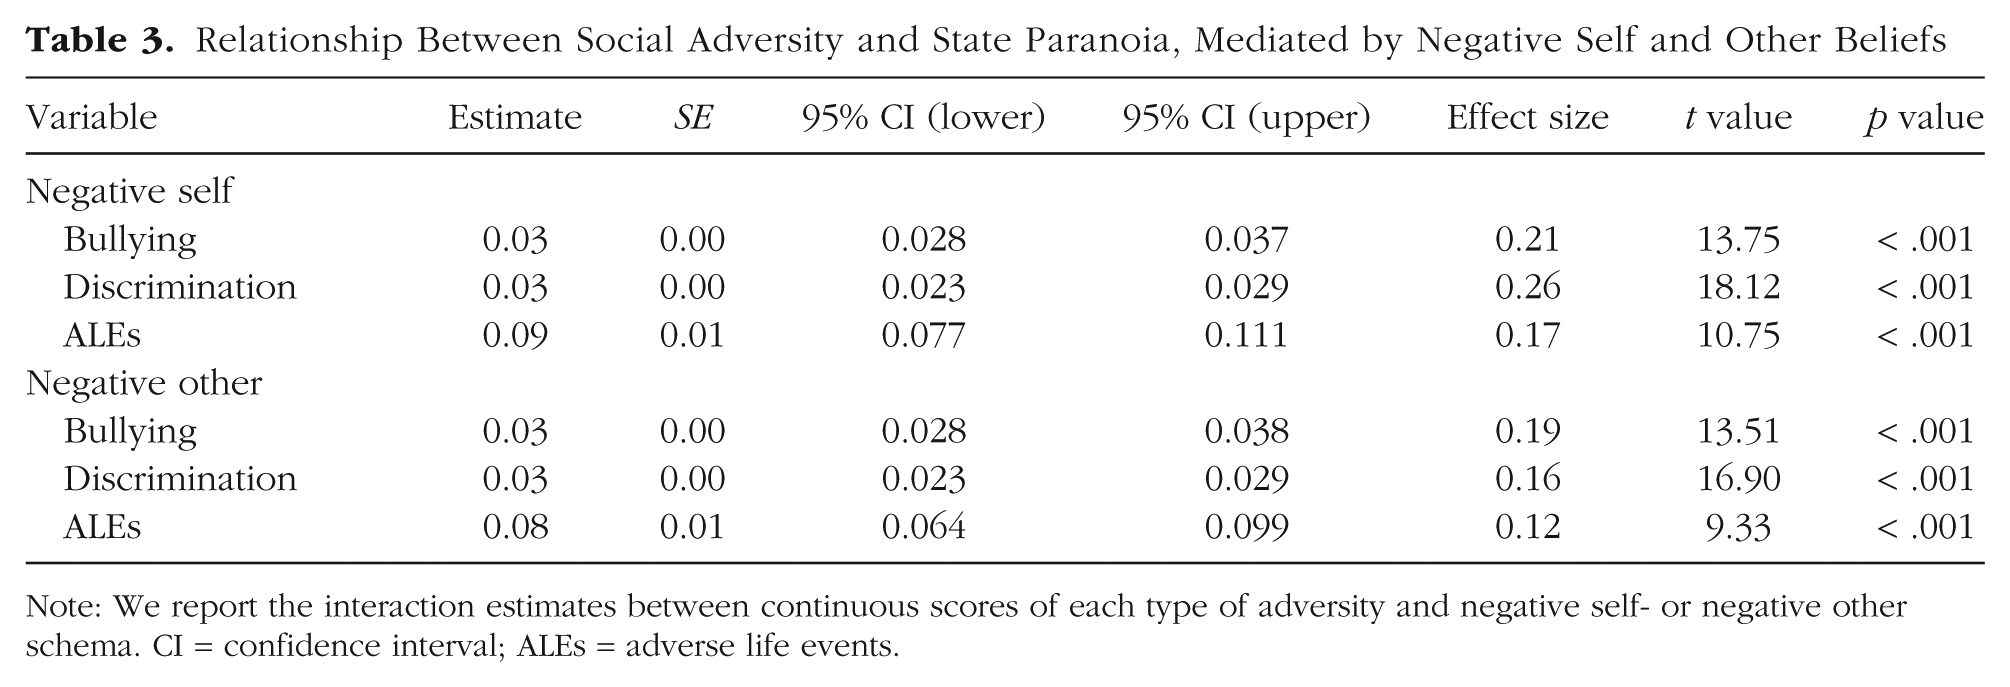
Note: We report the interaction estimates between continuous scores of each type of adversity and negative self- or negative other schema. CI = confidence interval; ALEs = adverse life events.
Exploratory behavioral analysis: the Intentions Game
We conducted exploratory analysis to investigate the “types” of choices participants made per phase (Table S1 in the Supplemental Material). Data were analyzed using full sample and by Cyberball-included/Cyberball-excluded group. Values are presented as the mean choice (and standard deviation) made in each choice pair. We also explored how interpersonal similarity and manipulation influenced reaction times (Fig. S4 in the Supplemental Material).
In Phase 1, participants were more individualistic than competitive (M = 9.64, SD = 3.02), more prosocial than competitive (M = 8.85, SD = 3.86), and marginally more individualistic than prosocial (M = 5.62, SD = 4.44) with no influence of baseline paranoia. In Phase 2, participants showed good predictive accuracy (M = 69.4%, SD = 8.26%) with no main effect of Cyberball manipulation or when analyzed on a trial-by-trial basis using a random-effects models. Predictive accuracy increased over the course of Phase 2 (linear estimate = 0.01, 95% CI = [0.009, 0.011], z = 16.93; d = 1.51, p < .001). In Phase 3, participants were still more individualistic than competitive (M = 8.75, SD = 3.45), but less than in Phase 1 (t[985] = 4.35, d = 0.28, p < .001), and more prosocial than competitive (M = 7.46, SD = 4.34), but also less than in Phase 1 (t[499] = 5.36, d = 0.34, p < .001). Finally, participants still opted for self-gain more frequently when faced with prosocial versus individualistic decisions (M = 4.39, SD = 4.24), but less than in Phase 1 (t[499] = 4.50, d = 0.28, p < .001). Group (Cyberball-included/Cyberball-excluded) did not affect Phase 1 and Phase 3 choices.
Exploratory computational analysis: the Intentions Game
Model comparison: adolescents are influenced by others
Participants were best fit at the group level by Model M3 irrespective of exclusion (frequency = .35, Protected Exceedance Probability [PXP] = .95) or inclusion (frequency = .45, PXP = .87; Fig. S2A in the Supplemental Material). Model M3 causally states that participants do not self-insert but are subject to social-contagion effects following observation of a partner. Consequently, we analyzed common parameters between groups assuming Model M3 best fit all participants. We note that a minority of Cyberball-included participants were best fit by Model M1, which assumes that participants were subject to both self-insertion and social contagion.
Generative accuracy and recovery
We simulated data for each participant using their individual parameters from the winning model within each group and refitted our models using these simulated data. Model comparison yielded very similar results: Participants were best fit at the group level by Model M3 irrespective of Cyberball condition (exclusion: frequency = .72, PXP = .95; inclusion: frequency = .66, PXP = .87).
The simulated data closely matched the actions of participants across all three phases (accuracy: Mdn = .74, SD = .13). In Phase 2, the model-predicted total correct scores were not significantly different from observed scores (Fig. S3 in the Supplemental Material). Parameters across the entire population were strongly and significantly associated (parameter recovery Pearson’s rs = .54–.97, ps < .001). Finally, parameter changes in Phase 3 as determined by model fitting were tightly correlated with predicted changes (Pearson rs = .88–.96, ps < .001). Given the excellent recovery analysis, we continued to analyze individual parameters and simulations across each group.
Phase 1: social exclusion reduces flexibility of the self
Examining Phase 1 choices, we found that irrespective of group, participants were equally prosocial (
Phase 2: social exclusion reduces belief flexibility about others
We next assessed how participants generated their prior beliefs about Phase 2 partners. Model M3 best fit participants choices. This assumes participants form new prior beliefs about their partners in Phase 2 and are influenced by their partner concerning their choices in Phase 3. Irrespective of participant prosociality and self-gain preferences in Phase 1, beliefs at the start of Phase 2 were all significantly more neutral: Prosocial participants held less prosocial priors (linear estimate = 12.67, SE = 0.41, 95% CI = [11.86, 13.48], t = 30.63, p < .001), competitive participants held less competitive priors (linear estimate = −5.89, SE = 0.65, 95% CI = [−7.16, −4.61], t = −9.03, p < .001), and all participants held priors assuming lower self-gain (linear estimate = −3.24, SE = 0.36, 95% CI = [−3.94, −2.54], t = −9.04, p < .001); see Figure S2D in the Supplemental Material.
Cyberball-included participants were more flexible around their prior beliefs in Phase 2 (
Assessing belief updating, participants updated beliefs about a partner’s prosociality more than beliefs about self-gain (
On a more granular trial-by-trial basis, using Kullback-Leibler divergence (DKL) as a metric of informational surprise, we revealed valence and group differences in belief refinement over the course of Phase 2 (Fig. S2C in the Supplemental Material). Beliefs about a partner’s prosociality were updated more than self-gain (linear estimate = 0.11, 95% CI = [0.06, 0.16], t(54,000) = 4.46, d = 0.03, p < .001), and Cyberball-included participants updated beliefs more overall (linear estimate = 0.06, 95% CI = [0.019, 0.11], t(54,000) = 2.73, p = .004). Within beliefs about a partner’s prosociality, time and group interacted such that Cyberball-included participants were initially more flexible than Cyberball-excluded participants, and DKL eventually converged between groups (linear estimate = 0.07, 95% CI = [0.002, 0.006], t(54,000) = 4.03, d = 0.07, p = .004; Fig. S2C in the Supplemental Material).
Thus, adolescents focus predominantly on partner’s prosociality versus their self-gain, and participant prosociality beliefs about their partner become more rigid after being excluded.
Phase 3: social exclusion diminishes the value of social cues to self-learn
Analyzing Phases 1 through 3 belief shifts (Fig. S2D in the Supplemental Material), consistent with behavioral analysis, we found that participants changed prosocial preferences more than self-gain preferences (linear estimate = 3.74, 95% CI = [3.20, 4.29], t = 13.57, p < .001) and became more precise over the same axis (linear estimate = 0.43, 95% CI = [0.36, 0.50], t = 12.67, p < .001) versus self-gain. Cyberball-included versus Cyberball-excluded participants did not demonstrate larger median changes but did become more precise in their preferences (linear estimate = 0.16, 95% CI = [0.09, 0.23], t = 4.68, p < .001). In preference type and group interaction, Cyberball-included participants became more precise over their prosocial preferences versus self-gain (linear estimate = 0.36, 95% CI = [0.23, 0.49], t = 5.42, p < .001).
By assessing the linear contribution of each parameter, we were able to determine that uncertainty over the self and reduced uncertainty of priors caused larger shifts in belief (see Table S3 in the Supplemental Material).
Preregistered computational hypotheses
We combined computational and self-reported data to test preregistered Hypotheses 6 and 7. Cognitive flexibility was defined as the variance of prior beliefs in Phase 2. For Hypothesis 6, higher post-Cyberball state paranoia predicted lower cognitive flexibility over a partner’s prosocial preferences (linear estimate = −0.02, 95% CI = [−0.004, −0.041], t(500) = −2.50, d = −0.11, p = .013) but not self-gain preferences. That is, participants with greater state paranoia more rigidly applied prior beliefs to guide their predictions about their partner’s relative but not absolute value preferences.
To investigate Hypothesis 7, we combined negative self and other beliefs into a sum score—“negative impressions”—and
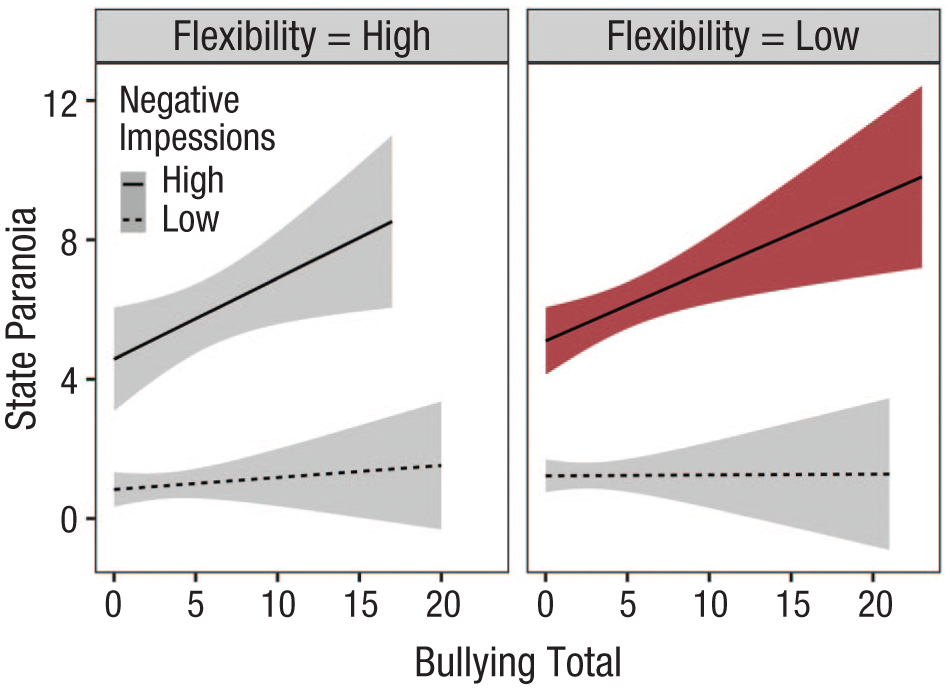
Test of Hypothesis 7: moderation of cognitive flexibility on the interaction of negative impressions between bullying and state paranoia. We combined negative self- and other beliefs into a sum score—“negative impressions”—and
We explored this further using median splits of cognitive flexibility and negative schema and reexamining the linear association between each type of adversity and state paranoia. Under these conditions, low flexibility and high negative schema was the only subtype to show a significant association between each type of adversity and state paranoia (Table S4 in the Supplemental Material), although the relationship between discrimination and state paranoia was significant irrespective of schema and flexibility.
Discussion
To our best knowledge, this is the first experimental examination of paranoia in adolescents and the first empirical test of hypotheses derived from the TRUST model of adolescent paranoia (Kingston & Taylor, under review). Consistent with expectation, previous social adversity and current social exclusion enhanced paranoia. Some differentiation arose across adversities: Bullying and discrimination enhanced paranoia irrespective of inclusion/exclusion, and ALEs predicted paranoia only under conditions of exclusion. This suggests that having a history of bullying and discrimination increases susceptibility to paranoia even when others are acting inclusively, underscoring the potency of these experiences in enhancing vulnerability to paranoia. Given that paranoia is an interpersonal fear and bullying and discrimination concern interpersonal adversity (whereas ALEs measured mixed interpersonal and noninterpersonal adversities), this finding likely reflects the particular vulnerability incurred by exposure to interpersonal harm. This is consistent with our previous work that has consistently shown larger associations between bullying, discrimination, and paranoia compared with ALEs (e.g., Kingston, Ellett et al., 2023; Kingston et al. 2025), with ALEs predicting paranoia in adolescents only in the context of low parental warmth compared with bullying, which increased vulnerability irrespective of parental relationship (Kingston, Ellett et al., 2023).
Our data also offer novel mechanistic insights into the link from social adversity to paranoia in adolescents. In all cases, adversities led to paranoia via negative self- and other beliefs, and only for the case of discrimination was there an additional direct effect. Thus, adversities increased vulnerability to paranoia by fostering negative views about oneself and others. For the case of bullying and discrimination, this occurred even under conditions of inclusion. This finding provides empirical evidence for the TRUST model of adolescent paranoia (Kingston & Taylor, under review), which identifies negative self-beliefs and negative other beliefs arising from social adversity (alongside other possible historic factors, e.g., insecure attachment) as a key psychological mechanism for understanding paranoia as opposed to, for example, social anxiety or depression. For the discrimination-to-paranoia link, our findings suggested three distinct pathways: one directly predicted from social adversity, one via negative self/other beliefs, and one directly predicted from cognitive flexibility. Our previous findings on minority-group status and paranoia in adults found evidence for “healthy cultural mistrust” whereby for some individuals from minoritized backgrounds, paranoia likely reflected healthy and adaptive threat beliefs, arising from lived experiences of victimization, discrimination, and social inequality (Kingston, Schlier et al., 2023). It is possible that the direct route detected here, from discrimination to paranoia, can be similarly explained. The route from reduced cognitive flexibility could further suggest that individuals who have lived experience of discrimination are less likely to detect prosocial cues as prosocial when they arise. This requires further investigation.
Our findings advance research and theory from the adult literature in which early life experiences are frequently hypothesized to play a critical role in paranoid beliefs in adults but in the absence of robust empirical investigation. For example, systematically reviewing adult research on paranoia and self-concept, Kesting and Lincoln (2013) proposed that early adverse interpersonal experiences can be reactivated by later social stress, triggering negative beliefs about the self and others and, in turn, enhancing vulnerability to paranoid interpretations. Not only do our findings demonstrate this empirically during this key developmental stage, but they also offer a nuanced understanding of how different types of adversity may differentially affect mechanisms. Our findings are also consistent with a recent questionnaire-based study predicting paranoia in adults that identified exclusion and negative other beliefs in the top five most influential predictors (Denecke et al., 2024). Conversely, unlike here, discrimination and negative self-beliefs were not identified as major predictors in adults. Future research assessing similarities and differences in paranoia in adult versus adolescent populations would meaningfully contribute to advancing our current knowledge and treatment development.
Novel information about broader adolescent social-learning processes was obtained from the decision-making data in the Intentions Game. State paranoia was associated with lower variance over an opponent’s prosocial-competitive preferences but was unrelated to self-gain choices. This suggests that paranoia negatively affected adolescents’ capacity to accurately detect prosociality in others and to adjust their behavior accordingly. This could indicate an important mechanism for understanding the impact of paranoia on an adolescent’s subsequent interactions with others and thus on the perpetuation of paranoia; that is, paranoia may be maintained by reducing sensitivity to detecting friendly behaviors in others when it occurs. Contrary to expectation, we did not find support for the hypothesis that cognitive flexibility acted as a moderator. Instead, cognitive flexibility independently predicted paranoia in the discrimination model, but for bullying and ALEs, the size of the association was above statistical cutoffs (p = .06). Although the moderated mediation was not significant, we did find in the exploratory analysis that low flexibility and high negative schema was the only subtype to show a significant association between each social adversity and state paranoia. This tentatively suggests that this combination could be problematic for young people, but analysis may have been underpowered. Further investigation is warranted.
Exploratory computational analyses also gave insight into broader social-learning processes in the adolescent sample. We found an overall tendency for adolescents to experience social contagion (e.g., “I become more like you after observing you”) but not self-insertion (e.g., “you will act like I do”). Furthermore, social contagion was more evident than in prior samples of healthy adults (Barnby et al., 2025). This could suggest a specific process whereby adolescents are overall more prone to converge to the behaviors of others in novel social situations to help inform their own ideas and behaviors. Indeed, adolescents show greater uncertainty about the self than adults and are in the process of developing their sense of self and identity through social interactions (Sebastian et al., 2008). Greater uncertainty and/or less experience and sophistication in developing ideas about others and how they themselves might behave in novel situations may underpin an overreliance on building one’s own ideas and actions based on how they perceive others to be behaving. Note that this was reduced in individuals with previous social adversity and with current paranoia, thus underscoring the potential significance of this during the adolescent phase of development. Replication and comparison across age groups is an important next step, as is determining whether this is specific to peers or others in general.
Computational analyses also indicated that overall, adolescents learned more about relative reward (i.e., amount allocated to the self relative to the other—prosocial-competitive axis) than absolute reward (i.e., amount allocated to oneself—individualistic axis). These data imply a tendency for adolescents to specifically attend to how they perceive they are being treated relative to others more so than how they or others benefit individually. This has strong implications for understanding learning in adolescents, in which joint reward may be particularly salient for building lasting models of others (Barnby et al., 2023). We further found that social exclusion reduced social contagion and restricted belief flexibility, suggesting that even mild exclusion manipulations can cause momentary changes in the way social information is integrated and deployed.
Findings should be considered in light of limitations. First, brief experimental manipulation of exclusion is pragmatic and ethical yet nonetheless analogues real-life exclusion experiences. This being said, findings replicate a robust and well-established effect of Cyberball on paranoia in adults (Ellett et al., 2023). Standardization of the exclusion experience overcomes challenges inherent in adolescents self-identifying exclusion experiences, which is subject to greater bias in individuals with higher paranoia and mental-health difficulties. Observing these effects with only a small manipulation attests to the social sensitivity of some young people and enabled us to test the predictions as the processes unfolded in real time. Future research using experience-sampling methodology will help determine the ecological validity of findings. Second, 15- to 17-year-olds represent a subgroup of adolescents, and different patterns may emerge in younger or older cohorts. Future research could advance the field by pinpointing the age at which self-insertion emerges and becomes a generalizable tool (as in adults). Finally, the Intentions Game assesses social generalization but limited to an economic context. It cannot be necessarily assumed this limited context applies to social-generalization dynamics across all contexts, although we note that even in this microeconomic context, we find robust change in social learning postmanipulation.
For some adolescents, paranoia is a precursor to persecutory delusions and potential future diagnosis of psychosis and/or schizophrenia (Dominguez et al., 2011). Identifying targets for intervention and prevention is imperative. Our findings suggest vulnerability to paranoia can be reduced by disrupting negative self- and other beliefs. The central role of such beliefs in adults is well replicated internationally (Kingston, Schlier et al., 2023), but this is the first experimental evidence in adolescents. Accordingly, one intervention strategy could be helping adolescents develop more balanced, accurate, and positively toned self- and other beliefs, especially in ambiguous social situations. Likewise, reducing the inflexibility with which these beliefs are held, such as by nonjudgmentally tracking in-the-moment behaviors of others, may enhance the chances of detecting prosocial behavior when it occurs (e.g., mindfulness- and acceptance-based strategies; Kingston et al., 2019; Shore et al., 2018). Discrimination may have different routes to paranoia. This is important information, suggesting tailored and formulation-guided intervention techniques are especially important (Kingston, Schlier et al., 2023). Finally, findings build on implications from previous research by showing that adolescents with socially adverse backgrounds are vulnerable to paranoia after even minor exclusions, aiding identification of adolescents who may benefit from support and preventive efforts.
In conclusion, adolescents with exposure to bullying, discrimination, and/or ALEs in the last year are susceptible to paranoia following a minor exclusion manipulation, in part because of the triggering of self-reported negative self- and other beliefs. Failure to detect instances of prosociality in others, affected by the rigidity with which negative self- and other beliefs are held and by discrimination in particular, likely exacerbates and maintains this. Findings directly inform likely profitable intervention targets.
Supplemental Material
sj-docx-1-cpx-10.1177_21677026261429948 – Supplemental material for Social Threat, Negative Beliefs, and Altered Social Learning Underpin Paranoia in Adolescents
Supplemental material, sj-docx-1-cpx-10.1177_21677026261429948 for Social Threat, Negative Beliefs, and Altered Social Learning Underpin Paranoia in Adolescents by Jessica L. Kingston, Lyn Ellett, Linda Richards, Henry Burgess and Joseph M. Barnby in Clinical Psychological Science
Footnotes
Acknowledgements
Preprint available at OSF | Social exclusion increases paranoia and reduces self and other learning flexibility in adolescents. In this study, we followed all ethical guidelines of the Helsinki Declaration. All procedures performed in studies involving human participants were in accordance with the ethical standards of the institutional and/or national research committee and with the 1964 Helsinki Declaration and its later amendments or comparable ethical standards. Institutional ethical approval was gained from Royal Holloway University of London. The data that support the findings of this study are publicly available at GitHub-josephmbarnby/adolescence_self_other_transfer: Data and code for Kingston, Ellett, Richards, Burgess, Barnby, 2025.
Transparency
Action Editor: Jennifer L. Tackett
Editor: Jennifer L. Tackett
Author Contributions
Notes
References
Supplementary Material
Please find the following supplemental material available below.
For Open Access articles published under a Creative Commons License, all supplemental material carries the same license as the article it is associated with.
For non-Open Access articles published, all supplemental material carries a non-exclusive license, and permission requests for re-use of supplemental material or any part of supplemental material shall be sent directly to the copyright owner as specified in the copyright notice associated with the article.