
Abstract
Disturbances of emotion are a core feature of psychological disorders generally and mood and anxiety disorders in particular. However, it remains unclear what specific patterns of affective disturbance are shared across different symptom domains. Here, we examined correlations between emotional-disorder symptom severity (anxiety, depression, hypomania, and anhedonia) and affective reactivity to gain and loss outcomes in a decision-making task with embedded sampling of emotional valence (Experiment 1: N = 329; preregistered replication in Experiment 2: N = 524). Using hierarchical Bayesian computational modeling of emotion self-reports, we found that greater affective reactivity to gains and losses in the task was associated with more-severe symptoms of both anxiety and hypomania. This suggests that heightened reactivity to both appetitive and aversive outcomes indexes emotional-disorder severity across multiple symptom domains of psychopathology, in line with theoretical frameworks that conceptualize affective disturbance as a generalized risk factor for psychopathology.
Keywords
Disturbances in affect are a core feature of psychological disorders (Berenbaum et al., 2003; Marwaha et al., 2018). Distressing or dysfunctional moods and emotions form part of the diagnostic criteria for mood and anxiety disorders, such as major depression, bipolar disorder, and generalized anxiety disorder (collectively termed “emotional disorders”; Bullis et al., 2019; Watson et al., 2008). More broadly, dysfunctional affect dynamics are also present in people with borderline personality disorder (Chapman, 2019), gambling and substance use disorders (Stellern et al., 2023; Velotti et al., 2021), eating disorders (Monell et al., 2018), and attention-deficit/hyperactivity disorder (Shaw et al., 2014). This cross-disorder commonality has prompted the suggestion that affective disturbance—understood as a trait-level characteristic of individuals—may be a transdiagnostic phenotype that confers increased risk for multiple distinct forms of psychopathology (Barrett et al., 2007; Cludius et al., 2020; Kring, 2008).
One seeming complication for this transdiagnostic perspective is that dysfunctions of affect manifest in markedly different ways in different psychological disorders (e.g., chronic dysphoric mood in major depressive disorder vs. mood reactivity and lability in borderline personality disorder; Koenigsberg et al., 1999). Different individuals with the same diagnosis may also present with distinct profiles of affect disturbance, such as in the divergent longitudinal symptom trajectories seen in people with bipolar disorder (Behrendt-Møller et al., 2019). Symptom heterogeneity across diagnoses and individuals does not necessarily invalidate the transdiagnostic perspective on affect disturbance (indeed, it may strengthen the case for a data-driven approach; Grisanzio et al., 2018). Nevertheless, it remains unclear precisely which types of affect disturbance are shared generally across domains of psychopathology and which are unique to specific categorical disorders (but see e.g., Houben et al., 2015; Scott et al., 2020). This lack of clarity may be attributable in part to a diversity of overlapping theoretical approaches in the literature, where affect disturbances have been variously conceptualized as affective instability, mood instability, mood lability, emotional reactivity, and emotion dysregulation (for a review, see Renaud & Zacchia, 2012). In the presence of this theoretical diversity and conceptual overlap, an important outstanding task for basic-science research is empirically to identify patterns of affective disturbance that are shared across distinct psychiatric-symptom domains.
Human affect itself consists of variation at multiple timescales (Eldar et al., 2018; Oravecz & Brick, 2019; Sperry & Kwapil, 2022). Affect dynamics include a long-timescale component that comprises slow fluctuations around a long-term emotional baseline (often called “mood”; Morris, 1989) and a short-timescale component that comprises moment-to-moment changes in affect elicited by environmental stimuli (e.g., increased negative affect after missing a bus; Kuppens & Tong, 2010). These short-timescale components have their own intrinsic dynamics, characterized by (a) the strength of the initial affective reaction to an eliciting stimulus, (b) the duration of this reaction, and (c) the rate at which affect returns to baseline after stimulus offset (Davidson, 1998; Koole, 2009). Each of these three short-timescale components comprises a dimension of affective experience along which individuals may differ from one another (Becerra et al., 2019). Among these, in the present study, we focused on affective reactivity, a basic phenotype that shows promise as a potential transdiagnostic marker for affect disturbance in psychopathology. Elevated affective reactivity (i.e., heightened immediate emotional reactions to emotion-eliciting stimuli; Gross et al., 1998; Larsen & Ketelaar, 1989; Smillie et al., 2012) has been observed in a number of distinct psychological disorders, including anxiety (Carthy et al., 2010; Goldin et al., 2009; Tan et al., 2012), depression (Bylsma et al., 2011; Peeters et al., 2003), bipolar disorder (Gruber et al., 2011; C. Henry et al., 2008; M’Bailara et al., 2009), and borderline personality disorder (Ebner-Priemer et al., 2015; Houben et al., 2018). In individuals with depression, elevated affective reactivity is associated with worse overall outcomes and increased long-term likelihood of relapse (Santee & Starr, 2022; van Rijsbergen et al., 2013). Moreover, the children of people with depression and bipolar disorder show increased affective lability (a construct closely related to affective reactivity) relative to control subjects, suggesting that affective reactivity might represent a portion of the shared genetic component of mood disorders (Zwicker et al., 2020). Taken together, these findings suggest that affective reactivity might be a phenotype that confers risk for psychopathology broadly, consistent with the transdiagnostic perspective on psychological disorders.
In the present study, our overarching goal was to determine how interindividual differences in affective reactivity were associated with emotional-disorder symptom severity in a community sample. We adopted a transdiagnostic perspective such that psychological symptom severity was assumed to vary continuously across the population and traditional psychiatric diagnoses were understood as dysfunctional extremes of symptom variation (Krueger & Eaton, 2015; Wise et al., 2023). Under this assumption, researchers can leverage variation in symptom severity in large-scale community samples to understand how individual differences in measurable phenotypes are statistically associated with variability in symptoms between people. In the last decade, this approach has yielded a number of insights, such as links between anxiety symptom severity and behavioral indices of both safety learning (Wise & Dolan, 2020) and sensitivity to punishment (Yamamori et al., 2023), a link between compulsivity symptom severity and behavioral indices of goal-directed control (Gillan et al., 2016), and a link between psychosis symptom severity and overweighting of incoming sensory information (Goodwin et al., 2023). However, the large-scale symptom-correlation approach has not previously been applied to studying affect disturbance broadly or affective reactivity specifically. Given that people in the general population show substantial and stable individual differences in basic affective processes (e.g., Oravecz & Brick, 2019), we considered that this approach would likely be fruitful in understanding associations between affective reactivity and emotional-disorder symptoms.
To quantify individual differences in affective reactivity, we used a variant of a recently developed behavioral task (Forbes & Bennett, 2024) in which self-report probes of participants’ momentary affective valence were embedded in a behavioral task involving choices between different risky “gambles” (in line with similar earlier work; Mellers et al., 1997; Rutledge et al., 2014). We then assessed how the self-reported severity of participants’ emotional-disorder symptoms (i.e., depression, anxiety, anhedonia, and hypomania) related to their affective reactivity in the task as quantified through computational modeling of self-reported affect. On the basis of the literature reviewed above, we hypothesized that we would observe positive correlations between emotional-disorder symptom severity and affective reactivity as measured in the behavioral task. However, we were initially agnostic as to whether affective reactivity would be differentially associated with some symptom domains rather than others and therefore conducted an initial exploratory study (Experiment 1) followed by a preregistered confirmatory replication study (Experiment 2).
Although less ecologically valid than ecological-momentary-assessment studies that measure affective reactivity to daily life events (e.g., Houben et al., 2018; Tan et al., 2012), there were several distinct advantages of a controlled experimental design measuring affective reactivity in a behavioral task. First, although daily life studies are more representative of naturalistic experience, measurements of affective reactivity to life events are inextricably confounded with variability in behavior. Different people engage in different types of daily behaviors; for instance, people higher in neuroticism tend to experience more negative daily experiences (Borghuis et al., 2020), whereas more positive affect is associated with a greater variety of day-to-day experiences (Saragosa-Harris et al., 2022). As a consequence, between-persons variability in daily affect could be caused by either differences in affective processes or differences in the sorts of stimuli with which people’s daily behavior brings them into contact. By contrast, using a well-controlled cognitive task allows us to exert experimental control over the stimuli that different participants experience, thereby permitting direct comparison of different people’s affective reactivity to the same eliciting stimuli. In addition, using a cognitive task permits dissociation of affective reactivity to different types of eliciting stimuli (e.g., positive affective reactions to win outcomes vs. negative affective reactions to loss outcomes) and therefore allows us to understand how emotional-disorder symptoms are specifically related to affective reactivity to different stimulus types. Finally, using a task in which participants make reward-based choices and are exposed to the outcomes of these choices ensures that the stimuli participants are exposed to are motivationally relevant to them, unlike designs in which participants are passively exposed to emotional stimuli of no direct motivational significance (e.g., pleasant and unpleasant images). In this vein, our task also incorporated manipulations of choice agency (i.e., the degree of control that participants have over their choices), which we have shown to moderate affective reactivity in other recent work (Forbes & Bennett, 2024).
Transparency and Openness
Preregistration
This study comprised a first non-preregistered exploratory study (Experiment 1), followed by a preregistered confirmatory study (Experiment 2). All participant recruitment and exclusion criteria were preregistered before data collection for Experiment 2, as were computational modeling and symptom-parameter correlation analyses. For computational-modeling analyses, we preregistered our general intended approach but did not preregister specific model equations, choices of prior distribution, or software settings for model fitting (number of posterior samples, sampling hyperparameters, etc.). There were several minor deviations from the preregistration to note: First, we conducted several non-preregistered linear mixed-effects regression analyses to help contextualize the results of the computational-modeling analyses. Second, our hypothesis preregistration for Experiment 2 comprised four sets of detailed hypotheses that have been simplified to a single general hypothesis in the introduction above for the sake of brevity. Third, we also did not preregister our intention to conduct the test-rest reliability analysis that we report below. Finally, a further deviation was that we neglected to state in the preregistration document that participants from Ireland were also eligible to take part in Experiment 2 (there were seven such participants in total).
Data, materials, code, and online resources
The preregistration document and de-identified raw data are available without restriction at the project OSF repository (https://osf.io/2ysnc/). Supplemental information for this article is available in the Supplemental Material available online.
Reporting
We report how we determined our sample size, all data exclusions, all manipulations, and all measures in this study.
Ethical approval
This study was approved by the Monash University Human Research Ethics Committee (No. 27472), and all participants provided informed consent via a web-browser form. All research was conducted in accordance with the Declaration of Helsinki (with the exception that Experiment 1 was not preregistered).
Method
Procedure
Data collection in both experiments proceeded in two stages: At the first stage, we collected self-report symptom-severity ratings and demographic data from a larger sample of participants than our target final sample size. At the second stage, we screened out participants who did not pass attention-check items embedded in the symptom-rating questionnaires; the remaining participants were invited back within 1 week to complete the risky decision-making task. For recruitment flowcharts for both experiments, see Section S1 in the Supplemental Material. Because the data-collection protocol for both experiments was nearly identical, we report the method for both experiments together below and note minor variations in procedure between experiments where applicable. All study components were presented to participants via web browser using custom code written in JavaScript using the jsPsych package (De Leeuw, 2015) and Python server code written using the Flask web framework and hosted on a Monash University virtual machine.
Participants
Participants were recruited via Prolific and completed the experiment online in their web browser. We recruited adults ages 18 to 65 with a country of residence in Australia, Canada, Ireland, New Zealand, the United Kingdom, or the United States. In Experiment 1, we recruited an initial questionnaire sample of 605 participants, of whom 329 subsequently completed the behavioral task (age: M = 35.18 years; men: n = 140; women: n = 188; did not endorse a binary gender: n = 1). In Experiment 2, we recruited an initial questionnaire sample of 800 participants, of whom 524 subsequently completed the behavioral task (age: M = 37.50 years; men: n = 243; women: n = 263; did not endorse a binary gender: n = 8). Participants from Experiment 1 were not eligible to take part in Experiment 2. After applying task-based exclusion criteria (see below), the final sample sizes for Experiment 1 and Experiment 2 were 320 participants and 509 participants, respectively. All participants who completed the screening survey were paid USD $1, and participants who completed the behavioral task were paid an additional $4.50 plus a monetary bonus depending on task performance of up to $1 (M = $0.59, SD = $0.31).
The target sample size for Experiment 2 was 500, determined before data collection by means of a bootstrap power analysis based on the results of Experiment 1. Specifically, we estimated the sample size necessary to have in excess of 80% power to replicate results of Experiment 1 for α = .05 with 10,000 bootstrapped samples. A bootstrap power analysis allowed us to take into account the positively skewed distribution of symptom scores, unlike typical power analyses assuming multivariate normality.
Finally, 150 participants from Experiment 2 were invited back after 1 month to recomplete the task and symptom-severity ratings, thereby allowing us to measure the test–retest reliability of affective reactivity as measured by the task. These participants received equivalent additional baseline and monetary bonus payments for recompleting the task.
Materials
Questionnaires
In the initial phase of each experiment, participants completed a demographic questionnaire (comprising questions on age, gender, education, and country of residence; a limitation of this study is that we did not collect data on racial/ethnic identification, income, or socioeconomic status) and a series of self-report questionnaires. Self-report questionnaires were standard instruments for assessing the severity of emotional-disorder symptoms, including anxiety (the seven-item Generalized Anxiety Disorder Scale; Spitzer et al., 2006), depression (the seven-item depression subscale [7-Down] of the 7-Up/7-Down Scale; Youngstrom et al., 2013), hypomania (the seven-item hypomania subscale [7-Up] of the 7-Up/7-Down Scale), and anhedonia (the 14-item Snaith-Hamilton Pleasure Scale [SHAPS]; Snaith et al., 1995). The SHAPS is normally scored such that higher scores indicate less severe anhedonia; in the present study, however, we reverse-coded this scale to maintain consistency with the other self-report scales (in which higher scores indicated more-severe symptoms).
We embedded one infrequency-item attention check (e.g., “I am able to stop breathing without the aid of medical equipment for more than 30 minutes”) in each self-report questionnaire, and participants who responded incorrectly to any of these questions were not invited back to complete the second phase of the experiment. We used this protocol because it has been shown that in the presence of positively skewed self-report measures (e.g., symptom-severity questionnaires), inattentive responding has the potential to masquerade as greater symptom severity, which may lead to spurious results if these inattentive participants are not identified and excluded (Zorowitz et al., 2023).
Finally, participants in Experiment 2 also completed several additional questionnaires intended for use in exploratory analyses to provide additional context to the primary preregistered analyses. These additional questionnaires were the 20-item short version of the Affect Intensity Measure (Geuens & De Pelsmacker, 2002), the depression subscale of the Depression Anxiety and Stress Scale (Lovibond & Lovibond, 1995), and the five-item Altman Self-Rating Mania Scale (Altman et al., 1997).
Risky decision-making task
In the second phase of each experiment, participants completed a risky decision-making task with embedded high-frequency sampling of subjective affect. This task was a variant of a similar task described in more detail by Forbes and Bennett (2024), which was itself modeled after tasks previously developed by Mellers et al. (1997) and Rutledge et al. (2014). The task was presented using a cover story in which participants chose between two “card” stimuli on each trial, each of which could yield a different number of points when chosen (see Fig. 1). Before choice, the visual characteristics of each card indicated the two possible outcome amounts that could occur if that card was chosen (possible outcome amounts were −200, −100, 0, 100, or 200 “points,” indicated by distinct colors) and the respective probabilities of each outcome (either 25%, 50%, or 75%, indicated by the relative size of the bars of each color). Stimuli were presented in four blocks of 53 trials each (212 trials in total). Every three to five trials throughout the task, participants were asked to self-report their current emotional valence using a slider response scale (Betella & Verschure, 2016).
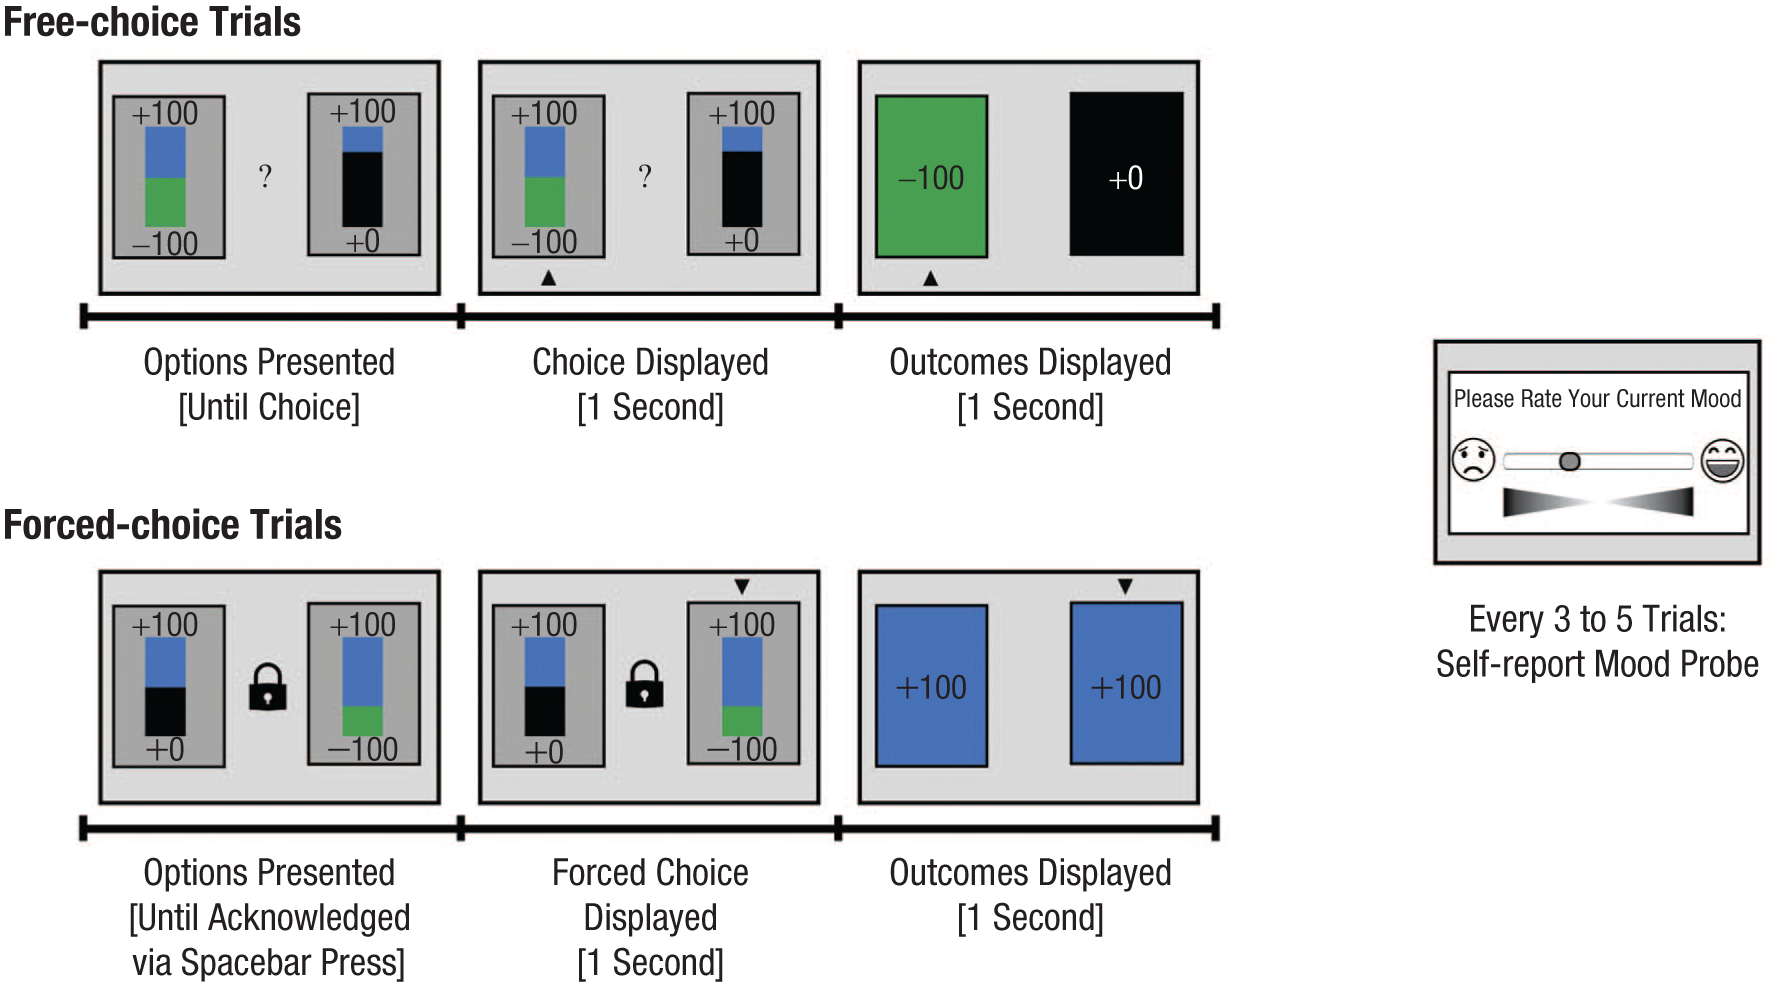
Task schematic for the risky decision-making task. In each trial, participants were first shown a pair of choice options (“cards”) differing in the magnitude and probability of their possible outcomes (depicted visually as the size of colored bars corresponding to different potential outcomes). In (top) free-choice trials, participants freely chose between the cards using the arrow keys; in (bottom) forced-choice trials, a card was randomly selected on the participant’s behalf. After selection of a card, the outcomes of both the chosen and the unchosen cards were revealed. After every three to five trials (randomly jittered), participants used a slider to indicate the current valence of their subjective affect.
After a card was chosen, participants were shown both the outcome of their choice and the outcome of the unchosen card. This enabled us to measure participants’ affective reactivity to both the gain/loss outcome of their chosen card and to a quantity that we termed the “counterfactual reward difference”: the extent to which the “counterfactual” outcome of the unchosen card was better or worse than the outcome of the actual chosen card. In addition, we also manipulated participants’ choice agency by presenting an equal mixture of free-choice trials (in which the participant chose freely between the two cards on display) and forced-choice trials (in which a card was chosen on the participant’s behalf by a fictitious “dealer”). In this way, we sought to determine the moderating effect of choice agency on participants’ affective reactivity to different cognitive appraisals.
Ten attention-check trials were also randomly distributed throughout the task. In these trials, one of the two cards was unambiguously the correct choice because the worst possible outcome of the correct card was superior to the best possible outcome of the incorrect card (e.g., choice between a 50/50 gamble for +200/+100 points and a 50/50 gamble between −100/−200 points). Participants who responded incorrectly to more than one attention-check trial across the task were excluded from further analysis (for recruitment flowcharts, see Figs. S1 and S2 in the Supplemental Material).
Data analysis
Our broad aim was to investigate how participants’ self-reports of their affective valence were influenced by different outcome appraisals in the behavioral task (e.g., gains and losses, positive and negative counterfactual reward difference). More narrowly, we sought to determine the extent to which individual differences in the severity of emotional-disorder symptoms correlated with individual differences in affective reactivity to rewards and losses. We adopted two approaches to the analysis of emotion self-report data: We first conducted “model-agnostic” analyses of affective valence using a set of linear autoregressive mixed-effects regression analyses. We then analyzed data and estimated individual differences in affective reactivity to different outcome types using a computational model of affect self-reports in this task. Our primary analysis approach was to assess correlations between individual symptom scales (e.g., depression, anxiety, hypomania) and computational model parameters. To complement this approach and given that we anticipated substantial correlations between different symptom measures, we also conducted an exploratory factor analysis to determine how computational model parameters were associated with latent factors underlying different domains of emotional-disorder symptoms. Analyses of participants’ choice behavior in this task are presented in more detail elsewhere (Bennett et al., 2024).
Linear mixed-effects analyses
Model-agnostic analyses of affect self-report data were conducted using linear autoregressive mixed-effects regression analyses. This model type is appropriate for analyses of intensive longitudinal affect self-report data (e.g., De Haan-Rietdijk et al., 2016; Pooseh et al., 2024) because the autoregressive component of the model accounts for the strong statistical dependence between successive emotion self-reports (i.e., the strong positive correlations between self-reported affective valence at time t and self-reported affective valence at time t + 1). The dependent variable for these analyses was within-tasks self-reports of affective valence on the slider. Slider responses were measured on a continuous-valued scale from 0 to 1 such that 0 indicated extremely negative valence and 1 indicated extremely positive valence (because measured scores were continuous, the choice of a scale from 0 to 1 was arbitrary and designed for convenience of subsequent computational modeling). The predictor variables in the regression model were (a) each participant’s self-reported emotional valence on the preceding presentation of the slider (i.e., the autoregressive component), (b) the numerical outcome of the chosen card on the trial immediately preceding the current affect self-report (z-scored with grand-mean centering), (c) the counterfactual reward difference on the preceding trial (z-sored with grand-mean centering), and (d) the interaction of both (b) and (c) with trial type (free vs. forced choice, reference-coded).
Regression models were fit with the lme4 package for R using restricted maximum likelihood estimation. Statistical significance for individual regression coefficients was computed using the Satterthwaite approximation. Random effects were identified using a maximum-to-minimal-that-converges approach (Barr et al., 2013). For a full specification of the regression coefficients for each model, see Section S3 in the Supplemental Material. In these analyses, we estimated semistandardized regression coefficients in which numerical predictor variables (e.g., outcome) were standardized but the dependent variable (affect) was not. We chose this approach because the scale from 0 to 1 of the affective slider means that changes in responses on this scale are interpretable as proportions of the length of the slider (e.g., a coefficient of β = 0.04 corresponds to an effect size equivalent to 4% of the total length of the slider). Thus, the semistandardized regression coefficients that we report below quantify the effect of a 1-SD change in the predictor variable in terms of percentage change on the affective slider.
Computational modeling analyses
As in our previous work using variants of this task (Forbes & Bennett, 2024; see also Rutledge et al., 2014, 2017), we also analyzed affect self-report data using hierarchical Bayesian computational modeling. These modeling analyses had two aims: First, we sought to determine via model comparison which sources of information on decision feedback were primarily responsible for moment-to-moment fluctuations in participants’ subjective affective valence; second, within the best-fitting model, we estimated participant-level parameters for affective reactivity to different appraisal types as a measure of individual differences in affective reactivity to reward (and other appraisal types).
Specifically, because affect self-reports were constrained between 0 (negative extreme) and 1 (positive extreme), we modeled momentary subjective affect using a beta distribution (with a mean-precision parameterization). Formally, for a given participant’s nth affect self-report following trial t of the behavioral task, we modeled subjective affective valence as the following:


That is, subjective affect was assumed to be distributed according to a beta distribution with mean Mn and precision ɸ (Equation 1a). The mean of this distribution Mn was itself assumed to be a sum of the baseline affect parameter w0 (which determines the average affective valence for a given participant) and an exponentially discounted sum of outcome appraisals over the preceding five trials. The discount rate for appraisals of outcomes from earlier trials is controlled by the discount parameter γ (
Overview of Competing Computational Models
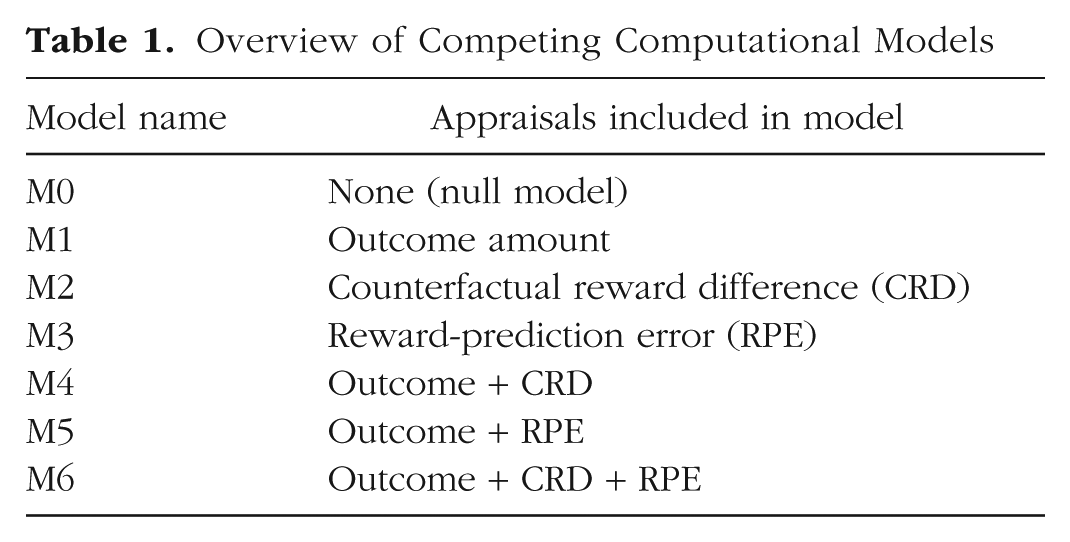
To account for differences in positive and negative affective reactivity, each of Models M1 through M6 also allowed for asymmetric effects of the appraisals included in the model. In Model M1, for instance, which included effects only of the preceding gain/loss outcome on subjective affect, the Appraisalst term was defined as follows:
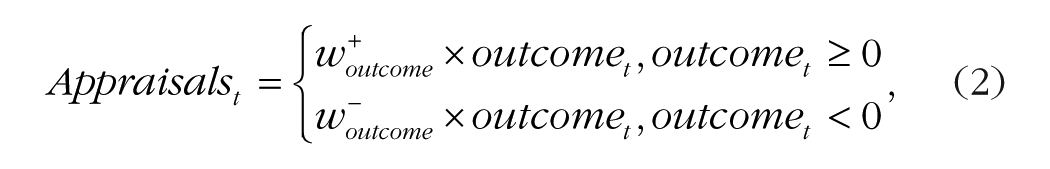
where


In plain language, Equations 2 and 3 specify that the effect of the outcome of the chosen card on subjective affect was scaled by the positive affective reactivity to reward parameter
Different computational models were compared using the Widely Applicable Information Criterion (WAIC) statistic. This model-comparison approach was identical to that described in our recent work with this task (Forbes & Bennett, 2024); briefly, for each model, we calculated the WAIC (Watanabe, 2010), which is a model-comparison metric designed for hierarchical Bayesian computational models. Using the loo package in R (Vehtari et al., 2017), we estimated (a) the WAIC for each model; (b) ΔWAIC, the difference between each model’s WAIC and the WAIC value of the best-fitting model; and (c) the standard error of ΔWAIC for each model. As in our previous work, models with a ΔWAIC value within 1 SE of the best-fitting model were taken to be statistically equivalent to the best-fitting model, and ties were broken according to model parsimony (measured as the number of parameters per participant; simpler models were preferred when adjudicating among a set of statistically equivalent models).
All models were fit to data with Hamiltonian Monte Carlo using the software Stan (Carpenter et al., 2017). Specifically, we sampled from the joint posterior distribution of all parameters using four independent chains. Each chain took 1,250 postwarmup samples (after a warmup period of 1,750 samples), resulting in a total of 5,000 posterior samples for analysis. There were no divergent transitions in any model, and all models fully converged (
Results
Linear mixed-effects regression analyses
For affect self-report data, autoregressive linear mixed-effects regression analyses revealed that participants displayed significant affective reactivity to both the outcomes of the chosen card to the difference between this outcome and the outcome of the unchosen card (the counterfactual reward difference). The outcome of the chosen card significantly influenced subsequent affect such that greater rewards were associated with more positive subsequent affect and greater losses were associated with more negative subsequent affect (Fig. 2a; Experiment 1: β = 0.04, SE = 0.002, p < .001; Experiment 2: β = 0.04, SE = 0.002, p < .001). The converse was true of the unchosen card, in which positive counterfactual reward differences (i.e., better outcomes for the unchosen card compared with the chosen card) produced more negative subsequent affect and vice versa for negative counterfactual reward differences (Fig. 2b; Experiment 1: β = −0.01, SE = 0.002, p < .001; Experiment 2: β = −0.01, SE = 0.001, p < .001). We also found evidence that these effects significantly interacted with trial type, driven by weaker affective reactivity in forced-choice trials than in free-choice trials for both chosen-card outcomes (Experiment 1: β = −0.004, SE = 0.002, p = .06; Experiment 2: β = −0.004, SE = 0.001, p = .01; note that the result was a nonsignificant trend in Experiment 1) and counterfactual reward difference (Experiment 1: β = 0.01, SE = 0.002, p < .001; Experiment 2: β = 0.004, SE = 0.001, p = .004).
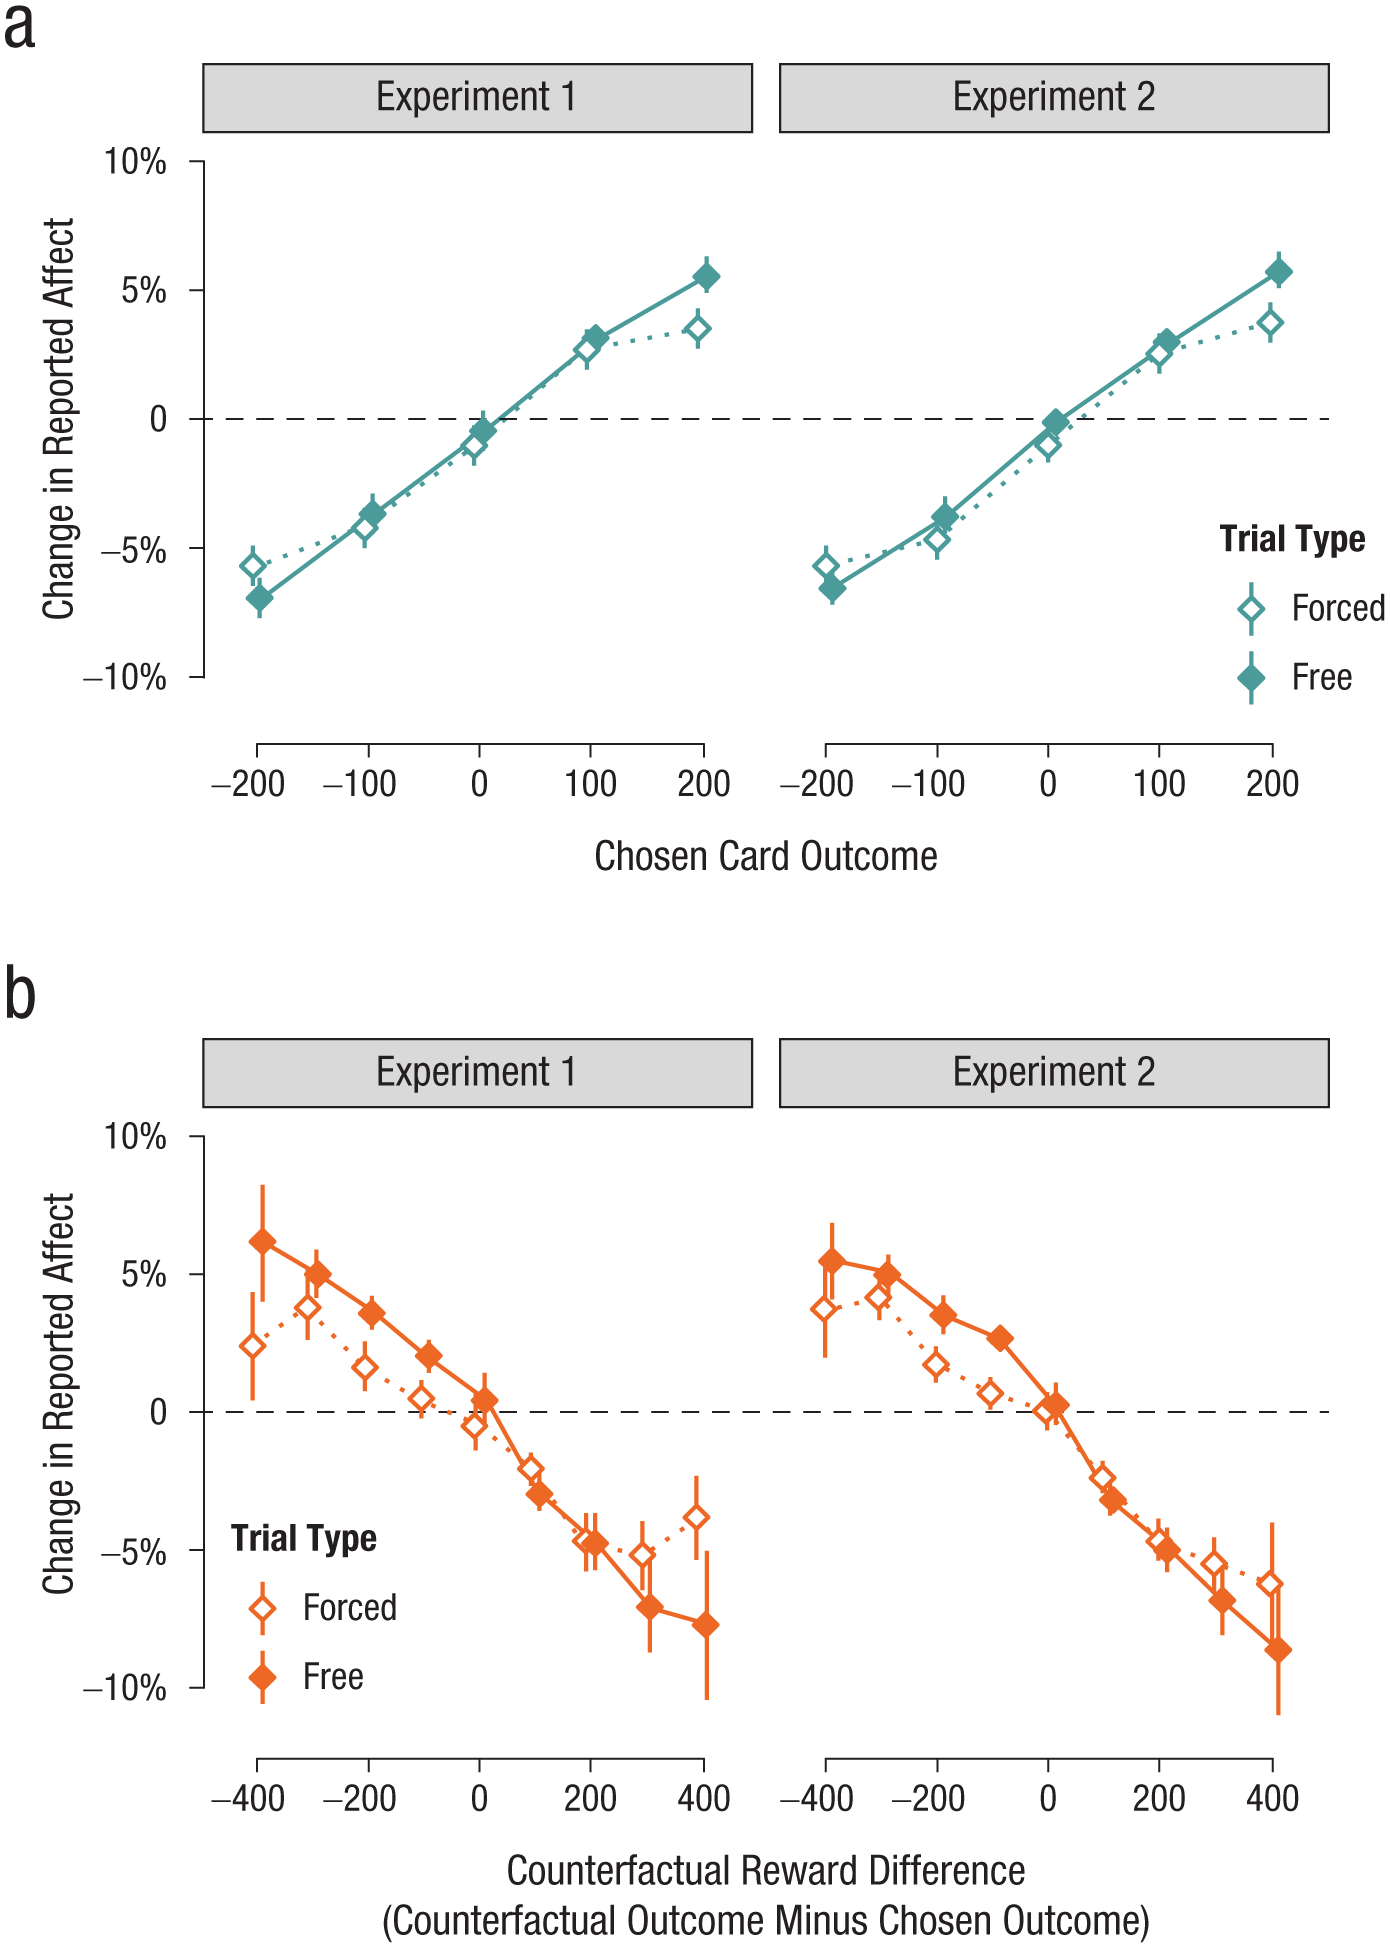
The effects of (a) chosen-card outcome and (b) counterfactual reward difference on subjective affect. Effects are measured as change in the valence of reported affect from the prior measurement (horizontal dashed line = no change in affect) as a function of the outcome type on the trial preceding the affect self-report. Results from forced-choice trials are presented in unfilled points and broken lines; results from free-choice trials are presented in filled points and solid lines. Error bars represent the 95% confidence interval of the mean.
In addition, we found a significant autoregressive effect of the preceding affect self-report on the current affect self-report (Experiment 1: β = 0.54, SE = 0.01, p < .001; Experiment 2: β = 0.54, SE = 0.01, p < .001), indicating that (as expected) there was substantial temporal autocorrelation in participants’ affect self-reports. Finally, we also found evidence that self-reported affect was more negative overall following forced-choice trials compared with free-choice trials (Experiment 1: β = −0.004, SE = 0.001, p = .01; Experiment 2: β = −0.004, SE = 0.01, p < .001). For full coefficient tables for all mixed-effects regression analyses, see Section S3 in the Supplemental Material.
Computational modeling results
Individual differences in affective reactivity were quantified using a computational model of participants’ affect self-reports. To do this, we first conducted a model-comparison analysis of competing computational models to identify the model that best fit the data. The results of this analysis (for more detail, see Section S4 in the Supplemental Material) indicated that the best-fitting model was Model M6, in which affect was driven by three appraisal types: chosen-card outcomes, counterfactual reward difference, and reward-prediction errors for the chosen-card outcome (i.e., the difference between the outcome of the chosen card and its mathematical expected value). In Model M6, each of these appraisals had asymmetric effects on participants’ affect; in other words, a participant’s affective reactivity was permitted to differ in magnitude for gain outcomes compared with loss outcomes, positive counterfactual reward difference compared with negative counterfactual reward difference, and positive negative reward-prediction errors compared with negative reward-prediction errors.
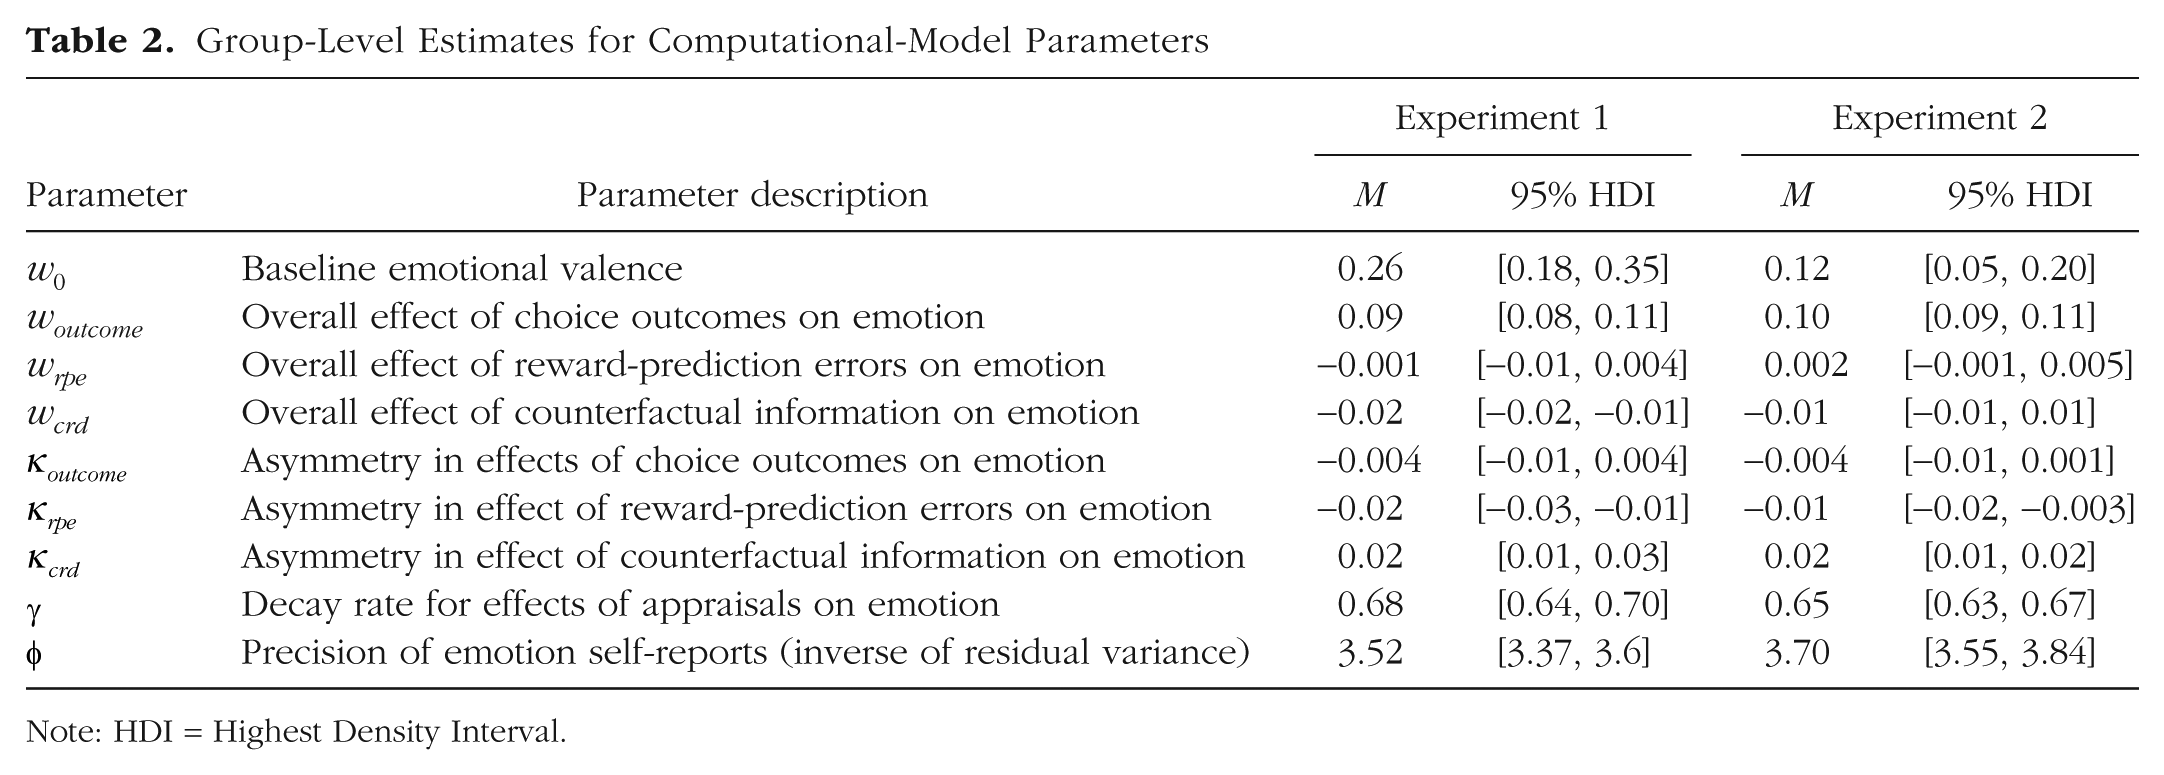
Group-level estimates for computational-model parameters, presented in Table 2, corroborate the results of the linear mixed-effects regression analyses above. Specifically, across both experiments, the mean of the group-level distribution of the woutcome parameter was credibly greater than zero, indicating that participants’ subjective affect improved following gain outcomes and deteriorated following loss outcomes. Likewise, the mean of the group-level distribution of the wcrd parameter was credibly less than zero, and the asymmetry parameter for counterfactual reward difference (
Group-Level Estimates for Computational-Model Parameters
Note: HDI = Highest Density Interval.
Parameter-symptom correlations
We next extracted participant-level estimates of each of the computational-model parameters described in Table 1 and used Spearman rank-order correlation analyses to investigate the associations between each of these parameters and participants’ self-reported symptom severity (for descriptive statistics and correlation matrices for all self-report scales, see Section S2 in the Supplemental Material). For results of these correlation analyses for the model parameters of primary interest, see Figure 3.
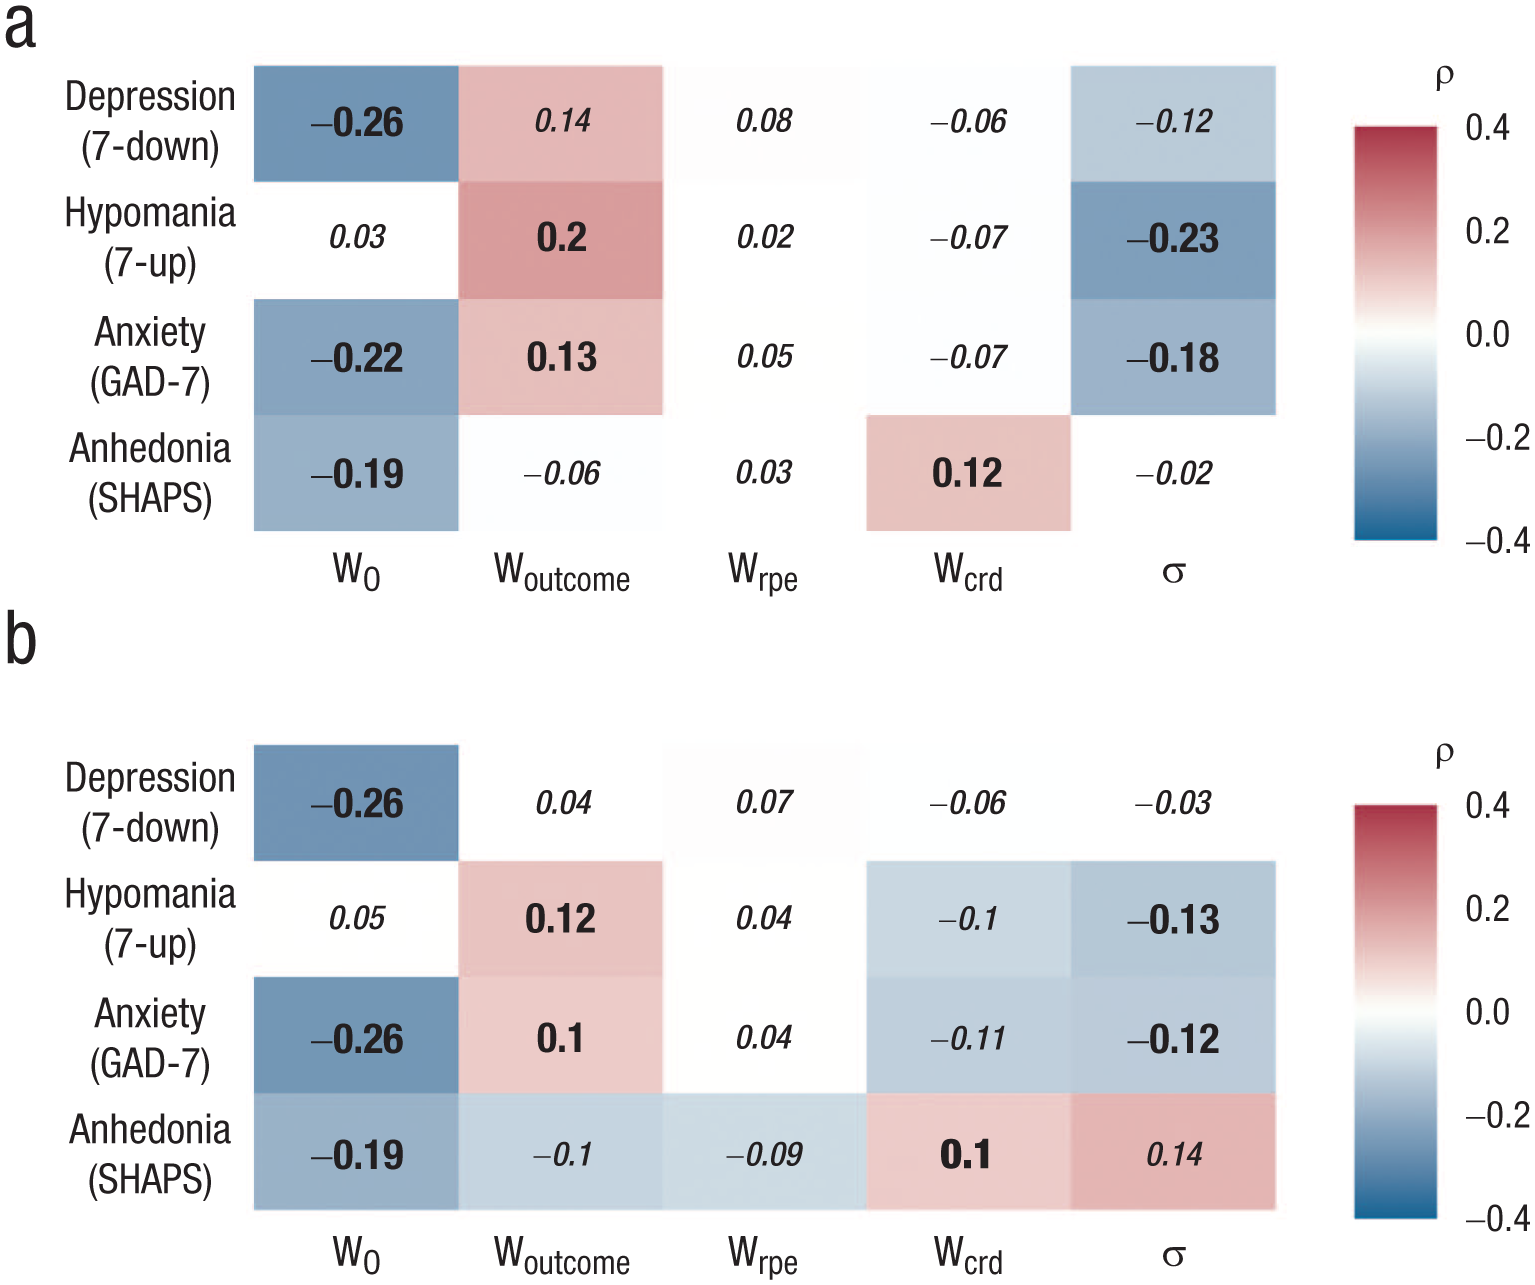
Strength of association between individual differences in emotional-disorder symptom severity (rows) and computational model parameters (columns) across (a) Experiment 1 and (b) Experiment 2. Correlations are Spearman rank-order correlations (ρ). Significant correlations in each experiment are presented on colored tiles, and correlations that were statistically significant in both experiments are presented in large bold text. In Experiment 1, correlations with an absolute value > .13 remained significant after false-discovery-rate correction for multiple comparisons. In Experiment 2, correlations with an absolute value > .09 remained significant after false-discovery-rate correction for multiple comparisons.
There were several noteworthy parameter-symptom correlations that emerged consistently across both experiments. First, more-severe symptoms of depression, anxiety, and anhedonia were all associated with a lower w0 parameter (leftmost column, Figs. 3a and 3b). Because a lower w0 parameter indicates a more negative average emotional valence, this correlation indicates that as expected, participants who self-reported more-severe emotional symptoms experienced more negative affect during the task, on average, independent of any of the events in the task (cf. Rutledge et al., 2017; see Fig. S7 in the Supplemental Material). Age was positively associated with w0, indicating that older participants tended to have more positive subjective affect, on average, during the task (see Table S10 in the Supplemental Material).
Second, across both experiments, we consistently found evidence for a weak positive association between participants’ affective reactivity to the outcome of the chosen card (woutcome parameter of model) and the severity of their symptoms of both hypomania (Fig. 4a; Experiment 1: ρ = .20, p < .001; Experiment 2: ρ = .12, p = .02) and anxiety (Fig. 4b; Experiment 1: ρ = .13, p = .02; Experiment 2: ρ = .10, p = .02). In other words, participants who experienced more-severe hypomania or anxiety tended to have more positive affective reactions to gaining points in the task and more negative affective reactions to losing points (for gain/loss correlations plotted separately, see Figs. S5 and S6 in the Supplemental Material).
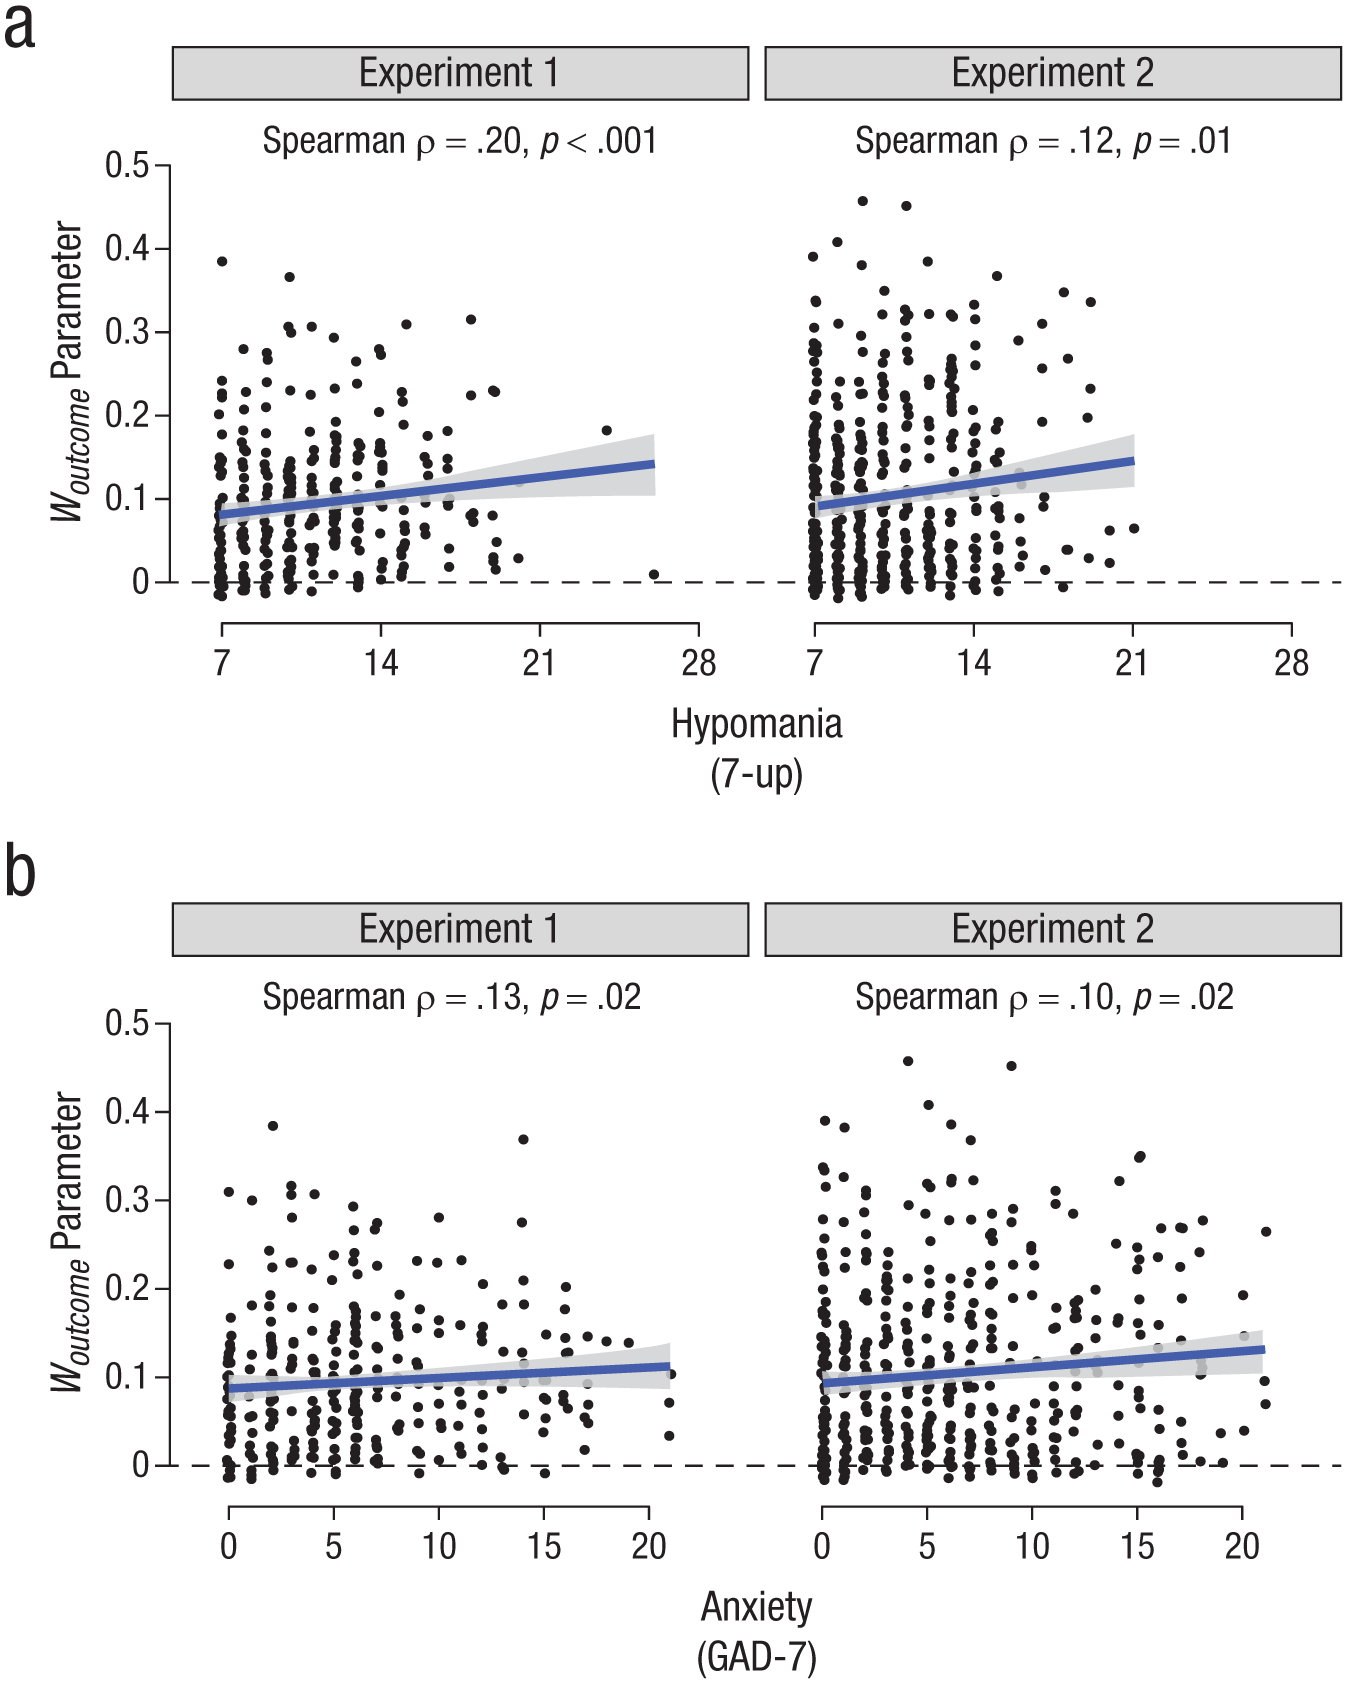
Scatterplots of individual differences in affective reactivity to choice outcomes (y-axis; woutcome parameter of computational model) as a function of emotional-disorder symptom severity. Trendlines indicate the linear association of best fit and its 95% confidence interval. The horizontal dashed line denotes woutcome = 0 (i.e., no effect of either reward or nonreward outcomes on subjective affect). (a) Correlations between hypomania (as measured by the 7-Up scale) and affective reactivity to choice outcomes. (b) Correlations between anxiety (as measured by the seven-item Generalized Anxiety Disorder scale) and affective reactivity to choice outcomes.
Third, we also found consistent evidence for a weak positive correlation between self-reported anhedonia and affective reactivity to counterfactual reward difference (wcrd parameter of model). Because the overall effect of counterfactual reward difference on affect was negative (per Fig. 2b), the positive sign of this correlation indicates that more-severe symptoms of anhedonia were associated with less affective reactivity to counterfactual reward difference (Fig. S8 in the Supplemental Material; Experiment 1: ρ = .12, p = .03; Experiment 2: ρ = .10, p = .03).
Finally, we found that both hypomania and anxiety were consistently associated with less precise emotion self-reports (σ parameter; rightmost column, Fig. 3; for scatterplots, see Fig. S9 in the Supplemental Material), indicating that greater unexplained variance in emotion self-reports was associated with more-severe symptoms of both hypomania (Experiment 1: ρ = −.23, p < .001; Experiment 2: ρ = −.13, p = .004) and anxiety (Experiment 1: ρ = −.18, p < .001; Experiment 2: ρ = −.12, p = .01).
For full correlation tables including all model parameters, see Section S7 in the Supplemental Material; there were no additional parameter-symptom correlations that were consistently significantly different from zero across both experiments other than those reported in Figure 3. For parameter-symptom correlation matrices for the additional self-report measures that participants completed in Experiment 2 and correlation matrices between different computational-model parameters, see the Supplemental Material, as are. Participants’ self-reported symptom severity tended to be significantly positively correlated across survey measures (e.g., correlations between anxiety and depression: Experiment 1, ρ = .72; Experiment 2, ρ = .73; correlation between anxiety and hypomania: Experiment 1, ρ = .20; Experiment 2, ρ = .22). We therefore conducted an exploratory factor analysis of data from both experiments to determine how model parameters were correlated with symptom severity across its latent dimensions. The results of this analysis (presented in more detail in Section S8 in the Supplemental Material) confirmed that affective reactivity to the outcome of chosen cards was associated with increased severity of both positive-affect emotional symptoms (e.g., hypomania, AIM positive intensity; ρ = .15, p < .001) and negative-affect emotional symptoms (e.g., depression, anxiety; ρ = .11, p < .001).
Test–retest reliability
To assess the test–retest reliability of affective reactivity to reward (woutcome parameter of computational model), we assessed the intraclass coefficient correlation (ICC) between two separate estimates of this parameter among a subsample of 150 participants from Experiment 2 who recompleted the task 1 month after initial data collection. We found that affective reactivity to reward showed relatively good test–retest reliability (ICC = .71, 95% CI = [.62, .78]), indicating that affective reactivity was a relatively stable characteristic of individuals over a duration of 1 month. Average mood (w0 parameter of model) similarly showed reasonable test–retest reliability (ICC = .63, 95% CI = [.52, .72]). By contrast, test–retest reliability for other model parameters was poor (see Table S12 in the Supplemental Material), suggesting that only model parameters quantifying affective reactivity to reward and average mood reliably measured stable trait-like variance between individuals. Conversely, test–retest reliability for self-reported symptom severity was generally good (with the exception of the SHAPS; see Table S14 in the Supplemental Material). This indicates that participants’ self-reports of their symptoms were largely reflective of trait-level individual differences in symptom severity rather than transient (state) fluctuations. However, several additional parameters displayed good internal consistency (split-half reliability; Table S13 in the Supplemental Material) at Time 1 despite poor test-retest reliability, suggesting that these parameters may be better conceptualized as reflecting state fluctuations in affective processing.
Discussion
The overarching goal of this project was to identify patterns of association between affect disturbance and emotional-disorder symptom severity in a large community sample. Specifically, we sought to determine how individual differences in affective reactivity as measured by computational modeling of affect self-reports within a controlled cognitive task were associated with individual differences in symptom severity for anxiety, depression, hypomania, and anhedonia. Across two experiments—an initial exploratory study, followed by a preregistered replication study—we consistently found that anxiety and hypomania symptoms were positively correlated with affective reactivity to both gain and loss outcomes within the task. That is, participants with more-severe symptoms of both anxiety and hypomania tended to have more positive affective reactions when their risky choices led to a gain outcome and more negative affective reactions when their risky choices led to a loss outcome. We also found good test–retest reliability for the computational-model parameter that quantified this affective reactivity to reward. Our results therefore suggest that heightened affective reactivity to reward is a trait-like individual difference that is associated with increased risk for multiple different forms of psychopathology, consistent with the transdiagnostic perspective on affect disturbance in psychological disorders (Barrett et al., 2007; Cludius et al., 2020; Kring, 2008).
Further analyses of other associations between computational-model parameters and emotional-disorder symptoms also revealed several additional replicable symptom-parameter correlations. First, we found that participants with more-severe anxiety, depression, and anhedonia all tended to have more negative baseline affect (measured by the w0 parameter of the model), consistent with earlier work using a similar computational model to compare participants with major depression and healthy control subjects (Rutledge et al., 2017). Second, we found that individuals with more-severe symptoms of anhedonia consistently showed less affective reactivity to information provided by counterfactual feedback (i.e., gain/loss outcomes of unchosen options). This result is notable because it runs against the trend for more-severe symptoms to be associated with greater affective reactivity but is conceptually in keeping with a perspective in which anhedonia is associated with blunted affective responses to eliciting stimuli (Shankman et al., 2014). Third, we also found that anxiety and hypomania symptoms were positively correlated with a model parameter quantifying residual variance in emotion, indicating that participants with more-severe anxiety and hypomania symptoms also showed more unsystematic variation in their affective valence, consistent with studies of emotion dysregulation in anxiety and bipolar disorder (C. Henry et al., 2008; Tan et al., 2012; for further discussion of the conceptual distinction between affective reactivity and emotion dysregulation, see below).
Affective reactivity as a phenotype associated with emotional-disorder symptoms
A predisposition toward affective disturbance has been proposed as a common substrate for psychopathology (Barrett et al., 2007). However, given the complexity of human affect dynamics, an important open empirical question is precisely what low-level affective phenotypes are shared across different symptom domains. Our finding that elevated affective reactivity was associated with more-severe symptoms of both anxiety and hypomania suggests that in the domain of the emotional disorders, affective reactivity is one such phenotype. However, we note that our results were obtained in a community sample of participants: Although it is likely from self-report results that some participants likely experienced anxiety and hypomania at clinically significant levels, in the absence of thorough clinical assessment, we cannot say with certainty which participants were actually experiencing emotional disorders at the time of assessment, and many participants were likely to be experiencing symptoms at subthreshold levels. In interpreting results, therefore, we must consider patterns of convergence between our results and previous results in clinical samples.
Although anxiety and hypomania can co-occur in people with bipolar disorder (Freeman et al., 2002), these two symptom domains are distinct domains of psychopathology. Hypomania, like its more-severe counterpart mania, is characterized by an excess of positive affect (Gruber, 2011) and has historically been conceptualized as having both internalizing components, such as euphoric affect and racing thoughts, and externalizing components, such as risk-taking behavior and hyperactivity (Carlson & Youngstrom, 2003). More recently, the Hierarchical Taxonomy of Psychopathology (Kotov et al., 2021) has conceptualized mania as comprising both internalizing symptoms and elements of thought disorder. By contrast, anxiety is a prototypical internalizing symptom (Eaton et al., 2013) associated with negative affect (Watson et al., 1988). Given these profound differences in phenomenology and clinical presentation, it is noteworthy that our results found evidence that elevated affective reactivity was associated with increased symptoms of both anxiety and hypomania. It is also striking, moreover, that in both symptom domains, participants with more-severe symptoms showed elevated affective reactivity in response to both gain outcomes and loss outcomes. This finding suggests that elevated affective reactivity in anxiety is not limited to negative reactions to threatening stimuli (cf. Goldin et al., 2009) and that elevated affective reactivity in hypomania is not limited to positive affect (cf. Gruber et al., 2011). Taken together, our results suggest that elevated affective reactivity may be a more general trait associated with a tendency to experience more-severe symptoms of emotional disorders (with respect to both positive affect and negative affect). This interpretation is supported by the findings of an exploratory factor analysis, which showed that affective reactivity was separately correlated with two latent constructs corresponding, respectively, to positive-domain emotional-disorder symptoms (e.g., hypomania, positive subscale of the Affect Intensity Measure) and negative-domain emotional-disorder symptoms (e.g., anxiety, depression, negative subscale of the Affect Intensity Measure). Thus, we reason that our observed findings are unlikely to be specific to anxiety or hypomania construed narrowly and may be better understood as reflecting an association between affective reactivity and emotional-disorder symptoms (in the domain of both positive affect and negative affect) more broadly.
There are three possible patterns of causality that might underlie the observed associations between affective reactivity and emotional-disorder symptom severity: First, affective reactivity may be a fundamental phenotype that confers risk for more-severe emotional-disorder symptoms; second, increased affective reactivity may be a consistent downstream consequence of emotional-disorder symptom severity; third, both affective reactivity and emotional-disorder symptom severity may be downstream consequences of some currently unknown genetic or environmental risk factor. Further longitudinal research is required to test these possibilities and thereby to disentangle the causal structure underlying our results.
Our results also contribute to a larger literature regarding affective reactivity in psychopathology. Previous findings regarding affective reactivity have been inconsistent: Although it has often been shown that affective reactivity is increased in different forms of psychopathology (Bylsma et al., 2011; Carthy et al., 2010; Ebner-Priemer et al., 2015; Goldin et al., 2009; Gruber et al., 2011; C. Henry et al., 2008; Houben et al., 2018; M’Bailara et al., 2009; Peeters et al., 2003; Tan et al., 2012), there are also contrary findings showing reduced affective reactivity in depression (Bylsma et al., 2008; Rottenberg et al., 2005) and blunted affect expression (although not necessarily reduced subjective affect intensity) in schizophrenia (J. D. Henry et al., 2007). Methodological differences may partly explain these inconsistencies: In depression, it has largely been the case that studies finding reduced affective reactivity have measured reactions to standardized laboratory mood inductions, whereas daily life studies of affect in response to personally meaningful events have tended to find increased affective reactivity in depression (Bylsma et al., 2011). The key distinction between these two findings may be the personal relevance of the eliciting stimuli; Guhn et al. (2018) showed that affective reactivity was significantly reduced in major depression in response to a standardized mood induction but that affective reactivity was significantly increased in major depression in response to a personalized mood induction containing autobiographical content. More broadly, in a community sample, it has also been shown that people higher in well-being tended to show weaker affective reactivity to positive daily life events, suggesting that reduced affective reactivity may be a protective factor against psychopathology (Grosse Rueschkamp et al., 2020). Taken together, these findings are broadly consistent with our overall proposition that affective reactivity is associated with increased risk for experiencing the symptoms of emotional disorders.
Affective reactivity and emotion dysregulation
Our findings should also be interpreted in the context of a large body of work suggesting that emotion dysregulation is a transdiagnostic affective disturbance associated with psychopathology (for a review, see Cludius et al., 2020). In contrast to affective reactivity, which refers to the magnitude or strength of an initial emotional response, emotion dysregulation refers to a failure or impairment of top-down regulatory processes, such as attention deployment, cognitive reappraisal, or emotion suppression (Gross, 1998, 2002). The two constructs—affective reactivity and emotion dysregulation—are therefore closely and reciprocally related but theoretically separable (Becerra et al., 2019; Davidson, 1998), given that emotion-regulation processes govern the magnitude and duration of the emotional state produced by an initial affective reaction to an eliciting stimulus. Thus, extreme emotional states in psychopathology could conceivably result from either excessive affective reactivity, dysfunctional emotion regulation, or both; that is, individuals may experience affect disturbance in response to an eliciting stimulus because either they have an aberrantly strong initial affective reaction that overwhelms their capacity for emotion regulation or deficits in emotion-regulation processes produce a dysfunctional response to a nonpathological initial affective reaction. This theoretical distinction notwithstanding, however, it remains a complex task to disentangle affective reactivity from emotion regulation in empirical data like those we analyzed in the present study (Gross & Feldman Barrett, 2011). Nevertheless, we suggest that an important implication of our findings is to suggest that transdiagnostic patterns of affect disturbance in psychopathology are not solely the result of dysfunctions in effortful top-down emotion regulation but may also result from bottom-up dysfunctions in the magnitude of the affective response itself.
Limitations and future directions
The present study had several limitations that should be noted. First, our study was conducted in a community sample of participants recruited online, and participants self-reported the severity of their symptoms. This design enabled us to collect data at scale on both affective reactivity and emotional-disorder symptoms, but it remains an empirical question whether findings will generalize to clinical samples in which participants have been diagnosed by clinicians with clinically significant anxiety or (hypo)mania. On the basis of our findings in the present study, we would predict greater affective reactivity in both of these populations relative to healthy control subjects. Future research should test this hypothesis. Separately, a measurement-related limitation of our study is that we assessed subjective affect using a bipolar scale (i.e., a slider with negative affect at one end and positive affect at the other). Although use of a bipolar scale is consistent with other recent studies implementing computational models of affect (e.g., Eldar & Niv, 2015; Forbes & Bennett, 2024; Rutledge et al., 2014), work in other fields has tended to use separate unipolar scales for the intensities of positive and negative affect (see e.g., Russell & Carroll, 1999). The unipolar-scale approach is more theoretically flexible in the sense that it allows for positive and negative affect to vary independently of one another; by contrast, in measurements on a bipolar scale like the one we used, positive and negative affect are assumed to be perfectly anticorrelated. Future work in this space could address the reactivity of positive and negative affect separately by using unipolar-measurement rather than bipolar-measurement scales. Finally, a further limitation of our article is that we did not collect data on participants’ racial/ethnic identification (although we did collect data on their gender, geographic background, and education level).
The effects of choice agency and reward-prediction errors on subjective affect
Finally, our results also shed light on several underlying theoretical questions concerning affective reactivity. In our behavioral task, we manipulated both the degree of agency that participants had over choices (free- vs. forced-choice trials) and whether participants were provided with counterfactual information about the outcomes of unchosen options. In line with our previous research using a variant of this task (Forbes & Bennett, 2024), we found that both manipulations influenced participants’ affective reactivity.
For choice agency, we found evidence that participants’ affect was more negative, on average, after viewing outcomes of forced-choice trials compared with free-choice trials. Previous studies have provided strong evidence that humans show a strong preference for exerting control over decisions that concern them even when there is no advantage to be gained by exerting this control (Cockburn et al., 2014; Wang et al., 2021). From this perspective, forced-choice trials may have represented a violation of participants’ generalized desire for control and therefore induced negative affect. Moreover, in addition to the main effect of choice agency, we also found evidence that choice agency moderated the effect of other appraisals on subjective affect: Participants showed significantly larger affective reactions to both choice outcomes and counterfactual-reward-difference choices after free-choice trials compared with forced-choice trials. We interpret this result in line with the action-inaction asymmetry, whereby outcomes of choices that involve an explicit action (e.g., the free choices in the present study) tend to influence subjective affect more strongly than choices that do not involve an explicit action (for a review, see Bennett et al., 2022).
Finally, we note that our results are in line with other recent studies showing that reward-prediction errors have a relatively marginal effect on subjective affect after outcome amounts are accounted for (Forbes & Bennett, 2024). We found that the dominant factor driving fluctuations in subjective affect within our task was the magnitude of gain/loss outcomes; reward-prediction errors (i.e., whether these gain/loss amounts were more or less than expected) had a relatively small effect by contrast. Indeed, computational modeling revealed that only negative reward-prediction errors (outcomes that were less than expected) influenced subjective affect, and the effect size was substantially less than the effect size for outcome amount. This is consistent with results previously reported by Forbes and Bennett (2024) and is noteworthy in light of a number of recent computational models positing that reward-prediction errors are a core appraisal that drives fluctuations in mood and subjective affect (Bennett & Niv, 2020; Eldar et al., 2016; Eldar & Niv, 2015; Rutledge et al., 2014). This proposition is difficult to reconcile with our findings, which instead suggest a comparatively small role for reward-prediction errors in driving subjective affect. Resolving this apparent impasse is an important task for future research.
Supplemental Material
sj-pdf-1-cpx-10.1177_21677026251393622 – Supplemental material for Heightened Affective Reactivity Is Associated With More-Severe Symptoms of Emotional Disorders
Supplemental material, sj-pdf-1-cpx-10.1177_21677026251393622 for Heightened Affective Reactivity Is Associated With More-Severe Symptoms of Emotional Disorders by Ashleigh Fulton, Laura Forbes, Suresh Sundram and Daniel Bennett in Clinical Psychological Science
Footnotes
Acknowledgements
A preprint of the initial author-submitted version of this manuscript was posted to PsyArXiv. D. Bennett is now at the Melbourne School of Psychological Sciences, The University of Melbourne.
Transparency
Action Editor: DeMond M. Grant
Editor: Jennifer L. Tackett
Author Contributions
References
Supplementary Material
Please find the following supplemental material available below.
For Open Access articles published under a Creative Commons License, all supplemental material carries the same license as the article it is associated with.
For non-Open Access articles published, all supplemental material carries a non-exclusive license, and permission requests for re-use of supplemental material or any part of supplemental material shall be sent directly to the copyright owner as specified in the copyright notice associated with the article.