
Abstract
Several large randomized controlled trials (RCTs) have shown that adding alcohol-avoidance training to abstinence-oriented treatment for alcohol use disorders leads to reduced relapse rates. Given the consistently positive but relatively modest magnitude of these effects (i.e., an overall risk reduction of 7.1%, comparable with current medication for alcohol use disorders), we conducted a double-blind, multisite RCT (N = 247) to examine the effect of combining alcohol-avoidance training with an intervention aimed at reducing the attentional bias toward alcohol-related stimuli. Using a 2 × 2 factorial design, we found that neither intervention resulted in a reduction in the number of relapses or alcohol-related problems (assessed at 3, 6, and 12 months after completion of the 6-week training regimen). In fact, alcohol-avoidance training even tended to increase (rather than decrease) relapse rates. Cognitive-bias indices were also unaffected by the two interventions. Possible explanations for these null findings are discussed.
Keywords
More than a decade ago, Wiers et al. (2011) reported that alcohol-dependent patients who, in addition to receiving abstinence-oriented treatment, were trained to avoid alcohol-related stimuli in a computerized classification task (referred to hereafter as the “approach-avoidance task [AAT]”) were less likely to relapse over a 1-year follow-up period compared with patients who received no training or a sham training (i.e., a 13.1% reduction). This finding was not only important from a clinical point of view, it also had major theoretical implications in that it supported dual-process theories of addiction (see Stacy & Wiers, 2010; Wiers et al., 2013). According to these theories, addiction is a function of both controlled, rule-based cognitive processes (often referred to as “explicit processes”) and cognitive processes that operate under automaticity conditions (i.e., in the absence of awareness, certain goals, substantial time, and/or substantial cognitive resources; referred to hereafter as “implicit processes”; for an in-depth discussion of the automaticity concept, see Moors & De Houwer, 2006). One example of an implicit process believed to drive addictive behavior is the automatic tendency to approach alcohol-related stimuli (Field et al., 2008; Stacy & Wiers, 2010; Wiers et al., 2009). The observation by Wiers et al. (2011) that a cognitive-bias-modification (CBM) intervention aimed at changing automatic approach-avoidance tendencies led to a reduction in the likelihood of relapse to addiction was a strong argument in favor of the causal nature of the relationship between automatic approach-avoidance tendencies and addiction behavior (but see Wiers et al., 2020).
These findings reported by Wiers et al. (2011) have since been replicated several times but not always with the same magnitude. Specifically, whereas Salemink et al. (2022) reported a 10.1% reduction in relapse rate over a 1-year follow-up period as a result of alcohol-avoidance training (i.e., roughly the same order of magnitude as initially reported by Wiers et al., 2011), a (nonsignificant) reduction of only 4.0% was reported by Manning et al. (2022). 1 Two other studies lie in between: a reduction of 7.7% 2 reported by Rinck et al. (2018) and a reduction of 8.5% reported by Eberl et al. (2013). Taken together, the overall relapse reduction in these studies is 7.1%, 3 which corresponds to a number needed to treat (NNT) of 14. Given that alcohol-avoidance training involves the administration of several training sessions over a period of several weeks, an improvement in the average number of patients who are required to be treated to prevent one additional adverse outcome could be clinically relevant.
Dual-process theories of addiction (see Stacy & Wiers, 2010) posit that addiction is driven by not only automatic approach-avoidance tendencies but also the automatic tendency to allocate attention to substance-related stimuli (e.g., Field & Cox, 2008; Wiers et al., 2013). It could thus be argued that alcohol-avoidance training should go hand in hand with an intervention aimed at changing the attentional bias toward alcohol-related stimuli (e.g., Boffo et al., 2015; Rinck et al., 2018; Schoenmakers et al., 2010; but see Heitmann et al., 2021). Initial evidence published by Rinck et al. (2018) seemed to refute this hypothesis (i.e., relapse rates were roughly the same in patients exposed to both CBM interventions as in patients exposed to either intervention), but the exact makeup of their study prevented them from drawing firm conclusions concerning this matter. Specifically, Rinck et al. wanted to keep the number of training sessions constant across conditions (i.e., six sessions), and patients were always exposed to just one training task within a session. As a result, patients exposed to both CBM interventions completed just three sessions of attentional-bias training and three sessions of alcohol-avoidance training. It could thus be argued that patients were simply insufficiently exposed to either intervention to allow for a meaningful examination of their combined effect (as acknowledged by Rinck et al., 2018).
Accordingly, in the present RCT (Trial No. NCT03338361), we adopted a 2 × 2 factorial design in which all participants completed both an alcohol-avoidance training (sham vs. real) and an attentional-bias training (sham vs. real) in each of six sessions. Patients (final N = 163; see below) were recruited from two specialist alcohol-dependence treatment units in Belgium: Psychiatric Hospital “Heilig Hart” (Ypres; n = 86) and “KARUS” (Ghent; n = 77). They completed six training sessions at a rate of one session per week, which is in line with the recommendations of Eberl et al. (2014), Rinck et al. (2018), and Boffo et al. (2019). To allow for a direct comparison of the two CBM interventions, special care was taken to maximize their comparability. More specifically, (a) the same stimulus materials were used for both tasks, (b) the number of training trials was identical, and (c) the same training contingencies were used for both tasks (i.e., 87.5% vs. 50.0% in the real-training condition and the sham-training condition, respectively).
Severity of alcohol-related problems as measured by the Alcohol Use Disorders Identification Test (AUDIT; Saunders et al., 1993), relapse rates, and cognitive biases were assessed after 3, 6, and 12 months, for which, we expected similar findings or even better results (i.e., reduced drinking behavior and complementary changes in approach and attentional biases in the real-training condition compared with the respective sham-training condition). Given our focus on the efficacy of the two CBM interventions, the analyses were restricted to participants who completed the treatment(s) as planned (i.e., a per-protocol analysis), as recommended by Silverman et al. (2024) and Tripepi et al. (2020). For exploratory purposes, we also included a craving measure and a measure of the extent to which participants believed in the efficacy of the CBM interventions. For both the AUDIT and the relapse data, we examined whether (any) CBM effects were dependent on participants’ (self-reported) craving and/or credibility.
Transparency and Openness
The study was (a) approved by the Medical Ethics Committee of Ghent University Hospital on October 13, 2017 (Belgian Registration No. B670201733430), (b) preregistered at ClinicalTrials.gov under Trial No. NCT03338361, and (c) carried out in accordance with the provisions of the World Medical Association Declaration of Helsinki. We report how we determined our sample size, all data exclusions, all manipulations, and all measures in the study. The aggregated data from this study, the accompanying SPSS analysis script, and all stimulus materials are publicly accessible via Figshare.com (see Spruyt, 2024a, 2024b, 2024c).
Method
Participants
A total of 300 potential participants were screened for eligibility. All were abstaining alcohol inpatients admitted to two specialist alcohol-dependence treatment units in Belgium: Psychiatric Hospital “Heilig Hart” (Ypres) and “KARUS” (Ghent). Participation was possible only if they spoke Dutch, were literate, had successfully completed detoxification with benzodiazepines (i.e., between 7 and 20 days after admission), and were committed to treatment with the goal to remain abstinent. Participants were excluded when presenting a neurological condition (e.g., Korsakoff syndrome), cognitive problems (i.e., a score below 26 of 30 on the Montreal Cognitive Assessment; Nasreddine et al., 2005), intellectual disability, psychotic disorders, visual deficits, or motor problems in the hands. In the end, 247 patients participated in the study, which approximates the preregistered target sample size of 250 patients. In addition to the CBM interventions, all participants received standard treatment (i.e., cognitive-behavioral therapy complemented with system therapy and psychoeducation).
Participants were randomly assigned to one of four conditions resulting from the orthogonal manipulation of the AAT training regimen (i.e., real training vs. sham training) and the visual-probe-task (VPT) training regimen (i.e., real training vs. sham training). Participants and staff interacting with participants, including outcome assessors, were blind to the condition allocation (for more details, see below). Given that we were mainly interested in per-protocol effects, the data of 84 patients were excluded from all analyses for two reasons (but see Note 4). First, 67 participants failed to complete at least one of the eight sessions (i.e., six training sessions and two assessment sessions, see below). Second, 17 participants restarted at least one session (most likely because they had encountered technical difficulties), resulting in an excess of CBM trials. The per-protocol sample thus consisted of 163 participants; for detailed group characteristics at baseline, see Table 1. At three follow-up moments, drinking behavior was assessed by telephone via structured interviews (see Deane et al., 2014; Field et al., 2017), which were based on the AUDIT (Saunders et al., 1993). At the first follow-up moment (i.e., 3 months after completing the CBM intervention), we reached 94.48% of the final sample (n = 154). Because of an experimenter error, however, six data points were lost, leading to a final sample size of 148 (90.80% of the original sample). At the second and third follow-up moments (i.e., 6 and 12 months after completing the CBM intervention, respectively), we reached 84.66% (n = 138) and 74.23% (n = 121), respectively, of the original sample. These retention rates are well in line with those reported in the literature (Hallgren & Witkiewitz, 2013; Witkiewitz et al., 2014). For the CONSORT patient-flow diagram, see Figure 1. All participants gave explicit informed consent before participation.
Group Characteristics at Baseline as a Function of Training Condition (Standard Deviations or Percentages in Parentheses)
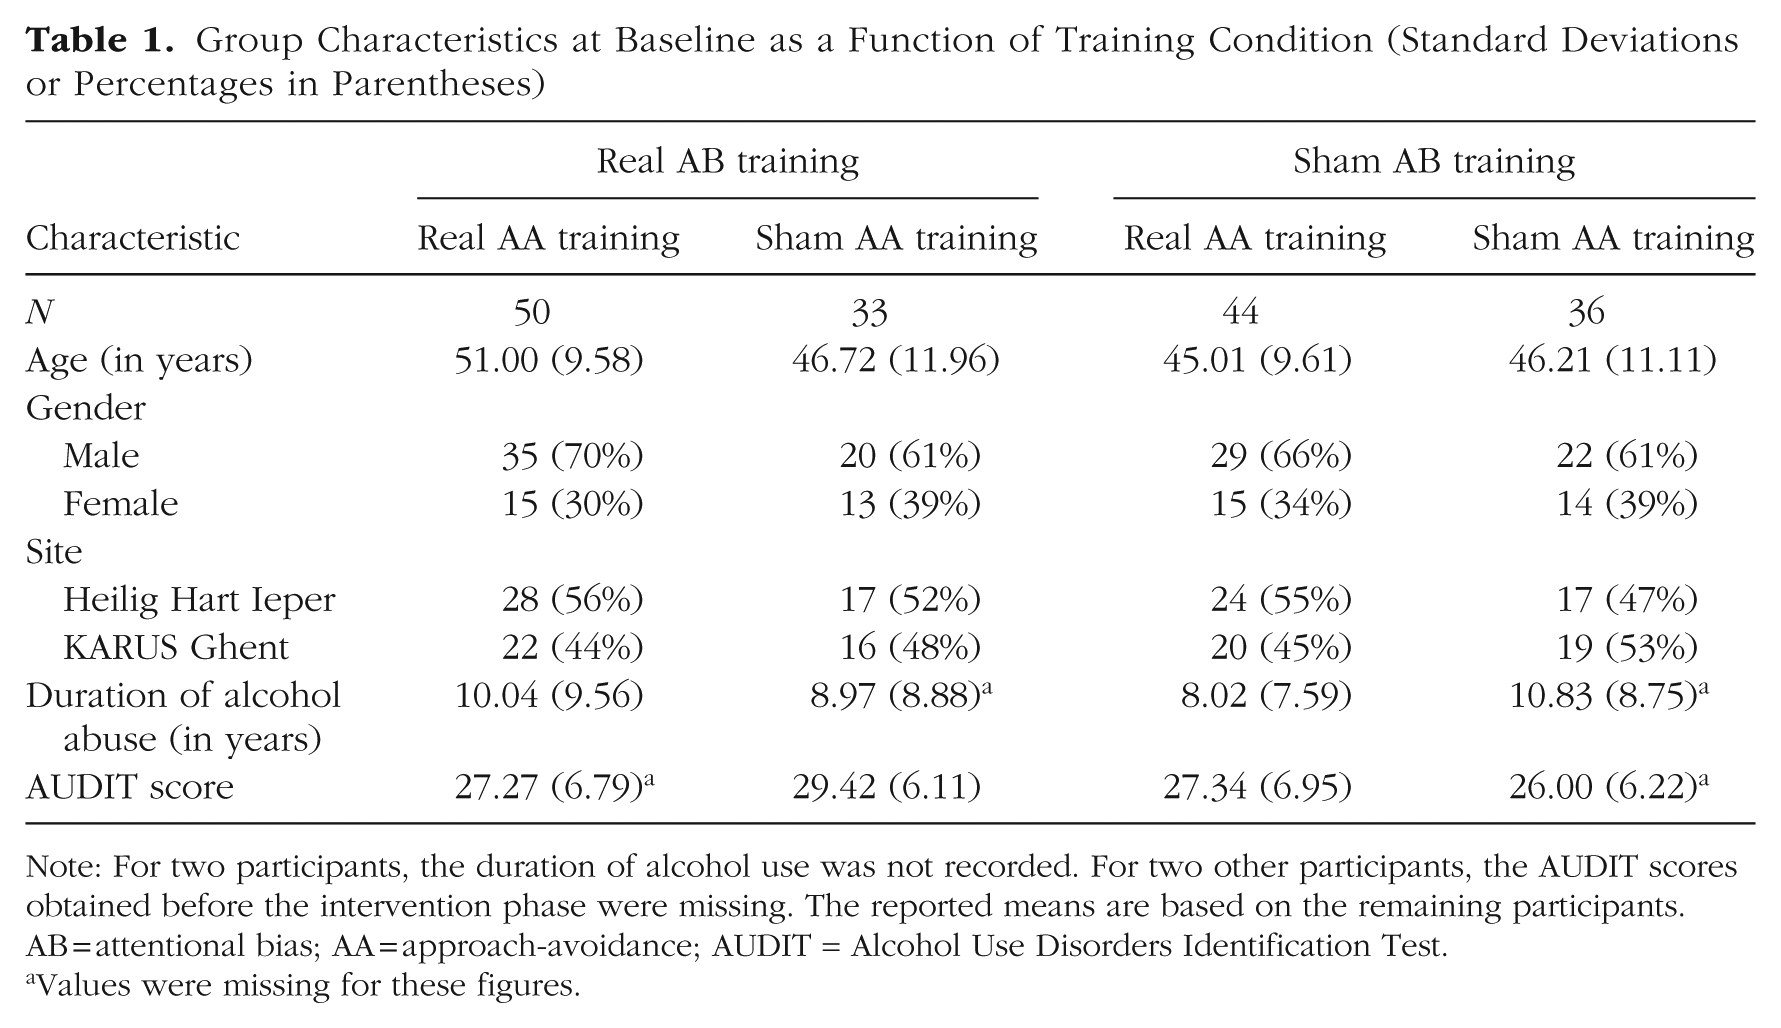
Note: For two participants, the duration of alcohol use was not recorded. For two other participants, the AUDIT scores obtained before the intervention phase were missing. The reported means are based on the remaining participants. AB = attentional bias; AA = approach-avoidance; AUDIT = Alcohol Use Disorders Identification Test.
Values were missing for these figures.
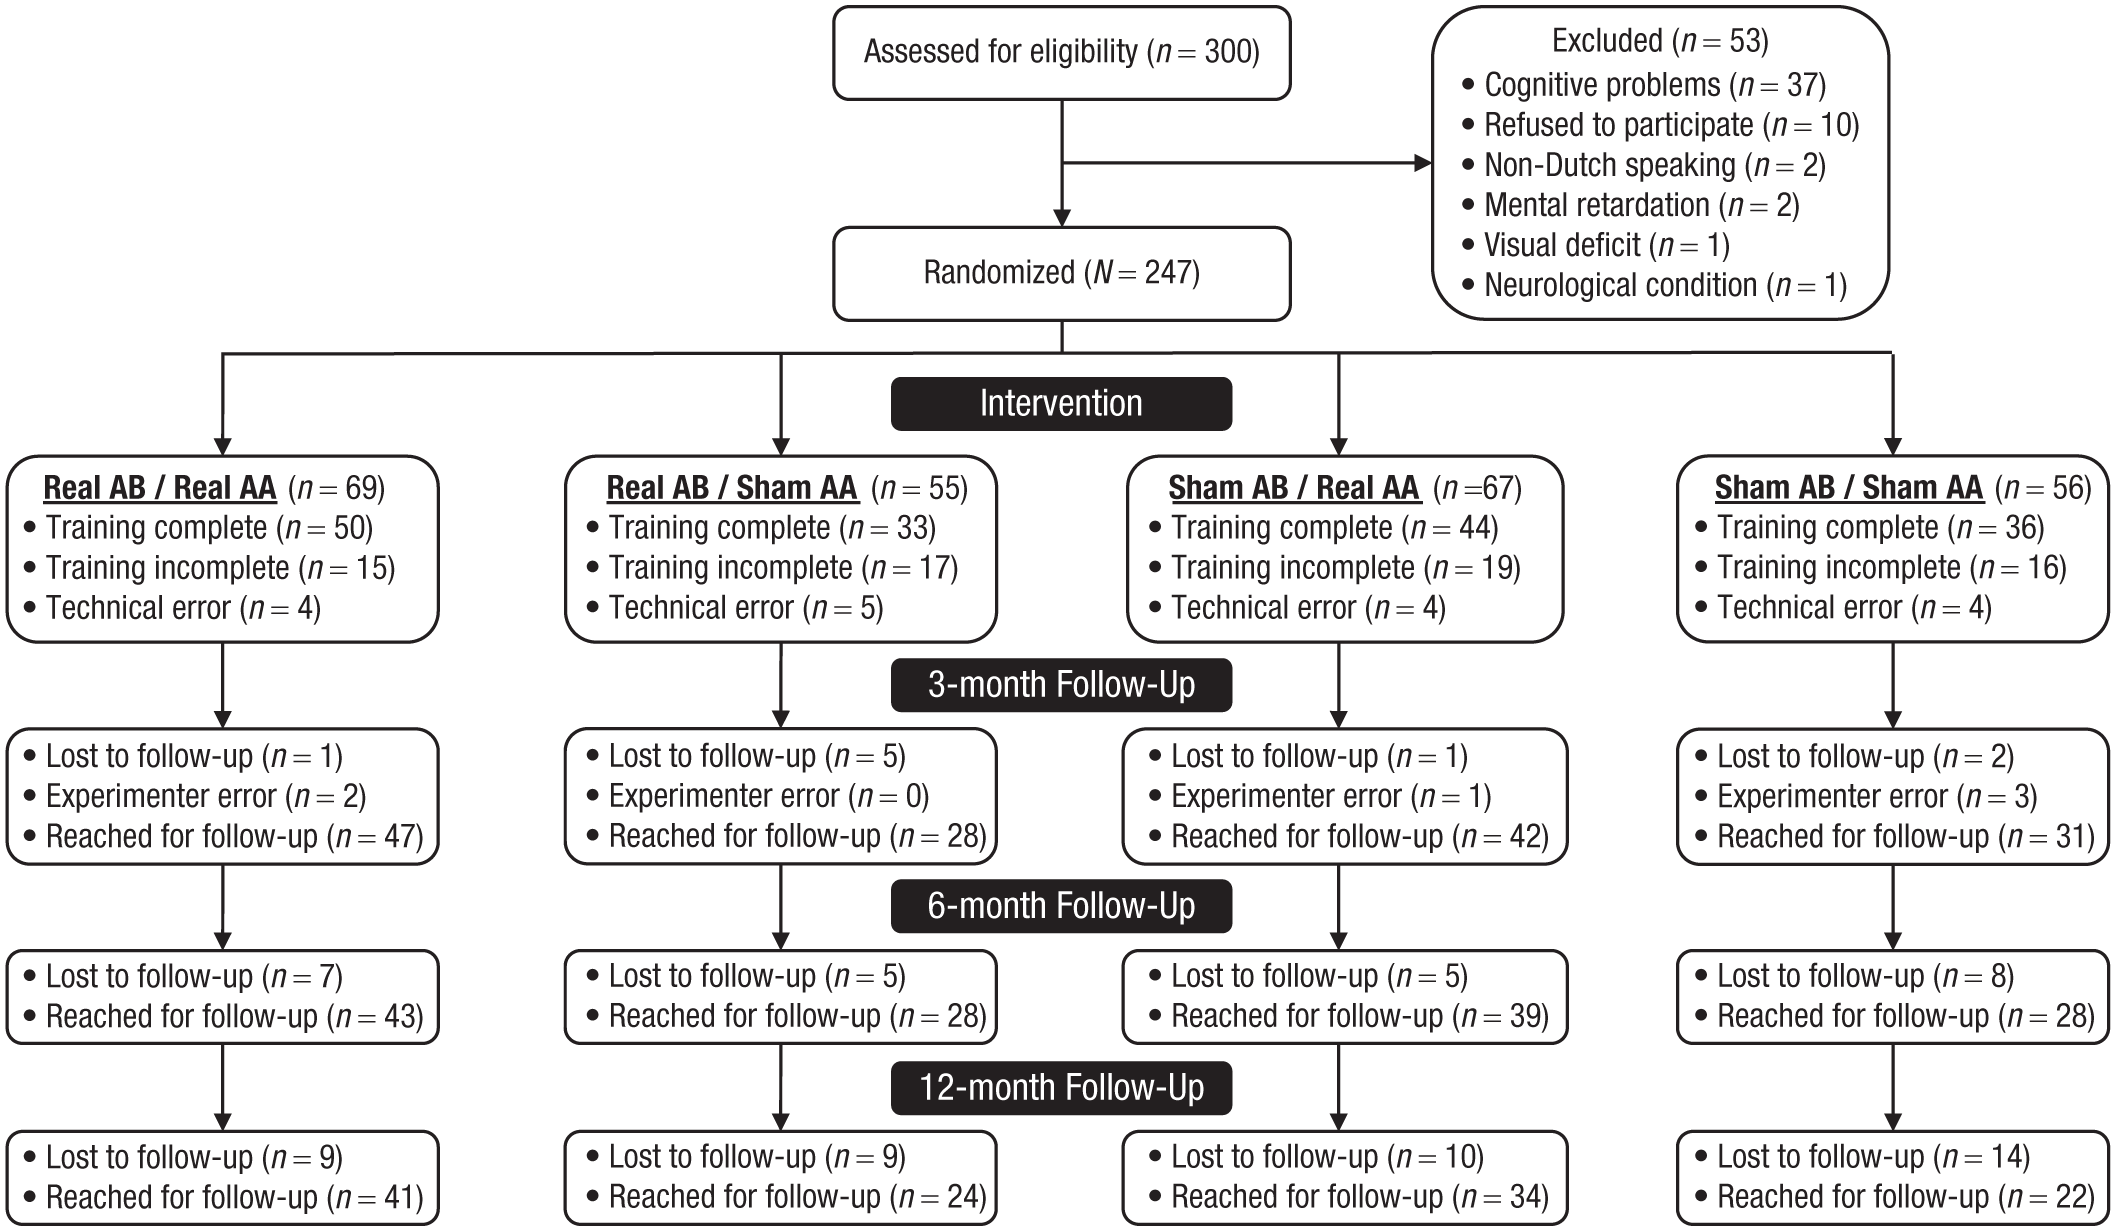
CONSORT flow diagram. AB = attentional-bias training. AA = approach-avoidance training.
Procedure
Group assignment and temporal course
The CBM interventions were delivered via dedicated JavaScript web application. Upon registration, participants were automatically assigned to the real- and sham-training conditions of the alcohol-avoidance training and the attentional-bias training using a built-in random integer generator. During each session, participants completed an AAT and a VPT, in close succession. The order of the two tasks was randomized at the level of the participant (and kept constant across sessions for each individual participant). In total, participants completed eight AAT/VPT sessions. The first and last sessions were measurement sessions (referred to hereafter as “M1” and “M2,” respectively). The remaining sessions were training sessions using either a real-training regimen or a sham-training regimen (referred to hereafter as “T1”, “T2”, “T3”, “T4”, “T5”, and “T6”). Participants completed one session per week, in principle at the time of their choice within that 1-week window. Sessions that were not completed during the specified time window were canceled, thereby ensuring that all respondents followed the same temporal course. The analyses reported below are restricted to patients who completed all eight sessions (but see Note 4). After the last measurement session (i.e., M2), patients were contacted three more times (i.e., after 3, 6, and 12 months) to assess their alcohol consumption.
Stimulus selection for AAT and VPT
The pictures used in the AAT and the VPT were sampled from a large pool of 660 pictures (500 × 500 pixels). Half of the pictures in this picture pool displayed alcoholic drinks (n = 330 pictures), evenly divided into three subcategories: wine (n = 110 pictures), beer (n = 110 pictures), and liquor (n = 110 pictures). The other half displayed nonalcoholic drinks (n = 330 pictures), again evenly divided into three subcategories: water (n = 110 pictures), soft drinks (n = 110 pictures), and a residual category including coffee, tea, chocolate milk, and so on (n = 110 pictures). Each subcategory (e.g., beer) included 11 pictures of 10 different exemplars (e.g., a specific beer well known on the Belgian market, i.e., Westmalle Trippel): four pictures in which a male model was actively manipulating the exemplar (i.e., holding, drinking, opening, or serving), four pictures in which a female model was actively manipulating the exemplar, and three pictures showing the exemplar in a passive manner (i.e., the exemplar standing on a table, either alone or next to an empty or a filled glass).
For each individual respondent, 10 sets of 24 pictures each were randomly sampled (without replacement) from this picture pool. Each set included two randomly selected pictures for each of the 6 × 2 picture categories that resulted from the orthogonal manipulation of the (six) subcategories and the presence versus absence of a model. Two unique picture sets (i.e., one for the AAT and one for the VPT) were used for each of the two measurement sessions (i.e., M1 and M2). Three other picture sets were used for the first three AAT sessions (i.e., T1–T3) and for the last three VPT sessions (i.e., T4–T6). The three remaining picture sets were used for the first three VPT sessions (i.e., T1–T3) and for the last three AAT sessions (i.e., T4–T6). In sum, the same stimulus materials were used for the real/sham-training sessions of the AAT and the VPT, thereby maximizing their comparability.
AAT and alcohol-avoidance training
Each AAT trial started with the presentation of a fixation cross for 500 ms in the center of the screen. Next, after an interval that varied between 500 ms and 1,000 ms, a picture was presented (i.e., alcohol-related or alcohol-unrelated), slightly rotated to the left or to the right (i.e., 5°). The written instructions made it clear that participants were expected to press the up- or down-arrow key as quickly as possible in response to the rotation of these stimuli. Holding down the down-arrow key was described as “pulling a drink towards oneself” and resulted in a gradual increase in size of the presented stimulus over an interval of 750 ms (see Wiers et al., 2011). Conversely, holding down the up-arrow key was described as “pushing a drink away from oneself” and resulted in a gradual decrease in size of the presented stimulus, again over an interval of 750 ms. In sum, similar to the original study by Wiers et al. (2011), the required response was unrelated to the content of the stimuli. Whether a left or right rotation required an approach or an avoidance response was determined at random at the level of the individual participant (i.e., kept constant across all sessions for a given participant). Trials with no response within 3,000 ms were aborted. A short message then appeared in which the participants were urged to respond more quickly, and the instructions were repeated. Upon detection of an erroneous response, a red “X” was presented (centered on the horizontal axis, beneath the location of the photos on the vertical axis) until participants emitted the correct response or 3,000 ms had elapsed. Each new trial started after an interval of 500 ms.
In each session, the AAT included eight practice trials, followed by two blocks of 96 trials each. In each block, each stimulus was presented exactly four times, and each rotation occurred exactly 48 times. Both in the measurement and sham-training sessions, the rotation of the pictures was independent of the type of drink displayed. More specifically, each picture of the relevant set (see above) was presented twice in a left rotation and twice in a right rotation. In contrast, for the actual training sessions, the rotation of the pictures was confounded with the type of drink displayed. More specifically, six alcoholic drinks and six nonalcoholic drinks were presented in a rotation that required an approach response or an avoidance response, respectively (i.e., two drinks per subcategory, one with a model and one without a model). On the remaining trials, this response mapping was reversed. In sum, the proportion of incompatible trials (i.e., alcoholic drinks that required an avoidance response or nonalcoholic drinks that required an approach response) was either 50% (i.e., in the measurement sessions and the sham-training sessions) or 87.5% (i.e., in the real-training sessions). Note that the inclusion of a limited number of compatible trials (i.e., alcoholic drinks that required an approach response or nonalcoholic drinks that required an avoidance response) during the training sessions made it possible to monitor the emergence of differences between the real-training condition and the sham-training condition throughout the entire study. In addition, using both compatible and incompatible trials during the training sessions made it less easy for respondents to determine whether they had been assigned to the real-training condition or the sham-training condition. For the practice trials, two geometric figures were used as stimuli (i.e., a square and a circle, presented on a gray background). They were both rotated twice to the left and twice to the right.
VPT and attentional-bias training
The VPT was modeled after Boffo et al. (2015). Similar to the AAT, each VPT trial started with the presentation of a fixation cross for 500 ms in the center of the screen. Next, after an interval that varied between 500 ms and 1,000 ms, an alcohol-related and an alcohol-unrelated picture were presented, either for 500 ms (referred to hereafter as the “short-cue duration”) or 1,000 ms (referred to hereafter as the “long-cue duration”). One of these two pictures was presented to the left of the fixation cross, and the other stimulus was presented to the right of the fixation cross. At the offset of the pictures, the letter “E” or “F” was presented for a maximum duration of 750 ms, either to the left or to the right of the fixation cross. Written instructions made it clear that participants were expected to decide as quickly as possible whether the letter presented was an “E” or an “F” by pressing one of two keys (i.e., the up-arrow key and the down-arrow key, respectively). Trials with no response within 3,000 ms were aborted. A short message then appeared in which the participants were urged to respond more quickly, and the instructions were repeated. Upon detection of an erroneous response, a red “X” was presented (centered on the horizontal axis, beneath the location of the photos on the vertical axis) until participants emitted the correct response or 3,000 ms had elapsed. Each new trial started after an interval of 500 ms.
In each session, the VPT included eight practice trials, followed by two blocks of 96 trials each. For each block, the 24 available stimuli (see above) were semirandomly combined into 12 pairs with the following restrictions: (a) Each pair had to consist of an alcohol-related picture and an alcohol-unrelated picture, and (b) either both pictures of a pair showed a model or neither picture showed a model. Each pair was presented four times using the short-cue duration and four times using the long-cue duration. In each level of the cue-duration variable, the location of the alcohol-related picture was perfectly balanced (i.e., the alcohol-related picture of a stimulus pair was twice presented in the left location and twice presented in the right location). In each block, each probe stimulus (i.e., the letters “E” and “F”, see above) was presented exactly 48 times (i.e., 24 times in the left location and 24 times in the right location). In both the measurement sessions and the sham-training sessions, the location of the probes was statistically independent of (a) the location of the alcohol-related cues, (b) the duration of cues, and (c) the presence or absence of a model. In contrast, for the actual training sessions, the location of the probes was confounded with the type of drink displayed. More specifically, each block included exactly 12 (compatible) trials on which the probes were presented on the same location as the alcoholic drink (i.e., six using the short-cue duration and six using the long-cue duration) and 84 (incompatible) trials on which the probes were presented in the same location as the nonalcoholic drink. In sum, identical to the AAT, the proportion of incompatible trials was either 50% (i.e., in the measurement sessions and sham-training sessions) or 87.5% (i.e., in the real-training sessions). Again, the inclusion of a limited number of compatible trials during the training sessions (a) made it possible to monitor the emergence of differences between the real-training condition and the sham-training condition throughout the entire study and (b) reduced the likelihood of respondents determining whether they had been assigned to the real-training condition or the sham-training condition. For the practice trials of the VPT, the same two geometric figures were used as for the practice trials of the AAT (i.e., a square and a circle, presented on a gray background). They were both presented on each practice trial. On exactly four trials, the square was presented at the left of the fixation cross (i.e., twice using the short-cue duration and twice using the long-cue duration). On the remaining practice trials, the square was presented at the right of the fixation cross (i.e., twice using the short-cue duration and twice using the long-cue duration). The location of the probes was statistically independent of the cue presentation time and the location of the cues.
Primary outcome
Drinking behavior and alcohol-related problems since Session M2 were assessed using the AUDIT (Saunders et al., 1993). Given the relatively short interval between Session M2 and the first follow-up session (i.e., 3 months later), only the first three AUDIT questions (i.e., focusing on drinking behavior and not on addiction symptoms) were used for the first follow-up moment (i.e., the AUDIT-C; Bush et al., 1998). For the second and third follow-up moments (i.e., 6 and 12 months after M2), the 10-item AUDIT was administered. Because (a) only the sum scores were recorded in the online tracking platform built for this study and (b) the scale and meaning of the first AUDIT (i.e., a score between 0 and 12) differed from those of the last two AUDITs (i.e., a score between 0 and 40), the data are not suitable for a repeated-measures approach.
Secondary outcomes
Relapse rates
The clinical outcome measure used by Wiers et al. (2011) was the binary classification of treatment outcomes as successful (i.e., abstinence) or unsuccessful (i.e., relapse; see also Eberl et al., 2013; Rinck et al., 2018). Accordingly, although not included in the preregistration, we included this outcome in the present report to maximize comparability with prior research. Relapse was defined as an AUDIT score larger than 0. Similar to Wiers et al., missing values were (conservatively) coded as unsuccessful for these analyses (see also Eberl et al., 2013; Rinck et al., 2018).
Cognitive biases toward alcohol
By definition, both for the AAT and the VPT, the proportion of compatible/incompatible trials was exactly 50% during the measurement sessions (i.e., M1 and M2). During the training sessions, the proportion of incompatible trials was either 50% (i.e., the sham-training condition) or 87.5% (i.e., the real-training condition). It was thus possible to compute cognitive-bias scores for each participant, each measurement session, and each training session. To allow for a direct comparison of the AAT and VPT, for each participant and each session, the AAT and VPT data were transformed into a single, standardized difference score using the D4-scoring algorithm of Greenwald et al. (2003) after exclusion of trials on which participants were unable to respond before the response deadline of 3,000 ms (i.e., AAT: n = 1,343 trials, or 0.54%; VPT: n = 588 trials, or 0.23%). Both the AAT and the VPT were scored in such a way that positive scores were indicative of an approach/attentional bias toward alcohol. Specifically, the mean response latency observed on compatible trials was subtracted from the mean response latency observed on incompatible trials and divided by the pooled standard deviation. In line with the D4-scoring algorithm, independently for compatible and incompatible trials, response latencies of trials in which the (first) response was incorrect (i.e., AAT: n = 5,547 trials, or 2.22%; VPT: n = 8,411 trials, or 3.36%) were replaced by the mean response latency of trials in which the first response was correct plus a 600-ms penalty (for a similar approach in the context of CBM training, see Eberl et al., 2013).
Additional measures
Credibility
One to 4 days before M1, participants’ belief in the efficacy of the CBM interventions was assessed. They were asked to indicate how useful they found the CBM training for their treatment using a 9-point Likert scale with the anchors not useful and very useful. The same measure was administered a second time between 1 and 7 days after completion of M2.
Craving
One to 4 days before M1, participants were asked to rate their current level of craving, again using a 9-point Likert scale (i.e., with the anchors no craving and a lot of craving). The same measure was administered a second time between 1 and 7 days after completion of M2.
Analyses
Chi-square tests were used to examine whether relapse rates were affected by the CBM interventions. Analysis of variance (ANOVA) was used for the analysis of the AUDIT data, the AAT data, and the VPT data. For these analyses, Greenhouse-Geisser approximations (Greenhouse & Geisser, 1959) were applied when necessary to compensate for violations of the sphericity assumption. Finally, a series of (exploratory) regression analyses was performed to examine whether (any) CBM effects were dependent on participants’ (self-reported) craving and/or credibility. To ensure that the follow-up results reported here are not the result of selective attrition, all analyses involving the AUDIT data, the relapse rates, and the craving/credibility ratings were repeated after multiple imputation of missing data using IBM SPSS (Version 28; i.e., 20 imputations). This approach resulted in an almost identical pattern of results. Differences (all minor in nature) are described in notes.
Results
Primary outcome
For each follow-up moment (i.e., 3, 6, or 12 months after session M2), the AUDIT scores were subjected to a 2 (AAT-Training Condition: Real vs. Sham) × 2 (VPT-Training Condition: Real vs. Sham) ANOVA. For the first follow-up moment, the main effect of AAT-training condition was not significant, F(1, 144) = 0.08, p = .78,
Secondary outcomes
Relapse rates
For each of three follow-up moments (i.e., 3, 6, or 12 months after session M2) and each CBM intervention (i.e., attentional-bias training vs. alcohol-avoidance training), a chi-square test was performed to test whether the relapse rate in the real-training condition and the sham-training condition were different from each other. In line with the AUDIT data, relapse rates were found to be unaffected by the attentional-bias training, irrespective of the follow-up moment (see Table 2). The alcohol-avoidance training also had no significant impact on the relapse rates, but numerically, the data of the second and third follow-up moments confirmed the effect observed in the AUDIT data (see Table 2): Relapse rates were about 8% higher, not lower, in the real-training condition compared with the sham-training condition. Recall that in agreement with Wiers et al. (2011), missing values were classified as negative outcomes (i.e., relapse). If we limit the analyses of the relapse rates to participants who were reached during the respective follow-up moments (see Table 3), the adverse impact of the alcohol-avoidance training increased to 13.90% and 22.76%, at the second and third follow-up moments, respectively. At the third follow-up time, this effect was statistically significant. For the attentional-bias training, the inclusion or exclusion of missing values was inconsequential. 6
Relapse Rates as a Function of CBM Intervention, Training Condition, and Follow-Up Moment, Including Missing Values Coded as Relapse in Accordance With Wiers et al. (2011)
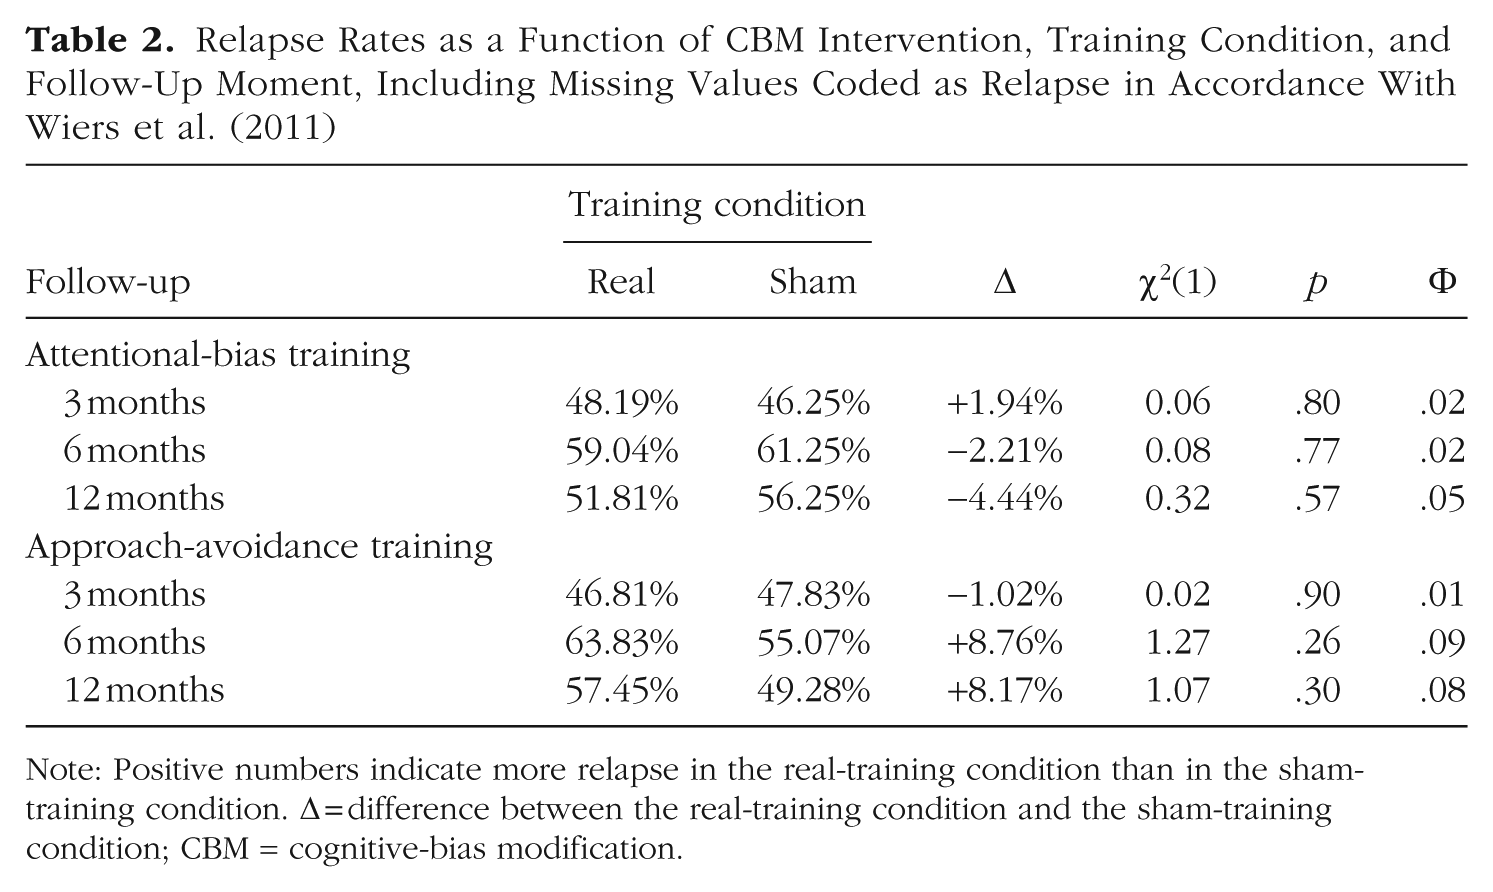
Note: Positive numbers indicate more relapse in the real-training condition than in the sham-training condition. Δ = difference between the real-training condition and the sham-training condition; CBM = cognitive-bias modification.
Relapse Rates as a Function of CBM Intervention, Condition, and Follow-Up Moment, Restricted to Participants Reached for Follow-Up
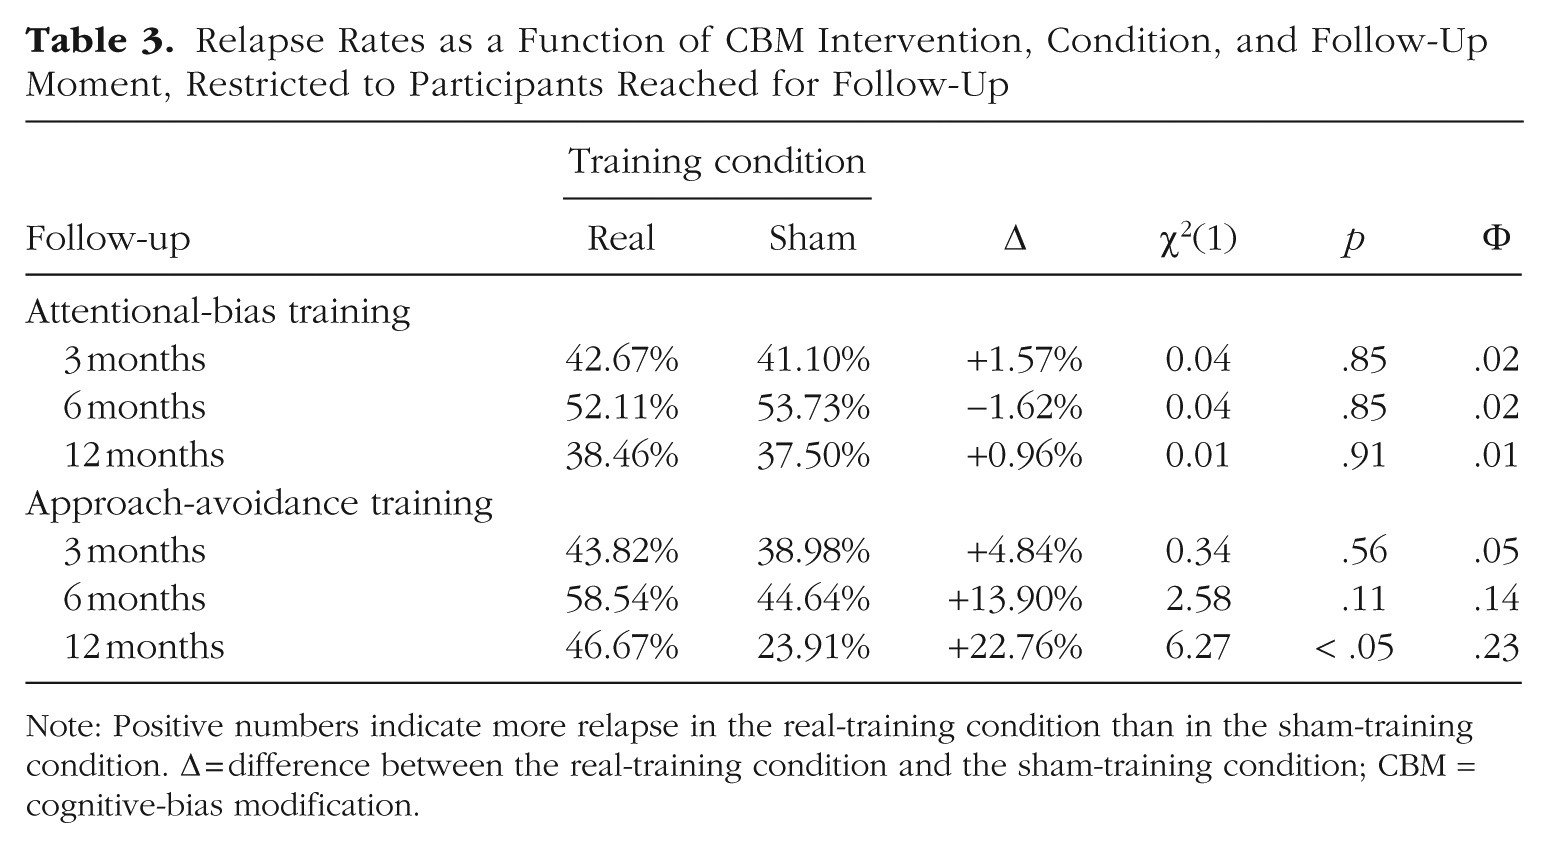
Note: Positive numbers indicate more relapse in the real-training condition than in the sham-training condition. Δ = difference between the real-training condition and the sham-training condition; CBM = cognitive-bias modification.
Approach bias
The AAT scores (for summary statistics, see Table 4) of the eight sessions were subjected to an 8 (Session: M1, T1–T6, and M2) × 2 (AAT-Training Condition: Real vs. Sham) ANOVA. Both the main effect of session, F(6.23, 1,003.21) = 2.18, p < .05,
Attentional-Bias and Approach-Bias Scores (D4) as a Function of Corresponding CBM Intervention and Session (Standard Deviations in Parentheses)
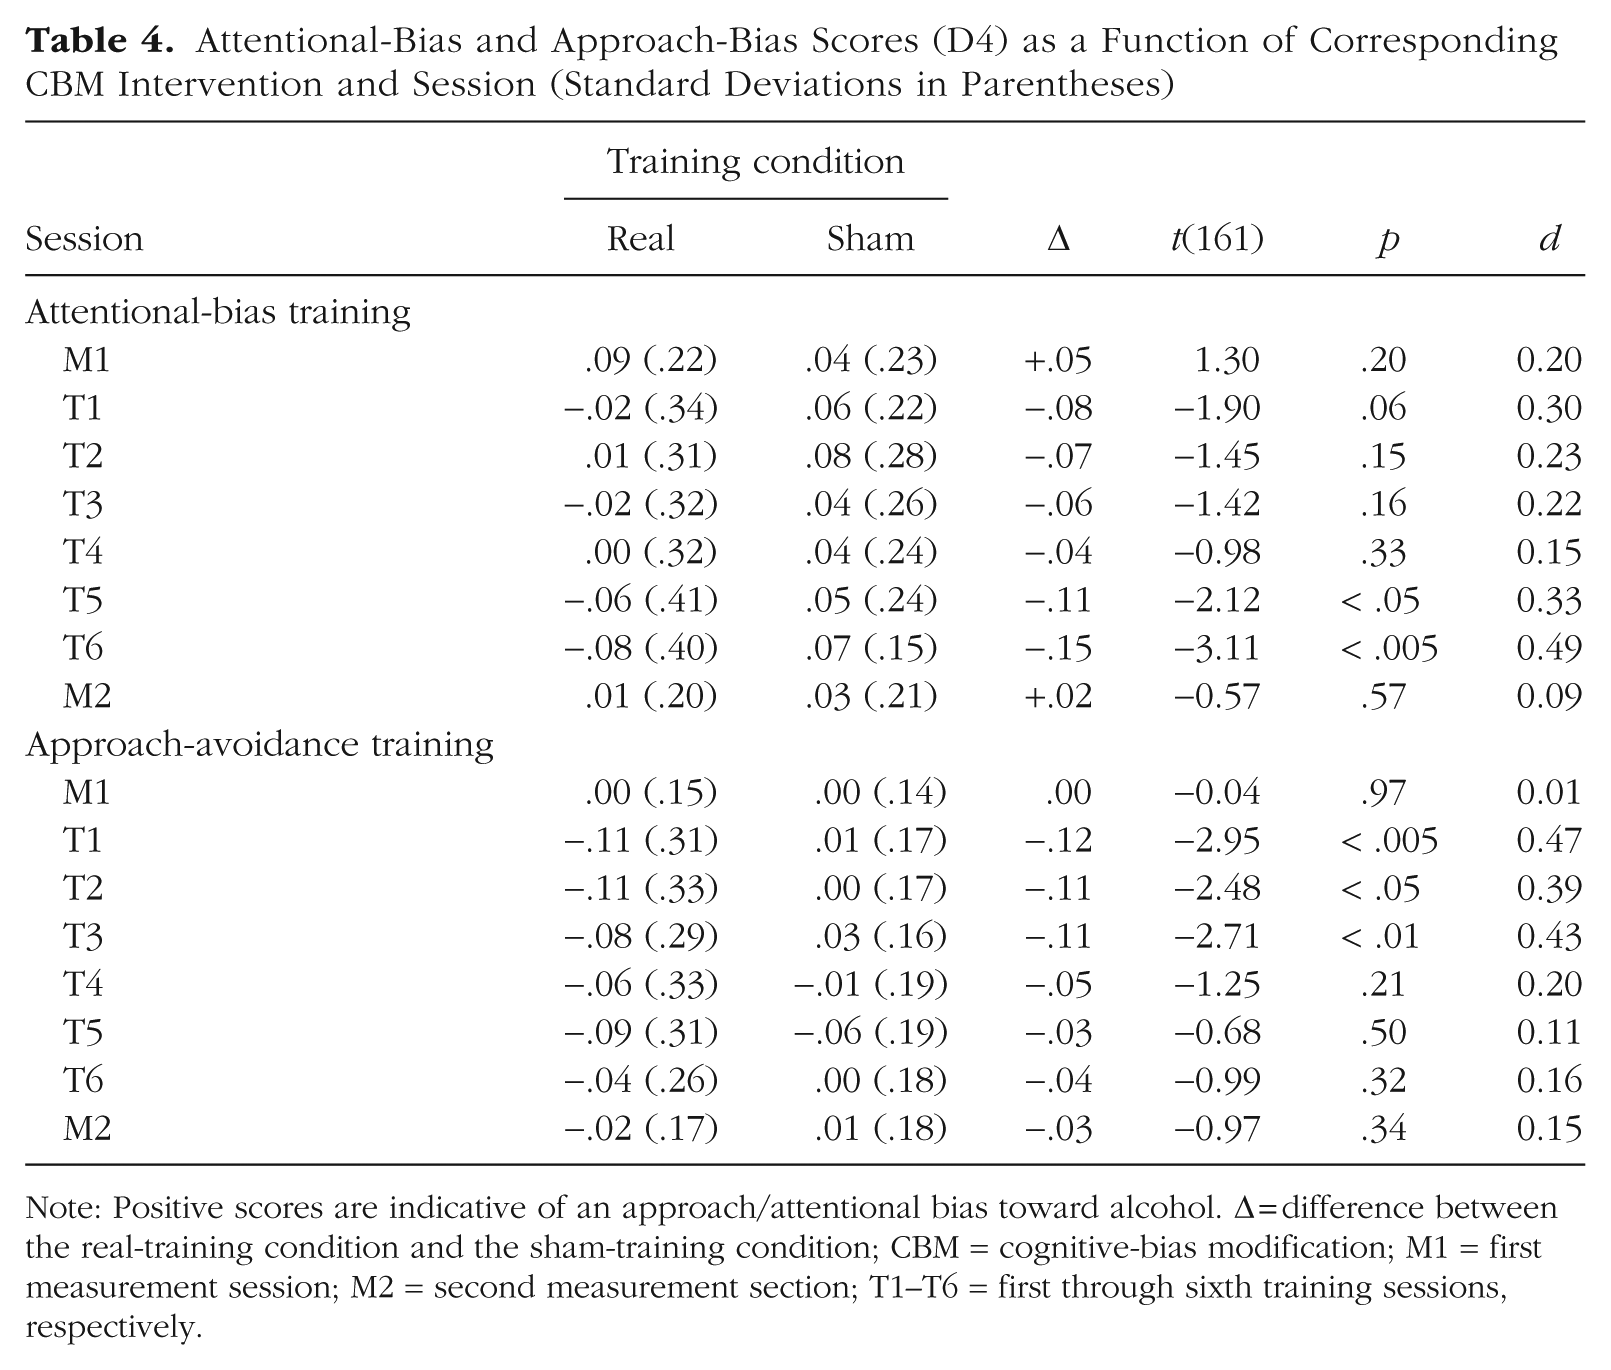
Note: Positive scores are indicative of an approach/attentional bias toward alcohol. Δ = difference between the real-training condition and the sham-training condition; CBM = cognitive-bias modification; M1 = first measurement session; M2 = second measurement section; T1–T6 = first through sixth training sessions, respectively.
Attentional bias
Similar to the AAT scores (for summary statistics, see Table 4), the VPT scores of the eight sessions were subjected to an 8 (Session: M1, T1–T6, and M2) × 2 (VPT-Training Condition: Real vs. Sham) ANOVA. Whereas the main effect of VPT-training condition reached significance, F(1, 161) = 6.56, p < .05,
Exploratory analyses
Credibility ratings
The credibility ratings were subjected to a 2 (Moment: Pretraining vs. Posttraining) × 2 (AAT-Training Condition: Real vs. Sham) × 2 (VPT-Training Condition: Real vs. Sham) ANOVA. The posttraining measurement was missing for one participant, resulting in a total N of 162 instead of 163 for this analysis. Only one effect reached significance, that is, the main effect of moment, F(1, 158) = 29.83, p < .001,
For each of the three follow-up moments, we examined whether the (mean-centered) credibility ratings (i.e., the pretraining credibility ratings, the posttraining credibility ratings, or the difference between these two variables) moderated the impact of the CBM interventions (i.e., alcohol-avoidance training or attentional-bias training) on the AUDIT scores (i.e., 18 regression analyses in total). None of the regression models was significant, all Fs < 2.25, all ps > .08, except for the model in which the AUDIT data of the third follow-up moment (i.e., 12 months after completing the CBM intervention) were regressed on the AAT-training condition, the posttraining credibility ratings, and their interaction, F(3, 116) = 3.60, p < .05, R2 = .09. 8 In this latter model, the interaction between the AAT-training condition and the posttraining credibility ratings reached significance, β = −0.32, t(116) = −2.22, p < .05. Simple-slope analyses (Aiken & West, 1991) suggested that the paradoxical training effect reported above (i.e., higher AUDIT scores in the real-training condition compared with the sham-training condition) was more pronounced for participants who reported a relatively low level of belief in the efficacy of the CBM interventions (i.e., 1 SD below the mean), β = −0.39, t(116) = −3.17, p < .005, compared with participants who reported a relatively high level of belief in the efficacy of the CBM interventions (i.e., 1 SD above the mean), β = −0.01, t(116) = 0.05, p = .96. Given the large number of statistical tests performed, however, this observation should be treated with caution.
Craving ratings
The craving ratings were subjected to a 2 (Session: M1 vs. M2) × 2 (AAT-Training Condition: Real vs. Training) × 2 (VPT-Training Condition: Real vs. Sham) ANOVA. The posttraining measurement was again missing for one participant, resulting in a total N of 162 instead of 163 for this analysis. The main effect of session was significant, F(1, 158) = 20.85, p < .001,
Finally, for each of the three follow-up moments, we examined whether the (mean-centered) craving ratings (i.e., the pretraining craving ratings, the posttraining craving ratings, or the difference between these two variables) moderated the impact of the CBM interventions (i.e., alcohol-avoidance training or attentional-bias training) on the AUDIT scores (i.e., 18 regression analyses in total). None of the regression models was significant, all Fs < 2.55, all ps > .05. 9
Discussion
In line with dual-process theories of addiction (see Stacy & Wiers, 2010; Wiers et al., 2013), five large clinical trials demonstrated that alcohol-avoidance training can help reduce relapse rates in alcohol-dependent patients (Eberl et al., 2013; Manning et al., 2022; Rinck et al., 2018; Salemink et al., 2022; Wiers et al., 2011). The magnitude of this effect is relatively modest, however, with an average risk reduction of 7.1% (corresponding to an NNT of 14). To improve the clinical utility of this intervention, we decided to examine the effect of combining alcohol-avoidance training with an intervention aimed at reducing the attentional bias toward alcohol-related stimuli. This approach was chosen because addiction is believed to be caused by not only automatic approach-avoidance tendencies but also the automatic tendency to allocate attention to substance-related stimuli (e.g., Field & Cox, 2008; Stacy & Wiers, 2010; Wiers et al., 2013). However, using a 2 (Sham vs. Real Alcohol-Avoidance Training) × 2 (Sham vs. Real Attentional-Bias Training) factorial design, we failed to observe any indication of alcohol-avoidance training or attentional-bias training having a beneficial impact on clinical outcomes in alcohol addiction. If anything, the data of the third follow-up moment (i.e., 12 months after completing the CBM interventions) even suggested a potential negative effect of alcohol-avoidance training: Relapse rates were higher (not lower) in the real-training condition compared with the sham-training condition. Likewise, it was observed that the AUDIT scores were higher, not lower, in the real-training condition of the alcohol-avoidance training compared with the sham-training condition.
We note, however, that this reversed training effect was more pronounced when restricting the analysis to participants who were actually reached for follow-up assessments (cf. Table 3) compared with an analysis (similar to Eberl et al., 2013; Rinck et al., 2018; Wiers et al., 2011) in which missing values were coded as relapse (cf. Table 2). It also failed to replicate when analyzing the imputed AUDIT data (see Note 5). In sum, this effect is weak in the sense that it depends on the exact analytical approach taken. It is therefore advisable not to overinterpret this finding. On the other hand, it does coincide with findings previously reported by Boffo et al. (2019). In their meta-analysis, it was observed (a) that relapse rates tended to decrease as the number of completed CBM trials increased but (b) that this effect was more pronounced in participants assigned to a sham-training condition compared with participants assigned to a real-training condition. To account for their (surprising) findings, Boffo et al. hypothesized that participants assigned to a sham-training condition learn to ignore the contents of the stimuli presented because there is (by definition) no overlap between the task-relevant stimulus dimension (e.g., the rotation of the images in the AAT) and the task-irrelevant stimulus dimension (i.e., the distinction between alcohol-related and alcohol-unrelated stimuli). In contrast, in the experimental CBM conditions, the distinction between alcohol-related and alcohol-unrelated stimuli is (by definition) predictive of the required response, which may lead participants to focus their attention on the distinction between alcohol-related and alcohol-unrelated stimuli either intentionally or unintentionally (see Spruyt et al., 2009, 2018; Spruyt & Van Bockstaele, 2016). It could thus be argued that patients assigned to an experimental CBM intervention are trained to prioritize pathology-related stimulus information, which may be harmful in the long run. 10 Given the speculative nature of this interpretation, it should be treated with caution. Nevertheless, we believe that future studies could benefit from a more detailed analysis of (a) the various response strategies that patients might adopt during alcohol-avoidance training and (b) how individual differences in these response strategies relate to therapeutic outcomes.
Not only did we fail to replicate the key observation that CBM training improves clinical outcomes, but we also found no evidence for the idea that CBM training produces meaningful changes in the cognitive biases believed to underlie addiction. During the last measurement session (i.e., M2), for neither the alcohol-avoidance training nor the attentional-bias training, significant differences were found between the real-training condition and the sham-training condition. In line with Claus et al. (2019), we included a small number of compatible trials (i.e., 12.5%) in the training conditions, allowing us to monitor the emergence of potential training effects throughout the six training sessions (i.e., T1–T6). For the attentional-bias training, significant (or nearly significant) training effects (in the expected direction) were found for T1, T5, and T6. For the alcohol-avoidance training, significant training effects emerged for T1 through T3. Crucially, the stimulus sets used for the measurement sessions (i.e., M1 and M2) were always unique for a given participant. So despite the fact that the cognitive biases under examination tended to shift in the expected direction during the training sessions themselves, these effects did not generalize to novel stimuli during the measurement session, an observation that is in line with several earlier studies (for an overview, see Wiers et al., 2018). One might therefore argue that it is not surprising that we failed to pick up CBM-treatment effects in the relapse data simply because the hypothesized underlying mechanisms were insufficiently targeted by the CBM interventions as implemented in our study. We note, however, that previous RCTs have provided only minimal evidence for the existence of a direct relationship between clinical outcomes and CBM-induced changes in the targeted cognitive mechanisms. Out of the five previously published RCTs (i.e., Eberl et al., 2013; Manning et al., 2022; Rinck et al., 2018; Salemink et al., 2022; Wiers et al., 2011), (a) only three engaged in a formal analysis of the hypothesis that the risk reduction resulting from CBM treatment is mediated by changes in cognitive biases targeted by those interventions (i.e., Eberl et al., 2013; Rinck et al., 2018; Wiers et al., 2011), and (b) mediation was found in only one of those studies (Eberl et al., 2013). Moreover, Schenkel et al. (2024) recently reported that they were unable to find any relationship between relapse at 1-year follow-up and various learning parameters obtained during six sessions of AAT training despite ample statistical power (N = 543). Given this state of affairs, we concur with Manning et al. (2021), who openly questioned “whether change in approach bias is actually the mechanism by which CBM leads to abstinence” (p. 138).
Our findings are of major importance for the ongoing debate regarding the efficacy of CBM in the treatment of (alcohol) addiction (see Cristea et al., 2016; Wiers et al., 2018). The fact that CBM interventions sometimes fail to produce the desired results (e.g., Claus et al., 2019; Clerkin et al., 2016; Lindgren et al., 2015; Schoenmakers et al., 2007) was attributed by Wiers et al. (2018) to the difference between experimental-laboratory studies and RCTs in clinical samples. Among other things, it was argued (a) that substance-dependent patients are more motivated to change their behavior than healthy participants, (b) that the training regimen in clinical studies is typically more intense than in experimental-laboratory studies, and (c) that the follow-up period is usually much longer in clinical trials than in experimental-lab studies. Accordingly, Wiers et al. concluded that “large trials testing the clinical effectiveness of CBM in addiction are needed” (p. 341). Similar to other recent RCTs (i.e., Manning et al., 2021, 2022; Rinck et al., 2018; Salemink et al., 2022), the current study meets the requirements set by Wiers et al. in the sense that a sample of alcohol-dependent inpatients was exposed to six consecutive sessions of CBM training and treatment effects were closely monitored over a 1-year follow-up period. It thus seems unlikely that the distinction between experimental-laboratory studies and RCTs in clinical samples is the primary factor determining whether CBM produces meaningful treatment effects, although such a conclusion rests on the assumption that no other factors can account for the absence of (benign) treatment effects in the present study. In fact, several limitations should be acknowledged to ensure a balanced interpretation of our findings.
Limitations
First, the sample size of the current study can be debated. In total, 247 patients participated in the study, of which, 163 patients were retained for per-protocol analyses. Although these numbers are roughly in the same order of magnitude as the sample size of the original study reported by Wiers et al. (2011; N = 214), they are clearly much smaller than the sample sizes of other clinical trials (i.e., up to 1,405 participants in the study reported by Rinck et al., 2018). We note, however, that the preregistered sample size of the present study was based on a formal power analysis (using GPOWER; see Erdfelder et al., 1996) showing that a sample of 250 participants was sufficient to pick up a 13.1% risk reduction (i.e., the effect reported by Wiers et al., 2011, Cohen’s
Second, regarding the alcohol-avoidance training, we note that participants were expected to press the down-arrow key (described as “pulling a drink toward oneself”) or up-arrow key (described as “pushing a drink away from oneself”) in response to the rotation of the presented stimuli. To maximize the chance of respondents coding these responses as actual approach-avoidance responses, a zoom effect was implemented (see Wiers et al., 2011). Specifically, holding down the down-arrow key resulted in a gradual increase in size of the presented stimulus, and holding down the up-arrow key resulted in a gradual decrease in size of the presented stimulus. In all other clinical studies, however, joystick responses instead of keyboard responses were used. Although keyboard responses have been successfully used in several studies aimed at capturing automatic approach-avoidance effects (e.g., Krieglmeyer et al., 2010; Spruyt et al., 2013), it could be argued that joystick responses are more adequate for training purposes, possibly because they are more effective at triggering sensorimotor associations (Eder et al., 2021; Rougier et al., 2018; but see Markman & Brendl, 2005; see also Kahveci et al., 2020).
Third, the training contingencies used in the experimental groups were below 100% (i.e., 87.5% in the current study). We deliberately chose this approach to be able to monitor the effects of the CBM interventions as they develop during the different training sessions (see above). In retrospect, however, this may be considered a significant departure from the original procedure reported by Wiers et al. (2011). In their study (and that reported by Rinck et al., 2018), the measurement of the approach-avoidance bias was limited to two separate assessment sessions, one before and one following the actual intervention (i.e., comparable with Sessions M1 and M2 in the present study). Whereas a 50% contingency was used for these assessment sessions, all alcohol-related pictures had to be pushed away during the training sessions (i.e., a 100% training contingency). A slightly different approach was taken by Eberl et al. (2013). In their study, each training session started with a short assessment phase in which a 50% contingency was used, immediately followed by a training phase in which a 100% training contingency was used. Salemink et al. (2022) also used a 100% training contingency and did not include a measurement phase at all (neither before or following the alcohol-avoidance training as a whole nor before individual training sessions). In sum, all studies that yielded significant training effects at 1-year follow-up used a 100% training contingency. The only other RCT (besides ours) in which no significant risk reduction was found at 1-year follow-up is that of Manning et al. (2022), who used a 95% training contingency (but see Note 1; there was an effect on the primary outcome). Taken together, these data appear to indicate that there is a relationship between the training contingencies used and the likelihood of relapse across the 1-year follow-up period. Whereas all studies showing successful training effects after 1 year used a 100% training contingency, (a) only a (nonsignificant) risk reduction of 4.0% was found when a 95% training contingency was used (Manning et al., 2022), and (b) even a reversed training effect emerged (i.e., +8.17% or +22.76%, depending on the analytical approach taken; see Tables 2 and 3) when the training contingency was further reduced to 87.5% (i.e., this study). It therefore seems appropriate to further investigate this variable as a potential moderator of CBM-training effects. 11
Fourth, as in all preceding clinical trials (i.e., Eberl et al., 2013; Manning et al., 2022; Rinck et al., 2018; Salemink et al., 2022; Wiers et al., 2011), relapse was assessed through self-report measures without supplementary validation. Although self-reports are sometimes criticized for their susceptibility to social-desirability biases and recall inaccuracies, research has demonstrated that they offer a reliable and valid approach for assessing alcohol consumption (Del Boca & Darkes, 2003). In fact, some researchers have even argued that biochemical tests and informant reports do not sufficiently enhance self-report accuracy to justify their routine use (Babor et al., 2000). Nonetheless, future studies aiming to maximize methodological rigor may benefit from integrating additional objective indicators to corroborate self-report measures of relapse.
Finally, it may be noted that measures of income, education, socioeconomic status, racial/ethnic identification, and/or cultural/geographic background were not collected. As a result, it was not possible to examine any potential moderation effects related to these factors. However, EU regulations (Regulation 2016/679) prohibit collecting personal data not directly relevant to research purposes. Because we had no a priori hypotheses about these variables, they were also not measured.
Summary and conclusion
We conducted a double-blind, multisite RCT to evaluate the combined effects of alcohol-avoidance training and an intervention targeting attentional bias toward alcohol-related stimuli. Results indicated that these interventions did not lead to a reduction in relapse rates or alcohol-related problems or have a measurable impact on cognitive-bias indices. These findings resonate with earlier work by Boffo et al. (2019), who concluded, based on a Bayesian meta-analysis of individual participant data from studies investigating CBM effects, that “clinical research in this field is still in its infancy and, as yet, has not provided enough evidence to give a reliable response regarding the effectiveness of this class of intervention[s]” (p. 75; for a similar conclusion, based primarily on proof-of-principle studies, see Cristea et al., 2016). Additional research is thus needed to further establish the clinical utility of CBM interventions, ideally incorporating novel suggestions by Wiers et al. (2020) to improve the efficacy of CBM training. Based on an automatic-inference account of addictive behaviors (Van Dessel et al., 2016, 2018, 2019), they proposed training patients to make behavioral choices (B) that maximize health-related consequences (C) in the context of personally relevant antecedents (A). According to this account, CBM-training effects do not depend on changes in automatic associations (in line with the dual-process models) but on automatic inferences about the effects of consuming alcohol. Because the clinical utility of such an approach is yet to be demonstrated, it seems worthwhile to engage in a direct comparison of “standard” CBM interventions (as implemented in the current study) and this so-called ABC training in clinical samples (for a first proof-of-principle study, see Van Dessel et al., 2023).
Footnotes
Transparency
Action Editor: Tamika C. Zapolski
Editor: Jennifer L. Tackett
Author Contributions