
Abstract
The network theory of psychopathology is gaining popularity as a conceptualization of psychological disorders that may aid the identification of mechanisms of therapeutic change. However, many existing networks do not consider other relevant variables beyond the symptoms themselves. We present a large-scale (n = 1,873), longitudinal Bayesian network analysis of panic disorder using the symptom items from the Panic Disorder Severity Scale (PDSS) and two respiratory biomarkers (respiration rate and end-tidal CO2) collected during routine monitoring of a capnometry-guided respiratory intervention (CGRI). Our findings offer support for avoidance and fear of panic as drivers of subsequent panic-disorder symptoms over the 4-week course of treatment. Moreover, respiration rate but not end-tidal CO2 was associated with downstream PDSS symptoms. These findings provide further evidence supporting the role of respiratory biomarkers in the maintenance of panic disorder and some support for normalization of dysfunctional breathing as one therapeutic mechanism governing CGRI.
A dominant paradigm in the field of clinical psychology has been to conceptualize psychological disorders as adhering to a latent-variable or “disease” model. Under such models, observable psychopathology symptoms can be explained by the presence of a latent, underlying disorder (Borsboom & Cramer, 2013). Not only does this approach involve a certain degree of circular logic (panic disorder [PD] explains the presence of panic-related avoidance but can be diagnosed only by the presence of panic-related avoidance), it also ignores the possibility that causal relationships may exist among the symptoms themselves (Borsboom & Cramer, 2013). For example, anticipatory anxiety may drive panic-related avoidance without the need to invoke the presence of some latent variable. Ignoring causal relationships among symptoms limits the ability to identify which symptoms may operate as mechanisms of change. Identifying mechanisms of change, in turn, is central to the development of more reliable, efficient, and effective psychotherapeutic treatments (Kazdin, 2009).
In contrast, network theories of psychopathology assert that symptoms of psychological disorders cohere partly because causal relationships exist between the symptoms themselves (Borsboom, 2017). Thus, disorders are represented not as latent constructs but as networks of individual symptom “nodes” and the relationships (or “edges”) between them (Borsboom & Cramer, 2013). Importantly for change-mechanism research, network analyses may identify key symptom targets for achieving symptom reduction (e.g., Forrest et al., 2023; Papini et al., 2020; Robinaugh et al., 2016; but see also C. T. Lee et al., 2023). One challenge of constructing networks is that the mere presence or absence of an edge between two nodes gives little indication of the relative confidence in whether the conditional probability is meaningfully different from zero (Williams et al., 2021). Fortunately, the use of Bayesian methods offers a solution to this problem by reflecting the strength of the evidence in favor of inclusion in the network without resorting to null hypothesis significance testing (Borsboom et al., 2021).
Increasingly, researchers have gravitated toward working with longitudinal data sets (for excellent examples of this work, see Chen et al., 2024; Kuipers et al., 2019; Moffa et al., 2023). Constructing such networks allows for the observation of feedback loops and establishes the temporal precedence of relationships between symptoms—a critical prerequisite for making causal claims. Moreover, researchers have recommended increasing attention on “external factors,” variables that may affect the network but have not traditionally been conceptualized as symptoms themselves (Hoffart & Johnson, 2020). Their inclusion can offer confirming or disconfirming evidence for clinical theory (e.g., the role of metacognitive beliefs in PD; Hoffart & Johnson, 2020) and can also broaden the search for effective therapeutic intervention targets.
As researchers continue the work of extending the network theory of psychological disorders, PD—an anxiety disorder typically characterized by frequent, distressing panic attacks; anxiety about future panic attacks; panic-related avoidance of places, situations, activities, or physical sensations; and functional or social impairment—serves as an ideal example for several reasons noted by Robinaugh and colleagues (2019). First, panic attacks are a well-established phenomenon with extensive research published on their epidemiology (Kessler et al., 2006) and treatment (Barlow et al., 2000; Telch et al., 1993, 1995). Second, in a network analysis of more than 100 symptoms of common disorders defined by the fifth edition of the Diagnostic Statistical Manual of Mental Disorders (DSM-5; American Psychiatric Association, 2013), PD emerged as one of only five disorders in which each symptom displayed a conditionally dependent relationship with all other symptoms in the network (Boschloo et al., 2015). Third, existing theories on PD propose both unidirectional causal relationships, such as panic causing avoidance (Goldstein & Chambless, 1978), and mutual causal relationships between symptoms (e.g., interoceptive fear and panic attacks; Clark, 1986). The substantial body of prior literature exists to form specific hypotheses about the structure of the PD-symptom network (Robinaugh et al., 2019), which can subsequently be evaluated using longitudinal data.
In recent decades, two theoretical models have emerged as dominant in the literature on PD. The cognitive model of PD, as proposed by Clark (1986), suggests that individuals with PD misperceive harmless bodily sensations as threatening, leading to panic in the presence of distressing bodily sensations. Various explanations have been put forth to account for this cognitive disposition, including catastrophic misinterpretation (Beck, 1985; Clark, 1986), interoceptive conditioning (Goldstein & Chambless, 1978), anxiety sensitivity (McNally, 1990), and context-sensitivity theory (Telch et al., 2010, 2011). However, the central premise of faulty threat appraisal is strongly supported in the literature, and substantial evidence links PD to the tendency to perceive anxiety as harmful (Chambless et al., 1984; McNally, 2002; McNally & Lorenz, 1987; Telch et al., 2003). Moreover, elevated levels of anxiety sensitivity and heightened emotional responding to CO2-enriched air typically return to normal levels following cognitive-behavioral treatment for PD (Gorman et al., 2004; Smits et al., 2004), suggesting that reductions in the fear of panic and anxiety may operate as an important mechanism of PD recovery (Cho et al., 2007).
Neurobiological models of PD have also been put forward. Over the past 4 decades, substantial theoretical and empirical efforts have identified a potential connection between hyperventilation and PD (Antony et al., 1997; Ley, 1985; Papp et al., 1993; Schmidt & Telch, 1994; Telch et al., 2003). To explain this association, Klein (1993) introduced the suffocation-alarm theory of panic, suggesting that individuals with PD have a hypersensitive suffocation monitor that triggers false suffocation alarms (spontaneous panic) in response to elevated end-tidal carbon dioxide (etCO2). The theory also proposes that individuals with PD engage in chronic compensatory hyperventilation by quickening their respiration rate (RR) and/or increasing the amount of oxygen they take in with each breath to maintain a buffer between their resting etCO2 rates and the suffocation-alarm threshold (Klein, 1993). This specific element of Klein’s theory was tested by Schmidt and colleagues (1996). Individuals with PD underwent two respiratory challenges: a 35% CO2 challenge and a 2-min voluntary hyperventilation challenge. During each challenge, subjective and physiological indices recommended by Klein for testing the suffocation monitor were obtained. These included frequency and severity of dyspnea symptoms, heightened RR, and lowered partial CO2 levels. Contrary to prediction, none of the suffocation-monitor variables predicted differential emotional responding to the hyperventilation versus 35% CO2 challenge.
More recently, Feinstein and colleagues (2022) proposed a respiratory-based theory of panic known as apnea-induced anxiety. This theory suggests that recurrent episodes of apnea, triggered unconsciously by amygdala activation, lead to transient spikes in CO2 levels, provoking panic, anxiety, and the characteristic escape and avoidance behaviors observed in clinical anxiety disorders.
Others have challenged suffocation theories of panic, arguing that although heightened emotional reactivity to respiratory-related provocations, such as CO2 inhalation (Harrington et al., 1996), hyperventilation (Holloway & McNally, 1987; Ley, 1985; Telch et al., 2003), and straw breathing (Deacon et al., 2013), can provoke panic, other provocation agents unrelated to respiration (i.e., yohimbine, Vasa et al., 2009; cannabis, Dannon et al., 2004; Zvolensky et al., 2008; caffeine, Klevebrant & Frick, 2022; Telch et al., 1996) have also been shown to provoke panic. These findings align more closely with appraisal theory, which posits that any provocation capable of generating a physical or mental reaction that is misinterpreted as threatening will lead to panic (Clark, 1986; Margraf et al., 1986; Zucker et al., 1989). Moreover, experimental studies that manipulate contextual variables during panic provocation, such as instructional set (Telch et al., 2011) or the presence or absence of a safety signal (Telch et al., 2010), have demonstrated a powerful influence on whether panic occurs.
Mounting evidence suggesting a link between hyperventilation and panic attacks spurred the development of a brief 4-week breathing-retraining treatment (BRT) focusing on providing subjects capnometry-assisted feedback to help reduce their RR to raise their etCO2 to normal levels (Meuret et al., 2008). Preliminary results testing the BRT intervention versus waitlist were promising. Approximately 70% showed significant improvement (which Meuret and colleagues, 2008, defined as a significantly negative slope of panic-symptom change over time). A 4-week home-based version of the intervention that added health coaching and was renamed “capnometry-guided respiratory intervention” (CGRI) was tested in a small open-label trial (Tolin et al., 2017) and a large (n = 1,395) effectiveness trial (Cuyler et al., 2022); each showed marked reductions in PD symptoms. These promising treatment findings further support a possible causal link between PD and respiratory biomarkers of RR and etCO2.
Although the normalization of RR and etCO2 has been hypothesized as a mechanism of action for CGRI, supportive evidence has been inconclusive. Meuret, Rosenfield, and colleagues (2010) examined distinct and common therapeutic mechanisms for the capnometry-assisted respiratory treatment (CART) and the “gold standard” panic treatment: cognitive therapy (CT). Consistent with prediction, changes in etCO2 mediated the improvement among individuals receiving CART, whereas threat appraisal mediated improvement for patients receiving CT. Perceived control was a significant nonspecific mediator for both treatments. Davies and colleagues (2019) also found that subjects’ change in etCO2 was a significant mediator of treatment outcome but only for subjects displaying abnormally low etCO2, whereas subjects’ level of perceived control mediated treatment outcome regardless of etCO2 levels. This latter finding is consistent with a recent effectiveness study that showed CGRI was effective in reducing panic symptoms even for individuals with normal resting levels of etCO2 (Cuyler et al., 2022). These data suggest that respiratory interventions, such as CGRI, may exert therapeutic effects via multiple therapeutic pathways; however, additional studies are needed.
A longitudinal network analysis of PD that includes RR and etCO2 may help clarify the change mechanisms in CGRI treatment of panic but may also help clarify the relative influence of these two respiratory biomarkers to the overall network of PD symptoms. To our knowledge, three prior PD symptom networks exist in the literature. Cha and colleagues (2022) reported on a cross-sectional symptom-network analysis of 257 psychiatric outpatients meeting DSM-5 (American Psychiatric Association, 2013) criteria for PD. Their findings showed that panic-related avoidance of situations, social impairment, and fear of cognitive dyscontrol—rather than panic-attack frequency—were most central to the network structure and that panic-related avoidance and panic-related anxiety had the highest degree of closeness to other symptoms. Kim and colleagues conducted cross-sectional symptom network comparisons from before COVID and peri-COVID (Kim, Bang, et al., 2023; N = 246) and between men and women (Kim, Lee, & Pae, 2023; N = 619) using psychiatric outpatient data. They found social impairment to be the most influential PDSS symptom in all except the peri-COVID network, in which situational avoidance had highest influence. Both sets of authors emphasized the need for longitudinal studies to investigate the direction of the relationships observed between symptoms.
Here, we report findings from a longitudinal Bayesian network analysis of PD symptoms, as measured by the Panic Disorder Severity Scale (PDSS), from a large sample of individuals participating in an effectiveness study of CGRI. In keeping with assumptions of network theory of psychological disorders, we expected our network to have a nontrivial topology in which some PDSS symptoms were more closely related than others and to include one or more feedback loops capable of maintaining the presence of PD in the absence of influential external factors. Based on cognitive models of panic (Clark, 1986), we predicted a mutual, positive association between fear of panic and avoidance and also predicted that these symptoms would be central to the network structure. On the basis of prior mediational studies showing that normalization of respiratory biomarkers during CGRI treatment predicts improvement in PD symptoms (Davies et al., 2019; Meuret, Rosenfield, et al., 2010), we also expected that RR and etCO2 would each predict downstream PDSS symptoms and that participants’ success in meeting target RR and etCO2 during treatment would show a mutual, positive relationship with resting RR and a mutual, negative relationship with resting etCO2 in subsequent weeks. Moreover, on the basis of the cross-sectional network findings of Cha and colleagues (2022), we predicted that functional impairment, avoidance, and fear of panic would be more central to the PD network structure than panic-attack frequency.
On the basis of previous work suggesting that CGRI exerts its therapeutic effects by correcting patients’ dysregulated breathing patterns, we examined differences in the symptom network as a function of participants’ hypocapnic status in the first week of the intervention. We predicted that respiratory biomarkers would be more important to the overall network structure for participants displaying such dysregulated breathing. We also evaluated the stability of the panic-symptom network as a function of participants’ gender identity. Given the lack of current evidence for differences in the structure of PD across gender, we did not expect salient differences in the network based on this demographic.
Transparency and Openness
Preregistration
This study was not preregistered.
Data, materials, code, and online resources
The data used for these analyses are the property of Freespira, Inc., and thus are not publicly available; requests for the data should be made to the corresponding author. All analyses were conducted using R statistical software (Version 4.2.3) on a 2021 MacBook Pro running an Apple M1 Pro chip on MacOS Sonoma (Version 14.3). The code used for all analyses is publicly available at doi.org/10.17605/OSF.IO/6PEJB.
Reporting
We report how we determined our sample size, all data exclusions, all manipulations, and all measures in the study.
Ethical approval
Institutional Review Borad-exempt status was granted for this analysis of de-identified data by the Institutional Review Board, University of Texas at Austin (ID: STUDY00003542).
Method
Participants
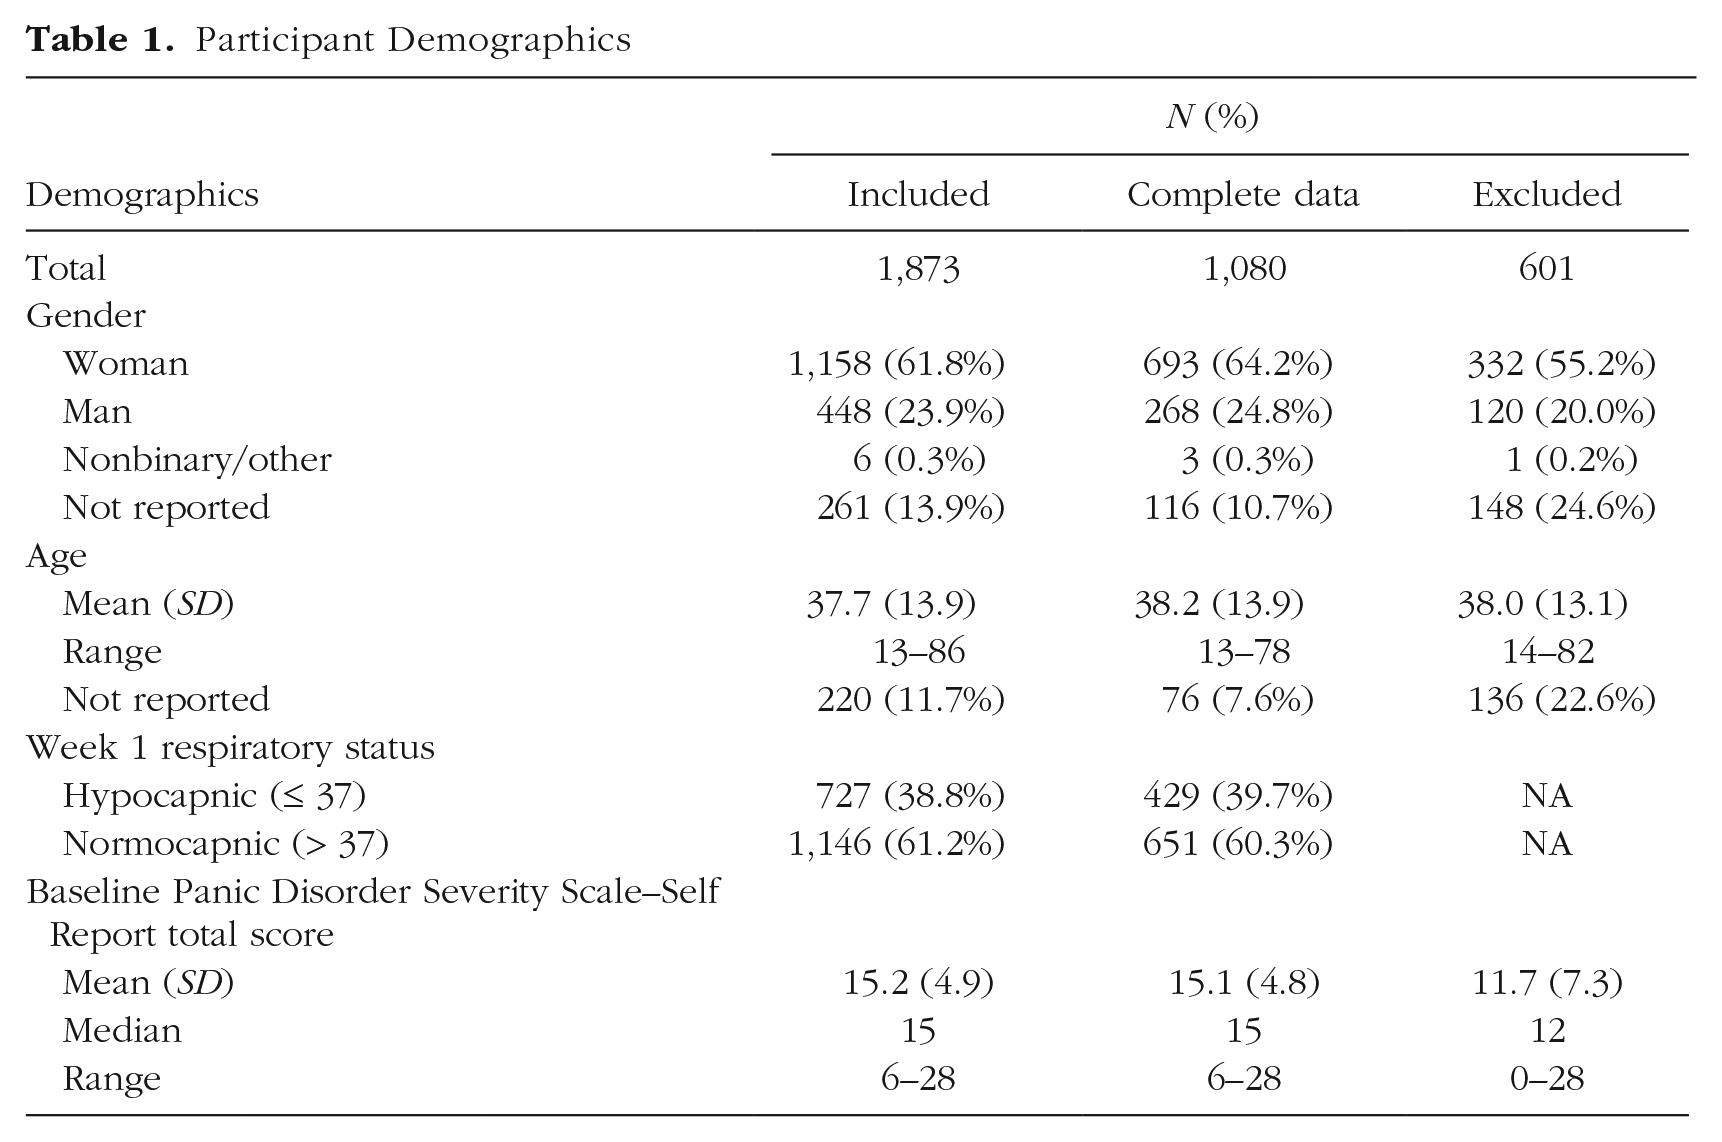
Our sample consisted of individuals with PD (n = 1,873) whose data were collected as part of standard-operating-procedure data capture during routine clinical treatment: a CGRI for PD (Cuyler et al., 2022). Participation in this intervention was limited to individuals ages 13 or older. Individuals with a history of chronic obstructive pulmonary disease or other advanced respiratory illness, who were pregnant, and had inadequately controlled seizures or asthma, schizophrenia, active psychosis, or active suicidal ideation were excluded. Participants included insured and self-pay participants who did not receive compensation for their participation. Of the 2,474 participants on whom baseline data were collected, we excluded 460 who did not participate in the intervention and whose data could therefore not be imputed. We further excluded 141 participants who did not meet the cutoff score of 6 or greater on the PDSS suggested by Furukawa and colleagues (2009). This resulted in a final sample of 1,873. We also constructed a longitudinal network for the 1,080 participants for whom complete data were present. Participant demographics are reported in Table 1.
Participant Demographics
Intervention
CGRI trains participants to normalize their breathing style to match a specific RR and etCO2 benchmark via a system that provides patients real-time feedback on their RR and etCO2 along with coaching in using the respiratory feedback system. Following an initial 45-min introductory session with their health coach, participants are recommended to complete training sessions twice daily for 28 days and attend weekly 10- to 15-min video sessions with their health coach to review the prior week’s training and receive suggestions to aid their continued progress. Each 17-min training session consists of (a) 2 min of baseline respiratory measurement in which participants are instructed to breathe normally with their eyes closed (typically referred to as the “baseline stage” but referenced here as the “resting stage” to avoid confusion with “baseline” PDSS data collected before the start of the intervention), (b) 10 min of respiratory pacing in which participants are instructed to breathe in sync with a rising and falling audio tone and adjust their respiratory volume to match their etCO2 target (pacing stage), and (c) 5 min of transition in which the tones are removed and participants are instructed to maintain their respiratory pacing and volume (transition stage). Target RR is decreased weekly via the audio tone from 13 breaths per minute in Week 1 to 11 breaths per minute in Week 2, nine breaths per minute in Week 3, and six breaths per minute in Week 4. For further details of the intervention, see Cuyler et al. (2022).
Measures
Panic Disorder Severity Scale–Self Report form
The Panic Disorder Severity Scale–Self Report (PDSS-SR) form (Houck et al., 2002) is a seven-item, self-report measure of PD severity rated on a 5-point Likert scale ranging from 0 (no PD symptoms) to 4 (extreme PD symptoms). The PDSS-SR was administered to participants at the end of each week of treatment (e.g., the PDSS-SR for Week 1 was administered between the seventh and eighth CGRI sessions), and participants were asked to think about their symptoms over the previous 7 days. The internal consistency in our sample was high (α = .93).
Respiratory biomarkers
RR and etCO2 were collected throughout each 17-min CGRI training session. RR is a measure of the number of breaths an individual takes per minute, and etCO2 is a measure of the CO2 released with each breath. RR and etCO2 averages were calculated for the resting stage as a proxy for an individual’s “natural” or “resting” breathing patterns (“respiratory health”), and variances from the respiration targets were calculated for the transition stage as a proxy for an individual’s ability to meet treatment targets in the absence of the pacing tone (“treatment success”). Weekly averages for each statistic were used for the analyses to keep the overall number of time points consistent across respiratory-biomarker and panic-symptom data. Averages from the resting stage of the first week of treatment were used to classify participants as normocapnic (normative etCO2 levels: etCO2 > 37) or hypocapnic (meaningfully low etCO2 levels: etCO2 ≤ 37).
Data analysis
Estimates from the Bayesian network analyses were represented in directed acyclic graphs (DAGs). A DAG is a network structure in which each node corresponds to a random variable; conditional independence relationships between them are represented as edges. These relationships are determined by estimating the conditional dependence among variables, estimating the prior probability distribution, and combining these two estimates to construct the posterior probability distribution. Thus, each edge in the network should be interpreted as the relationship between two nodes after accounting for every other node in the network. The edges between nodes are directional, meaning that the network estimates relationships from a “parent” node to a “child” node. The network is considered “acyclic” because the edges represent unidirectional relationships. Creating a DAG involves initially learning only the network structure of the data and then learning the parameters of the network given the network structure (Castelletti, 2020). A dynamic (longitudinal) DAG extends conventional DAGs by incorporating temporal relationships between variables into the network by modifying the existing network structure to account for process dynamics, thus making it an ideal choice for estimating networks with longitudinal data (Mihajlovic & Petkovic, 2001).
In keeping with the recommendations of Scutari and colleagues (2019), we employed a greedy tabu search algorithm within the bnlearn package (Scutari et al., 2022) to estimate the network structure across 4 weeks of treatment (the standard length of the intervention). A greedy search begins with an empty DAG and returns a DAG that maximizes the goodness-of-fit score (a relative measure of a model’s fit to the data calculated using the Bayesian information criterion). To do this, it computes a modified score for every possible edge addition, deletion, or reversal and retains the DAG with the highest score; this action is repeated until no modifications can increase the score. Once this “hill” has been reached, the process is repeated, starting from both the DAG with the previous highest score (retained in a “tabu” list) and a random DAG (generated by making several perturbations to the existing DAG at once) to see if a higher score can be obtained. The DAG with the highest score across all three processes is kept (Glover & Laguna, 1997). We used a blacklist (a list of edges prohibited in the network) to instruct the model not to consider directed relationships that were temporally impossible (i.e., a child node that chronologically precedes a parent node) or temporally ambiguous (i.e., a child node that is measured concurrently with a parent node). However, we chose to allow edges that “jumped” time steps (e.g., an edge from a node at Time 1 to a node at Time 3) because causal relationships between these variables are theoretically possible (i.e., PD symptoms at Time 1 could predict PD symptoms at Time 3 independent of PD symptoms at Time 2).
We employed the bootnet function to assess the stability of the networks; we bootstrapped 1,000 samples with replacement from our overall sample and constructed a network for each of them. Next, we calculated the edge strength of each directed relationship by determining the proportion of bootstrapped networks in which it appeared (i.e., an edge that appeared in all 1,000 bootstrapped networks would have an edge strength of 1.00, whereas an edge that appeared in only 750 would have an edge strength of 0.75). We then determined the appropriate threshold to include edges in our final network to optimize its specificity and sensitivity. Because the vast majority of edge strengths were continuously distributed between 0.2 and 0.95, we used an edge-selection method pioneered by Scutari and Nagarajan (2013) to estimate the optimal significance threshold for inclusion, which uses the L1 norm (calculated by summing the magnitude of each vector) to approximate the ideal asymptotic cumulative distribution function (CDF; the probability that a variable’s value is less than or equal to x) using the CDF of the confidence in the observed edges. According to the results of this analysis, if an edge appeared in at least 50% of the bootstrapped networks, it was included in the final network, which we graphed using the Rgraphviz package (Hansen et al., 2022). We then repeated this process to create a second network using only participants for whom complete data were present.
The conditional probability coefficient (represented as β) of each node in our networks represents the relationship between the two nodes after accounting for every other edge in the network structure. All included variables were standardized before network estimation; thus, a larger conditional probability coefficient indicates a larger conditional dependence relationship between the two nodes regardless of which nodes constitute that particular edge. For both networks, we then calculated the number of false positive and negative edges that the original network included relative to the final network. False positives were defined as edges that appeared in the original network but not the final network; false negatives were defined as edges that appeared in the final network but not the original network. The implications of false-positive and false-negative edges are primarily related to the stability of the network; the network’s stability (the performance of the edge-selection method) can be assessed by the relative proportion of false-positive and false-negative edges to true-positive edges, with unstable networks having a higher proportion of false positives and false negatives.
We calculated four metrics to assess the influence of each node in our networks. A node’s degree centrality was calculated as the total number of edges for which it was a parent node (the total number of edges from that node to other nodes in the network). A node’s one-step expected influence (Robinaugh et al., 2016) was calculated as the summed weight (conditional probability) of each edge for which it was a parent node. Finally, given our interest in a node’s influence on PD symptoms specifically, we repeated both calculations while considering only edges in which the child node was a PD symptom. These metrics were calculated for each individual node and for each variable as a whole (by calculating the sum across time points).
We also conducted network comparisons to assess for meaningful differences between our overall and complete data networks and for meaningful differences as a function of gender or hypocapnia. Network comparisons were made visually using the compare function from Rgraphviz, which highlights the differences between two network structures, and quantitatively by calculating the structural Hamming distance (SHD) using bnlearn. SHD is a measure of the difference between two networks based on how many edges differ between them.
We assessed gender and hypocapnia differences in the network by constructing two averaged networks for both demographic variables (hypocapnic vs. normocapnic; identifying as men vs. identifying as women) using the process described above. The number of nonbinary individuals in our sample did not permit us to construct a network from individuals with this gender identity. To assess the meaningfulness of observed differences between networks and between individual edges across networks, we bootstrapped a distribution of overall network differences and differences in individual edge strengths. We randomly split our data set into two groups 100 times, with the size of each group determined by the average group size among our three between-groups network comparisons (the size of the larger random group, n = 1,152, was the average of the women and normocapnic groups, and the size of the smaller random group, n = 587, was the average of the men and hypocapnic groups). For each random split, we constructed a network and estimated edge strengths for each group using the same process outlined above. We then compared the two networks by calculating the SHD between them and the difference in edge strength for each individual edge between the two networks.
The SHDs and differences between individual edge strengths calculated across all 100 iterations of this process served as the distributions with which we compared the network comparisons we conducted. We defined a meaningful difference between networks as one in which the SHD exceeded 95% of the SHDs between random split bootstrapped networks. Likewise, we defined a difference between individual edge strengths to be meaningful if its magnitude exceeded 95% of the differences between individual edge strengths among the random split bootstrapped networks. Each of these 95% thresholds was then adjusted to account for multiple comparisons using the Benjamini-Hochberg (Benjamini & Hochberg, 1995) method. Although this is a novel approach for evaluating meaningful differences between dynamic DAGs, there is substantial precedent for employing bootstrapped distributions to determine the distribution of measures of model performance (e.g., Bollen & Stine, 1992; Kim & Millsap, 2014; Picheny et al., 2010).
Results
Dynamic DAG
Of the 134 edges in the overall (imputed) network, 121 (90.3%) were replicated in the complete data network, and only two (1.6%) of the edges in the complete data network did not appear in the overall network, suggesting that our results were not sensitive to the inclusion of imputed data. As a result, we report below the results from the overall network. Results from the network including only participants with complete data are reported in the Supplemental Material available online.
Figure 1 provides a graphical representation of the DAG arising from the averaging of the 1,000 bootstrapped networks in which edge signifies the strength of the conditional dependence relationship. Arrow flow indicates the direction and temporal precedence of this relationship, although we note that this does not prove causation. The stability of the DAG was high, with 134 true-positive results (90.5%), 14 false-positive results (9.5%), and 0 false-negative results (0%), observed from the comparison of the initial model with the bootstrapped average. Degree centrality (DC) and one-step expected influence (EI1) are reported for each variable; for a breakdown by individual time point, see Table 2. Conditional probabilities (represented as β) and edge strengths for each edge in the averaged network are reported in the Supplemental Material; a report on these estimates for edges relevant to our a priori hypotheses follows.
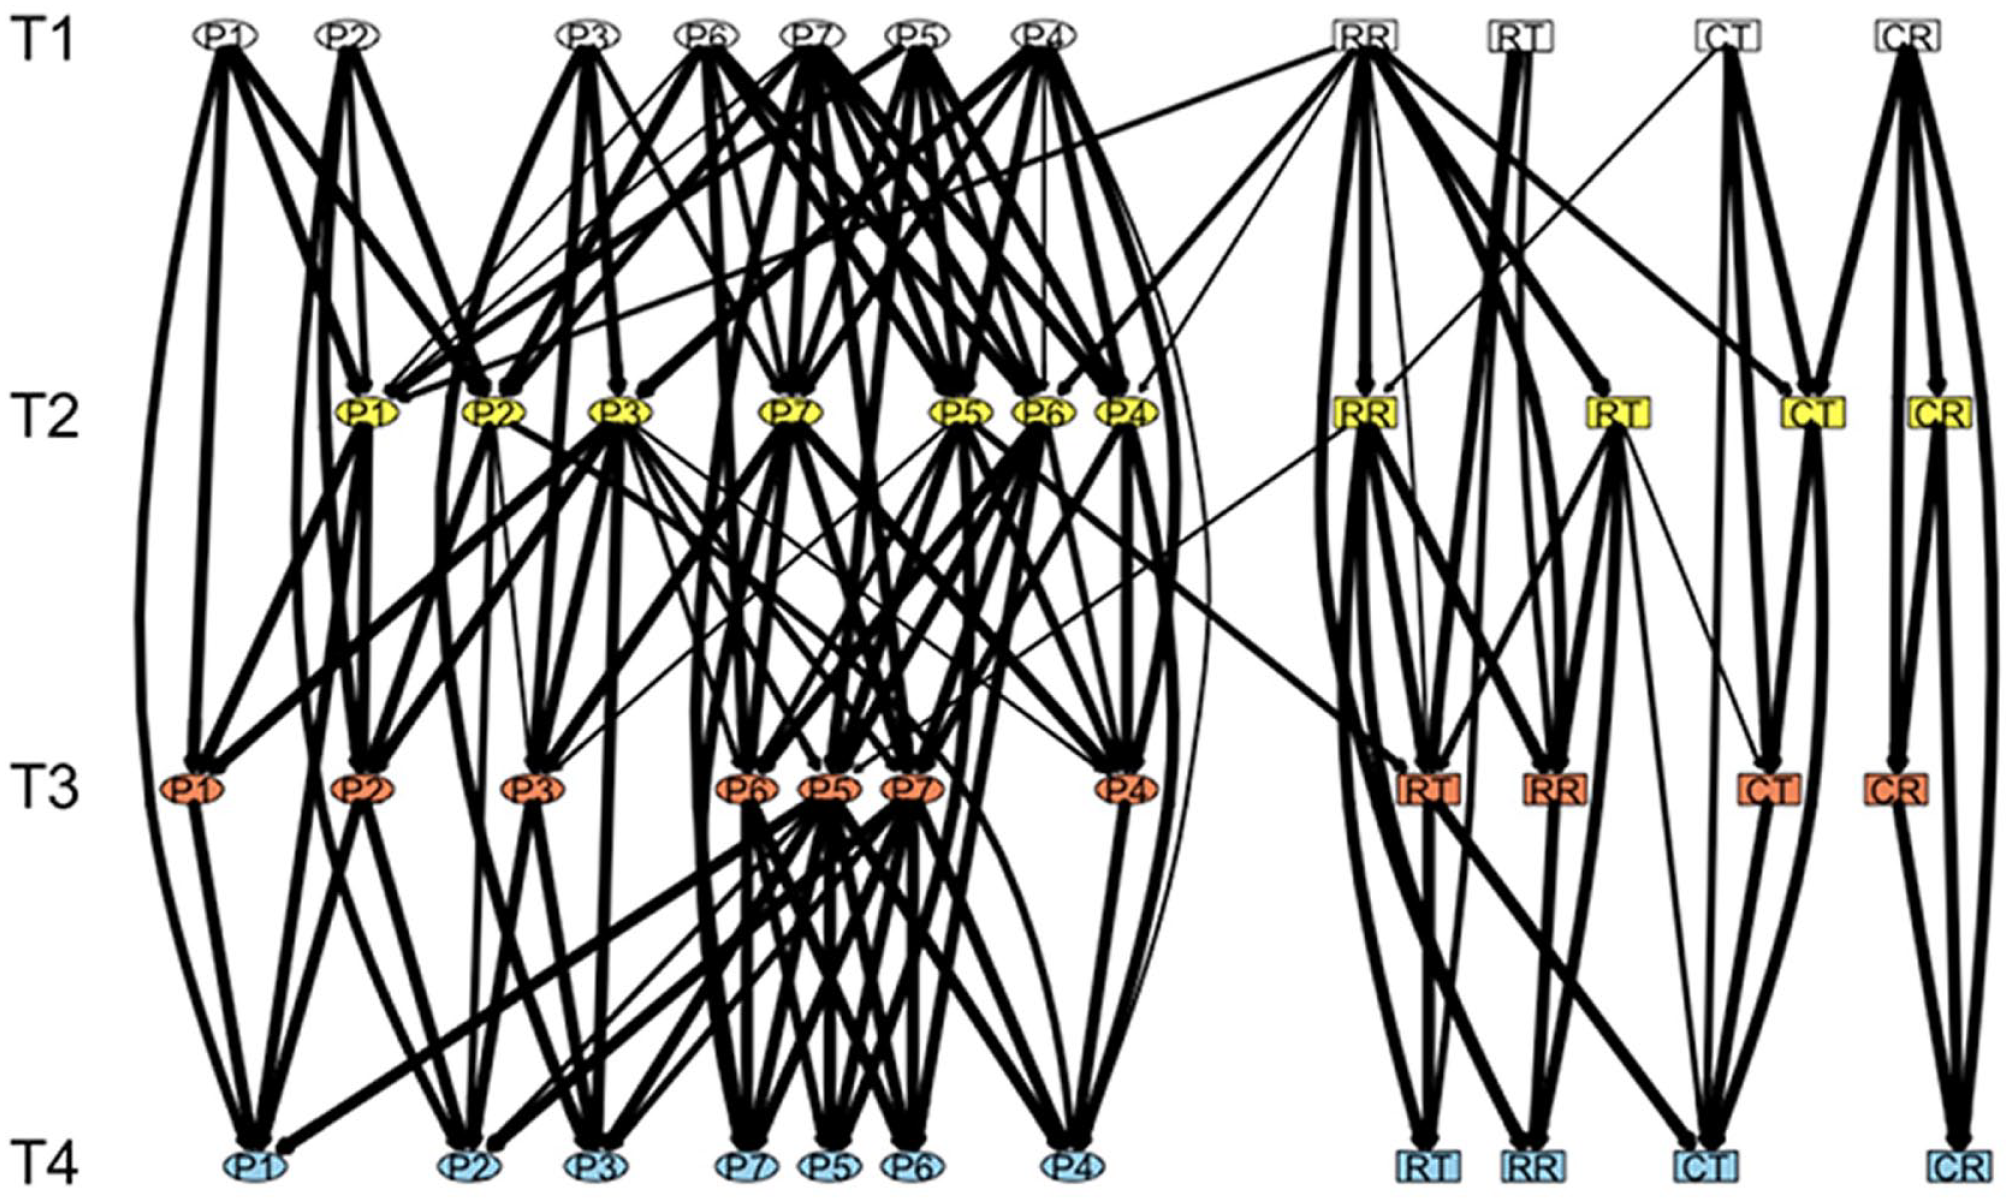
Dynamic directed acyclic graph. Dynamic (longitudinal) directed acyclic graph of the network between panic-disorder symptoms (as measured by the Panic Disorder Severity Scale–Self Report; ellipses) and respiratory biomarkers (rectangles) across 4 weeks of treatment. Edge arrows represent the direction of the relationships between nodes (flowing from top to bottom), and edge thickness signifies how frequently the edge appeared in bootstrapped networks (edge strength). Data included are from Week 1 (T1; white), Week 2 (T2; yellow), Week 3 (T3; red), and Week 4 (T4; blue). The seven panic-disorder symptoms are panic-attack frequency (P1), panic-attack distress (P2), fear of panic symptoms (P3), avoidance of places or situations (P4), avoidance of activities (P5), work/home impairment (P6), and social/relationship impairment (P7). The four respiratory biomarkers are mean resting respiration rate (RR), mean resting end-tidal CO2 (CR), variation from target respiration rate during transition stage (RT), and variation from target end-tidal CO2 during transition stage (CT).
Panic-Disorder Symptom and Respiratory Biomarker Influence Metrics
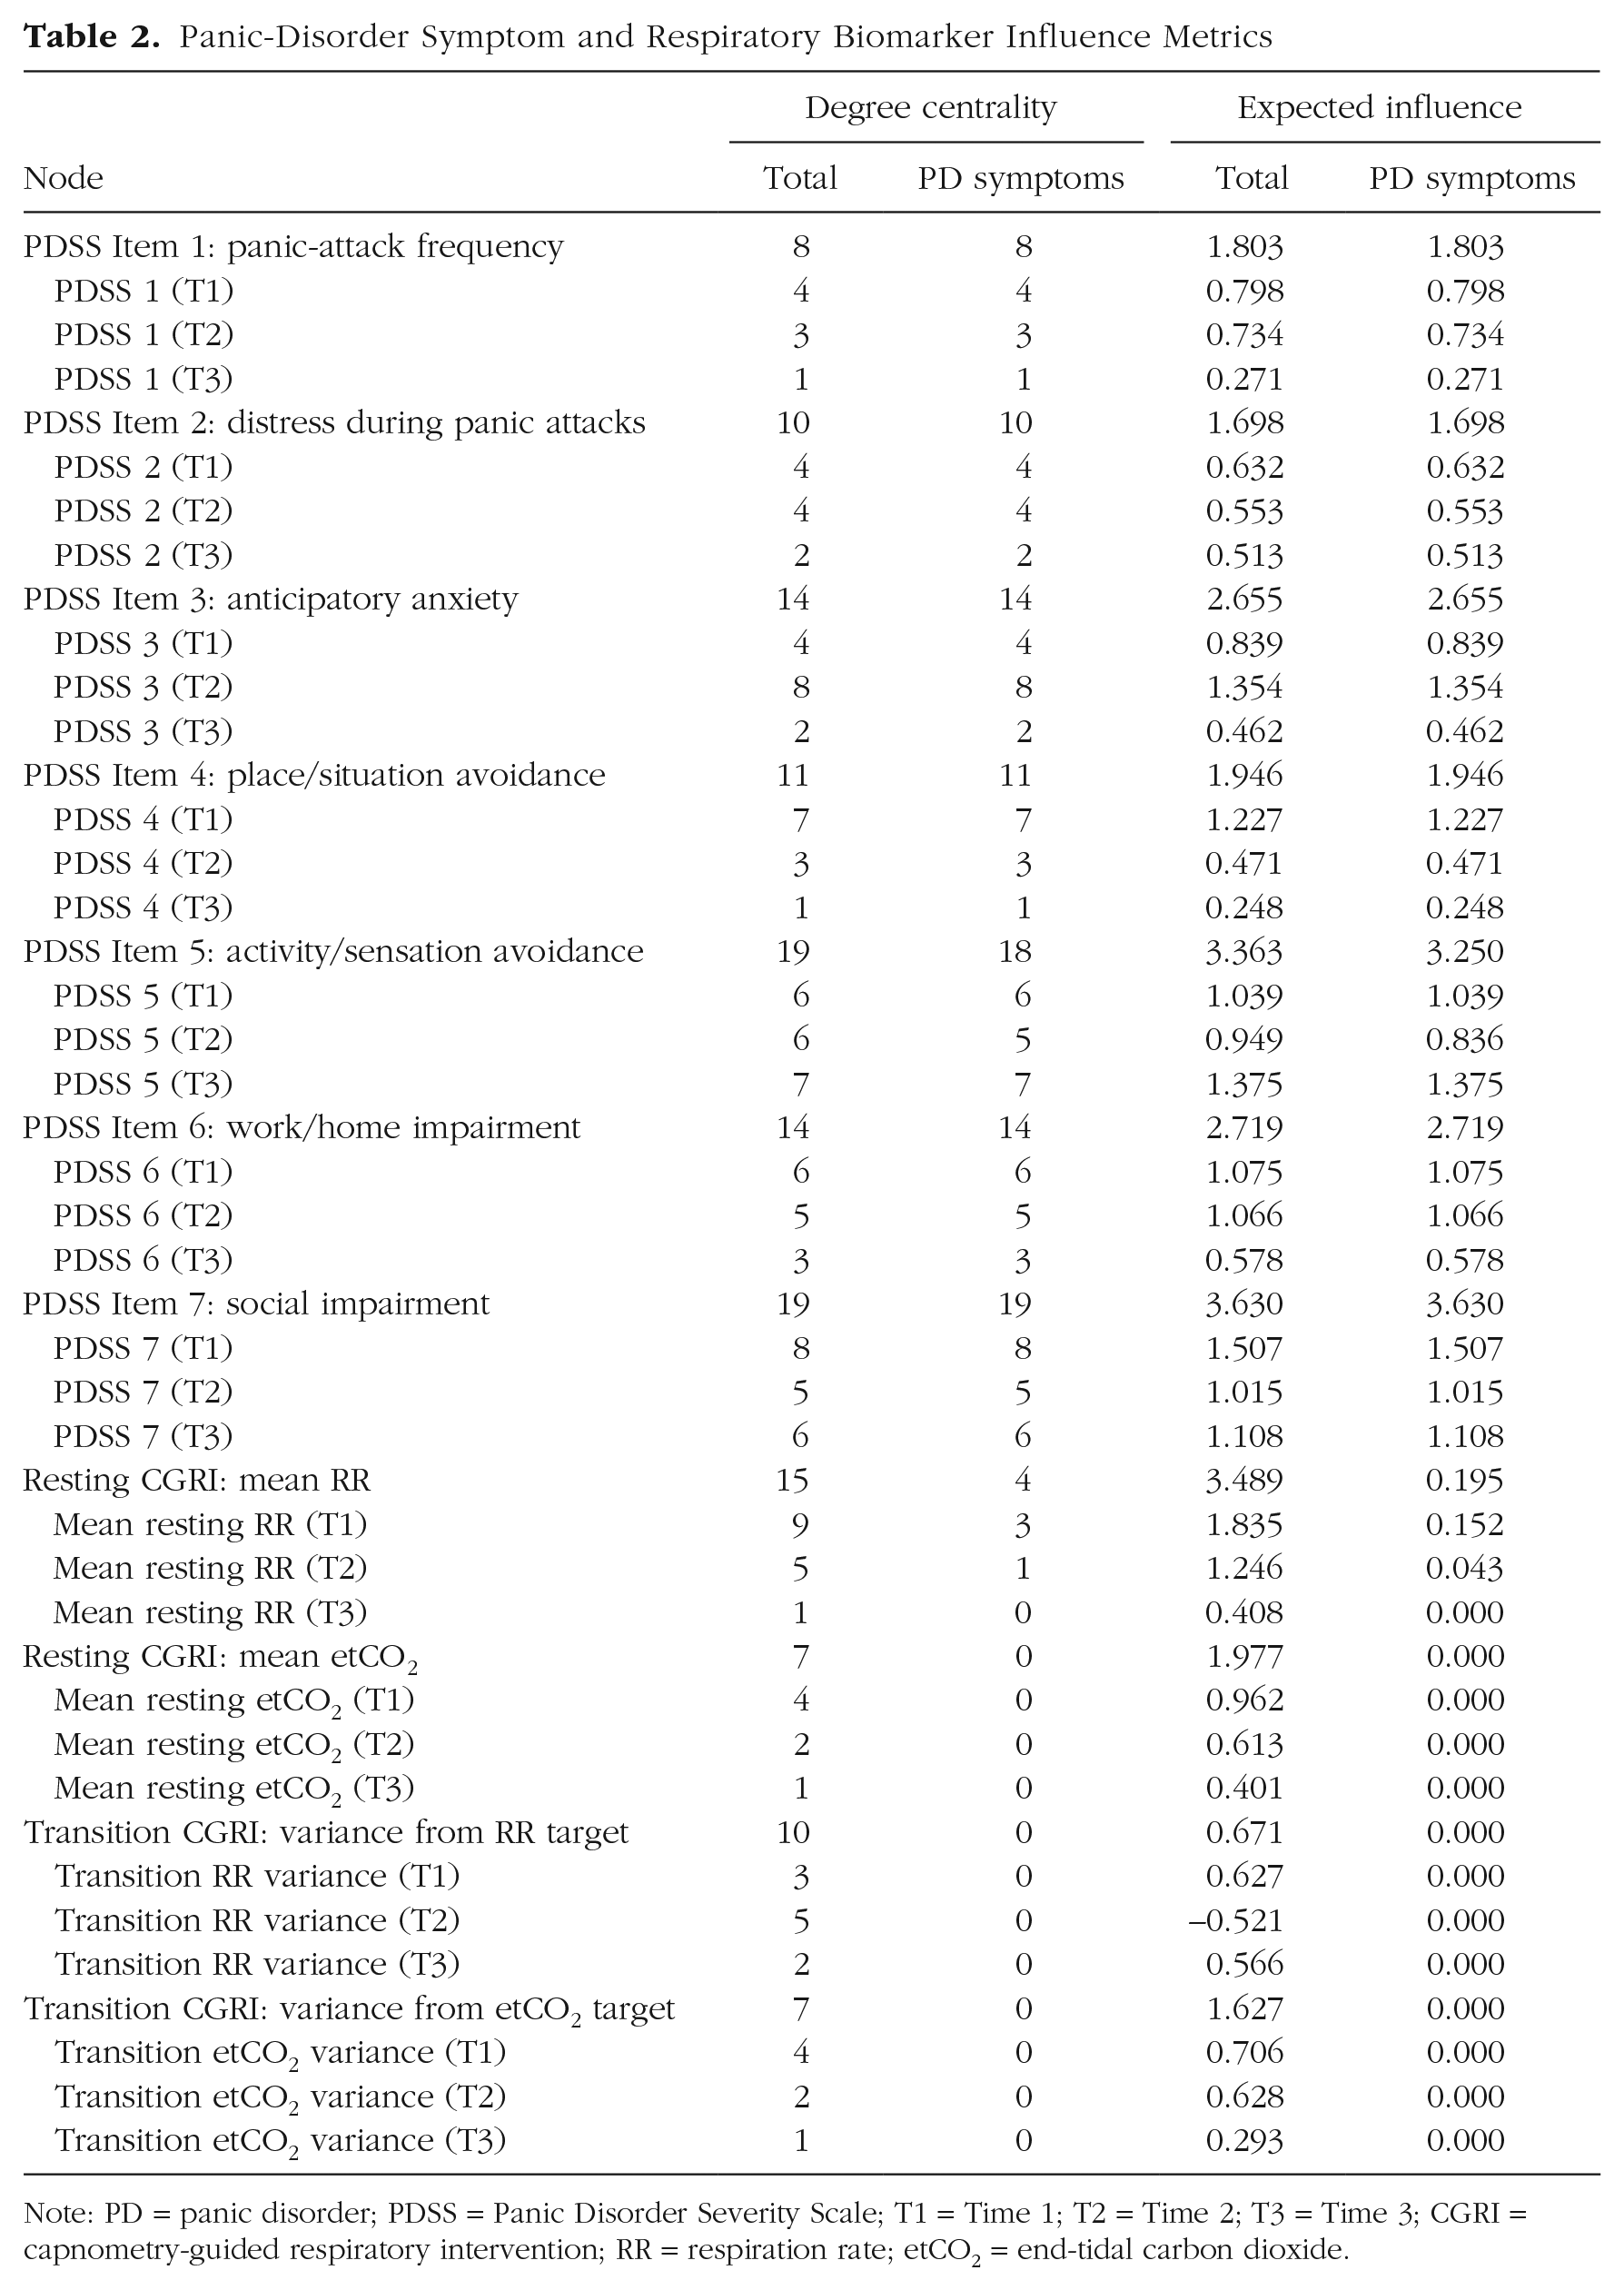
Note: PD = panic disorder; PDSS = Panic Disorder Severity Scale; T1 = Time 1; T2 = Time 2; T3 = Time 3; CGRI = capnometry-guided respiratory intervention; RR = respiration rate; etCO2 = end-tidal carbon dioxide.
Relationships among PDSS symptoms
Our network had a nontrivial topology in which all symptoms were connected but some symptoms were more influential to the network than others. Social impairment (DC = 19, EI1 = 3.630) and avoidance of activities and aversive physical sensations (overall: DC = 19, EI1 = 3.363; PDSS symptoms: DC = 18, EI1 = 3.250) were the most influential symptoms in the network, followed by work impairment (DC = 14, EI1 = 2.719), anticipatory anxiety regarding panic (DC = 14, EI1 = 2.655), and avoidance of places and situations (DC = 11, EI1 = 1.946). Panic-attack frequency (DC = 8, EI1 = 1.803) and panic-attack distress (DC = 10, EI1 = 1.698) were least influential.
The network also contained multiple positive feedback loops between symptoms: Panic-attack distress and panic-attack frequency, activity avoidance and work impairment, work impairment and social impairment, and social impairment and situation avoidance had continuous, bidirectional relationships from Time 1 (T1) to Time 4 (T4). Some evidence was also found for a mutual, positive relationship between fear of panic symptoms and avoidance. Fear of panic predicted avoidance of activities and physical sensations (Time 2 [T2]–Time 3 [T3]; β = 0.116, edge strength = 0.85) and avoidance of situations (T2–T3; β = 0.070, edge strength = 0.59) at one time point, avoidance of activities and physical sensations predicted fear of panic at two time points (T2–T3; β = 0.064, edge strength = 0.58; T3–T4; β = 0.181, edge strength = 1.00), and avoidance of situations predicted fear of panic at one time point (T1–T2; β = 0.240, edge strength = 1.00).
Relationships among respiratory biomarkers
Variance from target RR during the transition stage had a positive conditional dependence relationship with mean RR during the resting stage from T1 to T3 (β = 0.337, edge strength = 1.00) and T2 to T4 (β = 0.146, edge strength = 0.98) but a negative relationship from T2 to T3 (β = −0.329, edge strength = 0.97). Variance from target RR during the transition stage also predicted variance from target etCO2 during the transition stage from T1 to T2 (β = 0.183, edge strength = 0.82). However, variance from target etCO2 during the transition stage did not predict mean etCO2 during the resting stage and predicted mean RR during the resting stage at only one time point (T1 to T2; β = 0.055, edge strength = 0.66). Moreover, mean etCO2 during the resting stage did not predict RR at any time point.
Relationships between PD symptoms and respiratory biomarkers
Mean RR during the resting phase predicted panic-attack frequency from T1 to T2 (β = 0.054, edge strength = 0.69), situation avoidance from T1 to T2 (β = 0.044, edge strength = 0.59), activity avoidance from T2 to T3 (β = 0.043, edge strength = 0.58), and work impairment from T1 to T2 (β = 0.054, edge strength = 0.80). Activity avoidance also predicted variance from target RR during the transition stage from T2 to T3 (β = 0.114, edge strength = 0.83). Mean RR during the resting phase (DC = 15, EI1 = 3.489) had a greater influence on the network than variance from target RR during the transition phase (DC = 10, EI1 = 0.671), variance from target etCO2 during the transition phase (DC = 7, EI1 = 1.627), and mean etCO2 during the resting phase (DC = 7, EI1 = 1.977). Mean RR during the resting phase was also the only respiratory biomarker to influence panic symptoms (panic: DC = 4, EI1 = 0.195); neither mean etCO2 during the resting phase, variation from target etCO2 during the transition phase, nor variation from target RR during the resting phase predicted downstream PDSS symptoms.
Network comparisons based on hypocapnia status and gender
There were no differences between networks constructed with hypocapnic versus normocapnic individuals beyond what would be expected from random variation. The SHD (59) between the hypocapnic and normocapnic networks was equal to or exceeded by 51% of bootstrapped networks generated from a random split in the data set. Moreover, there were no meaningful differences in the strengths of any individual edges that related to our hypothesis (i.e., edges in which respiratory biomarkers predicted PDSS symptoms) between the hypocapnic and normocapnic networks after accounting for multiple comparisons. Anecdotally, however, we note that the hypocapnic network contained four edges from respiratory biomarkers to PD symptoms and that the normocapnic network contained none, although the difference in these edge strengths between the two networks did not meet the 95% threshold for meaningfulness.
Similar results were obtained by comparing networks across gender. The SHD (82) between the men and women networks was equal to or exceeded by 43% of bootstrapped networks generated from a random split in the data set. There were no meaningful differences in the strengths of individual edges between men and women networks after accounting for multiple comparisons. However, the men network contained four edges from respiratory biomarkers to PD symptoms, whereas the women network contained none (these edge-strength differences also did not meet the 95% threshold for meaningfulness).
Discussion
This study represents the first longitudinal network analysis of PD symptoms over the course of an empirically supported treatment. Building on the cross-sectional networks established by Cha and colleagues (2022) and Kim and colleagues (Kim, Bang, et al., 2023; Kim, Lee, & Pae, 2023), we took our study further by examining conditional relationships between PDSS symptoms and relationships between PDSS symptoms and two theory-relevant respiratory biomarkers—RR and etCO2—measured continuously during treatment. Our analyses revealed a stable longitudinal network wherein panic-related anxiety bridged functional impairment and avoidance to panic-attack frequency and distress. Impairment and avoidance maintained mutual, positive associations over time. In addition, our findings align with the cross-sectional outcomes in highlighting avoidance and social impairment as central symptoms within the network structure. These results are consistent with earlier findings showing that panic-related avoidance is a better predictor of poor quality of life among PD patients relative to frequency of panic attacks (Telch et al., 1995). Indeed, current panic attacks are not even necessary for a diagnosis of current PD (American Psychiatric Association, 2013).
Consistent with threat-appraisal models of PD, anxiety or worry about future panic attacks (PDSS Item 3) was influential in predicting all other downstream PDSS symptoms, thus serving as an important bridge from avoidance and impairment to panic attacks. However, severity of emotional distress during panic (PDSS Item 2) showed a relatively weak influence on other PDSS symptoms except for panic-attack frequency. One possible explanation is that PDSS Item 2 may serve as a proxy for panic-attack frequency rather than amount of distress caused by panic symptoms (because panic attacks are, by definition, distressing). Indeed, factor-analytic studies of the PDSS have shown that panic-attack frequency and distress during panic tend to load onto the same factor (Lim et al., 2007; Monkul et al., 2002; Shear et al., 1997; but see also Shear et al., 2001).
An alternative explanation is that fear of panic is more central to the etiology of PD than to its maintenance. Indeed, Clark’s (1986) original cognitive model sought to explain the phenomenon of panic attacks rather than PD per se, and avoidance has long been considered a central symptom in the maintenance of PD (Craske & Barlow, 1988). Avoidance is also a clear symptom target of evidence-based treatment for PD with an exposure component (e.g., Telch et al., 1993), further suggesting its importance as a maintenance factor. Although fear of panic symptoms is generally thought to underlie avoidance in PD (Craske & Barlow, 1988), it is possible that the influence of arousal on avoidance is more salient during PD onset and that avoidance becomes self-sustaining once PD has developed. This interpretation would explain why both avoidance of activities and social impairment had greater influence in our network than distress during panic attacks or panic-related anxiety. Future research should investigate these hypotheses.
Our finding that social impairment and avoidance of activities are more central to the PD-symptom network than panic-attack frequency is consistent with the results of Cha and colleagues’ (2022) cross-sectional network. Their prediction that changes in avoidance during treatment would quickly diffuse to other symptoms in a longitudinal network was supported by the large number of connections between avoidance and other downstream PDSS symptoms. The influence of avoidance of activities on downstream panic-attack frequency and panic-related anxiety symptoms is consistent with the proposed feedback loop between avoidance and distress in PD (Craske & Barlow, 1988; Salkovskis et al., 1999), as is the observed relationship between anticipatory anxiety and subsequent avoidance.
Consistent with previous findings (Cha et al., 2022; Kim, Bang, et al., 2023; Kim, Lee, & Pae, 2023), social impairment functioned as a central node in our network, predicting avoidance of situations and activities across multiple time steps. As an explanation for this finding, Cha and colleagues (2022) suggested a reciprocal relationship between social impairment and avoidance, citing the theoretical model of PD put forth by Fava and Morton (2009), asserting that social dysfunction lowers one’s perceived self-efficacy and increases faulty social-threat appraisals. Indeed, social impairment predicted avoidance of situations and activities across multiple time points in our network, which implicates social impairment as an important treatment target for PD.
Our network findings regarding the suffocation-alarm theory of panic and theorized mechanism of action of CGRI for PD were mixed. Despite prior findings in support of the suffocation-alarm model, there was no evidence for a relationship between etCO2 and downstream PDSS symptoms in our network. This result aligns with prior work that indicated both panic and chronic hyperventilation among individuals with PD may instead be caused by a fear of aversive physical sensations (Schmidt et al., 1996). However, as discussed above regarding cognitive models of panic, it may instead be the case that the suffocation alarm is more essential to PD etiology than PD maintenance. Initial panic attacks resulting from a faulty suffocation alarm could trigger a self-sustaining feedback loop involving impairment and avoidance in much the same way that a fear of aversive physical sensations could. A longitudinal network analysis among individuals at risk for PD (i.e., participants scoring high on anxiety sensitivity who have yet to develop PD) would be informative in determining whether these respiratory biomarkers increase risk for developing PD.
The lack of connections between etCO2 and downstream PD symptoms ran contrary to one of the hypothesized mechanisms of change in CGRI (i.e., correcting overbreathing). We found no evidence in the network that success in meeting target etCO2 during the transition stage of treatment predicted resting etCO2 in subsequent weeks. Placebo-controlled mediation analyses of CGRI with large-scale data sets are best equipped to definitively determine how its observed effectiveness is achieved. Nonetheless, it seems likely from our network that other mechanisms are needed to fully explain the effectiveness of CGRI in reducing PDSS symptoms beyond the correction of maladaptive breathing patterns. Future mediation analyses should follow the example of Davies and colleagues (2019) in considering anxiety sensitivity and perceived control as potential mediators because improved control over respiration could theoretically increase perceived control or reduce the perceived threat of anxiety symptoms. Each of these outcomes has been linked to PD (e.g., Telch et al., 1996). In addition, given evidence from our network that resting RR better predicted downstream biomarkers and PDSS symptoms than ability to meet target etCO2, these analyses should also consider RR as a potential mechanism of action, a variable that was missing from Davies and colleagues’ mediation analysis.
One potential explanation for the greater importance of RR compared with etCO2 in the network is that changes in RR may have had a larger effect on perceived respiratory control. Because etCO2 cannot be monitored outside of respiratory training sessions, participants may have attributed their symptom reduction to controlling their RR, thus promoting a greater sense of respiratory coping self-efficacy. Future mediation analyses of CGRI may shed considerable light on this issue. Evidence that resting RR predicted downstream PDSS symptoms offers support for the role of respiratory biomarkers in the PD symptom network more generally. This finding is consistent with decades of research that has demonstrated a link between panic and respiratory abnormalities (Antony et al., 1997; Ley, 1985; Papp et al., 1993; Schmidt & Telch, 1994; Telch et al., 2003) and underscores the importance of including psychophysiological data and other external factors in network analyses. Moreover, success in meeting target RR during the transition phase of CGRI predicted RR during the subsequent resting phase, suggesting that adherence to CGRI may lead to healthier respiration that lasts beyond the treatment session. This conclusion is supported by prior work that indicated gains in RR and etCO2 from CGRI are largely maintained at 12-month follow-up (Tolin et al., 2017).
We found no evidence for meaningful differences in the network structure between hypocapnic and normocapnic participants. This finding stands in contrast to the proposed mechanism underlying CGRI and some prior research that suggested changes in etCO2 mediate the effect of CGRI on PDSS symptoms displaying hypocapnia (Davies et al., 2019). However, it is consistent with data showing that CGRI is beneficial irrespective of patients’ baseline RR or etCO2 levels (Cuyler et al., 2022; Meuret et al., 2008; Tolin et al., 2017). Nonetheless, this finding should be interpreted with caution for two reasons. First, little prior work has been done on assessing meaningful differences between dynamic DAGs, and our methods for doing so were largely exploratory, and second, the levels recorded during the first week of treatment may not be representative of subjects’ baseline hypocapnia, particularly given that these measurements do not represent a true pretreatment baseline. In addition, previous work has shown considerable variability in respiratory biomarkers among PD patients before the onset of panic attacks (Meuret et al., 2011). A persuasive experimental manipulation in which CGRI is compared with sham biofeedback is needed to determine whether capnometry guidance is an essential component of the CGRI protocol.
Strengths of our investigation include the relatively large sample size and the longitudinal nature of our data. As reviewed earlier, the only prior symptom networks of PD that could be identified in the literature involved cross-sectional data of much smaller samples. Moreover, our decision to blacklist temporally ambiguous edges from our network ensures that although not necessarily causal, all observed relationships satisfy the criterion of temporal precedence. An important strength of our network is its inclusion of external factors in addition to PD symptoms. Considering only traditional symptoms has been cited as a significant limitation in the ability to fully understand the causal network structure of psychological disorders (Hoffart & Johnson, 2020). Because our included external factors take the form of theory-relevant respiratory biomarkers, we also add to the growing body of transdisciplinary research demonstrating the importance of physiological data in psychopathology generally and the role of respiration in PD more specifically.
Nevertheless, several limitations deserve mention. First, the PDSS-SR, although yielding psychometrically robust total scores, may not be the best PD measure for network analysis. Some have suggested that individual items from the PDSS-SR may lack construct validity (Wuyek et al., 2011). Ideally, rather than using individual items of any one psychometric measure, network analyses should employ sum scores from unidimensional, psychometrically validated measures of each symptom or construct that is hoped to be included in the network. Second, the continuous distribution of edge strengths in our network made any edge-strength threshold for determining inclusion in the final network somewhat arbitrary. Although we employed the threshold-selection method of Scutari and Nagarajan (2013; see above) to maintain fidelity with our original analysis plan, a higher inclusion threshold may have led to a sparser network with even higher stability. Third, as mentioned above, gaps in the literature on comparisons between DAGs and our method of determining hypocapnia at baseline also prevented us from drawing firm conclusions about differences between networks constructed with hypocapnic and normocapnic individuals.
As previously stated, one of the primary limitations of many existing network analyses of psychological disorders is the absence of external factors (i.e., nodes other than the traditionally defined symptoms of the disorder in question). Although we included external factors in the form of theory-relevant respiratory biomarkers, several other relevant panic-related constructs were absent from the data set. These include (a) anxiety sensitivity (Schmidt et al., 2006), (b) fear of benign bodily sensations (Chambless et al., 1984), (c) hypervigilance to somatic sensations, (d) panic coping self-efficacy (Telch et al., 1989), (e) false safety behaviors (Salkovskis et al., 1999; Telch & Zaizar, 2020), (f) perceived control (Meuret, Hofmann, Rosenfield, 2010; Sanderson et al., 1989; Telch et al., 1996), (g) attention to threatening stimuli (H.-J. Lee & Telch, 2008), and (h) desensitization to dyspnea (Meuret et al., 2018). Moreover, our data set was limited to PD symptoms as measured by the PDSS-SR; future studies should consider including the 13 DSM-5 (American Psychiatric Association, 2013) panic-attack symptoms. Including these components in the network may have enabled us to draw more comprehensive conclusions about how the PD network reinforces itself.
Although our sample encompassed a broad age range, it included merely six nonbinary individuals, thus limiting the generalizability of our findings to this population. Furthermore, because age and gender identity were the only available demographic variables, we could not assess possible differences in the network as a function of race, ethnicity, socioeconomic status, or sexual orientation. There was also one set of relationships in our network for which we have no substantive explanation. Relationships from RR during the transition phase at T2 to subsequent resting RR and transition CO2 nodes were negative. This result runs contrary to expectation and the observation that these relationships were positive at every other time step. However, the fact that each of these edges was consistent with each other implies that this finding likely reflects an anomaly in our data rather than an issue with our network structure. Taken together, it therefore seems likely that these negative relationships are unique to our data set and unlikely to be reflective of any real aspect of the relationships among respiratory biomarkers in CGRI. Nevertheless, a replication of our findings in which (a) these negative relationships were not present and (b) the overall network structure among respiratory biomarkers was not meaningfully different from our network structure would be needed to confirm this assumption.
Indeed, future network analyses are needed to evaluate the generalizability of our network to other demographic groups, particularly because the data set was limited demographically to age and gender. These networks would also benefit from the inclusion of theory-based putative mediators of PD described above and psychometrically validated measures of individual PDSS symptoms, neither of which were available in our data set. Future network analyses that recruit individuals who are at risk for PD (e.g., elevated anxiety sensitivity) but have yet to develop PD symptoms would help inform the conditional dependence relationships of PDSS symptoms as they develop. In addition, future experimental research is necessary to determine whether the edges in our network truly represent causal relationships between symptoms, and future clinical research must still assess whether the influence of various symptoms in the network can serve as intervention targets in psychotherapy. For example, subsequent randomized clinical trials could evaluate the effectiveness of social interventions among individuals with PD given the high influence of social impairment in our network. Although several prior studies have demonstrated the utility of symptom networks in identifying intervention targets (e.g., Forrest et al., 2023; Papini et al., 2020; Robinaugh et al., 2016), there have been some exceptions (e.g., C. T. Lee et al., 2023), suggesting that further research is clearly needed.
Despite decades of seminal research, questions remain about the mechanisms through which psychological disorders are caused, maintained, and treated. Leveraging the capability to concurrently probe the conditional dependence relationships among mental health, network analyses offer several advantages over traditional conceptualizations of psychological disorders as latent “diseases.” Thus, they may be distinctly positioned to discern mediators pivotal to the etiology, maintenance, and treatment of panic disorder and, more broadly, psychological disorders.
Supplemental Material
sj-docx-1-cpx-10.1177_21677026241263330 – Supplemental material for A Bayesian Longitudinal Network Analysis of Panic-Disorder Symptoms and Respiratory Biomarkers
Supplemental material, sj-docx-1-cpx-10.1177_21677026241263330 for A Bayesian Longitudinal Network Analysis of Panic-Disorder Symptoms and Respiratory Biomarkers by Galen P. Cassidy, Mikael Rubin, Santiago Papini and Michael J. Telch in Clinical Psychological Science
Footnotes
Acknowledgements
We acknowledge the contributions of the following individuals and entities: Freespira, Inc., especially Robert Cuyler, Simon Thomas, and Rahul Katdare, for making their data set available for use in this study, and Marco Scutari, for consultation regarding data analyses.
Transparency
Action Editor: Kelsie T. Forbush
Editor: Jennifer L. Tackett
Author Contributions
References
Supplementary Material
Please find the following supplemental material available below.
For Open Access articles published under a Creative Commons License, all supplemental material carries the same license as the article it is associated with.
For non-Open Access articles published, all supplemental material carries a non-exclusive license, and permission requests for re-use of supplemental material or any part of supplemental material shall be sent directly to the copyright owner as specified in the copyright notice associated with the article.