
Abstract
In the last 2 decades, the widespread adoption of Internet technologies has inspired concern that they have negatively affected mental health and psychological well-being. However, research on the topic is contested and hampered by methodological shortcomings, leaving the broader consequences of Internet adoption unknown. We show that the past 2 decades have seen only small and inconsistent changes in global well-being and mental health that are not suggestive of the idea that the adoption of Internet and mobile broadband is consistently linked to negative psychological outcomes. Further investigation of this topic requires transparent study of online behaviors where they occur (i.e., on online platforms). We call for increased collaborative efforts between independent scientists and the Internet-technology sector.
In 2005, an estimated 17% of the global population used the Internet, but by 2020, this number was already 59% (International Telecommunication Union [ITU], 2021). Accompanying the rapid spread of the Internet, worries have proliferated that its broad adoption—and technologies enabled by it, such as online games, smartphones, and social media—is actively harming its users, particularly adolescents (Carr, 2010; Turkle, 2011). As a response, users and a growing number of national governments have acted in limiting access to online technologies (Buckley, 2021; Department for Digital, Culture, Media & Sport, 2021; Kattula et al., 2021).
However, evidence for widespread harms of online technologies is limited. Initial reports of Internet-facilitated harms have been challenged by later work informed by many methodologies, including longitudinal (Jensen et al., 2019), specification-curve analyses (Orben & Przybylski, 2019), meta-analyses (Appel et al., 2020), and systematic reviews (Best et al., 2014; Dickson et al., 2019; Odgers & Jensen, 2020; Ophir et al., 2020). Reviews indicate early research has been hampered by inaccurate measurements of engagement with Internet and related technologies (Davidson et al., 2022; Parry et al., 2021; Scharkow, 2016), biased convenience samples drawn predominantly from countries in the Global North (Ghai et al., 2022, 2023) studying a limited range of well-being outcomes (Orben et al., 2019), and reliance on self-reported evaluations in place of clinical estimates of important mental-health outcomes (Campbell et al., 2006). A comprehensive test of the overall association between Internet adoption and well-being and mental health, broadly defined, has therefore not been conducted. As a consequence, much of the evidence purporting to show that Internet-technology adoption is associated with broad changes in well-being and mental health or even causes negative outcomes remains equivocal (Dickson et al., 2019; Hawkes, 2019).
In this research, we present two studies of global well-being and mental health in the Internet age. In the first, we focus on three aspects of psychological well-being and contrast them with yearly per capita Internet users and mobile-broadband subscriptions across 168 countries and 16 years. In the second, we examine three mental-health outcomes across 202 countries and 19 years. Our aim is to better understand (a) how well-being and mental health have changed, on a global scale, during the past 2 decades of dramatic proliferation of Internet technologies and connectivity; (b) how per capita Internet users and mobile-broadband subscriptions predict country-level well-being and mental health within a given country and across countries; and (c) the extent to which associations between Internet-technology adoption and well-being and mental health differ across age and sex and if they are specific to previously suggested vulnerable populations, such as young women.
Study 1: Well-Being
In Study 1, we focused on psychological well-being, as reflected in self-reports of life satisfaction, positive experiences, and negative experiences from 2,434,203 individuals age 15 to 89 across 168 countries from 2005 to 2022. We contrasted those observations with time-series data of the countries’ per capita Internet users and mobile-broadband subscriptions (ITU, 2021) to examine if and how Internet and mobile-broadband adoption predicted psychological well-being over the past 2 decades.
Transparency and openness
This study was not preregistered. All code used in this project, Global Burden of Disease (GBD) study 2019 data, link to the ITU data, and a synthetic version of the Gallup World Poll (GWP) data are available at https://doi.org/10.5281/zenodo.7004053. This study involved an analysis of existing data rather than new data collection: Our sample size was determined by the number of available years, countries, and demographics in each respective data set. This study and methods therein were approved by the University of Oxford Central University Research Ethics Committee (SSH_OII _CIA_21_084).
Method
Internet adoption
We identified the ITU’s database of information and communications technology as the most comprehensive country-level source of time-series data on Internet adoption (ITU, 2021). The ITU has collated, from 222 countries’ statistical and telecommunications agencies, the yearly percentages of population using the Internet from 2000 to 2021 and yearly per capita mobile-broadband subscriptions from 2007 to 2021. Our analyses used 4,200 yearly Internet percentages and 2,466 broadband-subscription rates.
Subjective well-being
We examined subjective well-being indicators from the GWP, a nationally representative annual survey of 1,000 civilian, noninstitutionalized individuals aged 15 years or older from 168 countries from 2005 to 2022. The surveys are conducted face-to-face or via telephone in the respondents’ native language and by local interviewers. For details on the GWP sampling and survey methodology, see Gallup (2014, 2020).
GWP measures subjective well-being with the positive- and negative-experience indices, which measure respondents’ experienced well-being on the day before the survey with five items each. For positive experiences, these items are “Did you feel well-rested yesterday?” “Were you treated with respect all day yesterday?” “Did you smile or laugh a lot yesterday?” “Did you learn or do something interesting yesterday?” and “Did you experience the following feelings during a lot of the day yesterday? How about enjoyment?” And for negative experiences, the items are responses to “Did you experience the following feelings during a lot of the day yesterday?” with prompts “How about physical pain?” “How about worry?” “How about sadness?” “How about stress?” and “How about anger?” We aggregated both scales for each respondent by taking a mean of the five items.
Life satisfaction in the moment was measured with one 11-step Likert item similar to the Cantril self-anchoring scale (Cantril, 1965; Kapteyn et al., 2015): Please imagine a ladder, with steps numbered from 0 at the bottom to 10 at the top. The top of the ladder represents the best possible life for you and the bottom of the ladder represents the worst possible life for you. On which step of the ladder would you say you personally feel you stand at this time?
For analyses, we converted these variables to percentages and aggregated the 2,434,203 individuals’ data to means and standard errors for each outcome, country, year, sex, and age (5-year age groups from 15 to 89 years) combination (60,175 cells).
Data analysis
We analyzed the data with meta-analytic Bayesian hierarchical regression models (Bürkner, 2017; Gelman & Hill, 2007; Stan Development Team, 2022). Bayesian methods are especially suitable to our research questions because they involve many potential contrasts between, for example, countries and ages. Using Bayesian hierarchical models allowed us to accurately quantify uncertainty at different levels of analyses while avoiding problems with multiple comparisons (see below).
We first asked how the well-being outcomes had changed over time. To answer, we modeled each outcome (e.g., life satisfaction) on population-level intercepts (we centered time on 2010), contrasts of time (in continuous years), sex (male = −1, female = 1), and their interaction. We allowed all coefficients to vary across countries, age groups, and the Age × Country interactions and treated all outcomes as normally distributed.
Before modeling the data, we aggregated the individual-level well-being values to means, standard deviations, and counts for each country-year-age-sex combination to facilitate the Hamiltonian Monte Carlo computations on large data and to harmonize the analyses and inferences between Studies 1 and 2. Note that because we modeled unweighted demographic- and country-level data, our units of analyses are demographic groups within countries, with no adjustment to, for example, countries’ population sizes.
Our second research question asked how changes in Internet-technology adoption predicted well-being. To answer, we expanded the above model to include within-countries centered per capita Internet users (or mobile-broadband subscriptions in a separate model) and its interaction with sex as predictors of the well-being outcome and all their associated varying effects. We also included the between-countries centered variable as a predictor to examine between-countries associations between Internet-technology adoption and well-being.
We did not make the necessary strong assumptions required for identifying causal effects and therefore highlight the descriptive nature of the resulting associations. For instance, we did not adjust for either time-invariant or -varying confounders, which could bias observed between-countries and within-countries associations, respectively. Nevertheless, we included time as a predictor to adjust for simple temporal trends. In addition, we within-countries centered the Internet-technology-adoption variables to isolate within-countries associations from between-countries associations.
More formally, we specified the model as
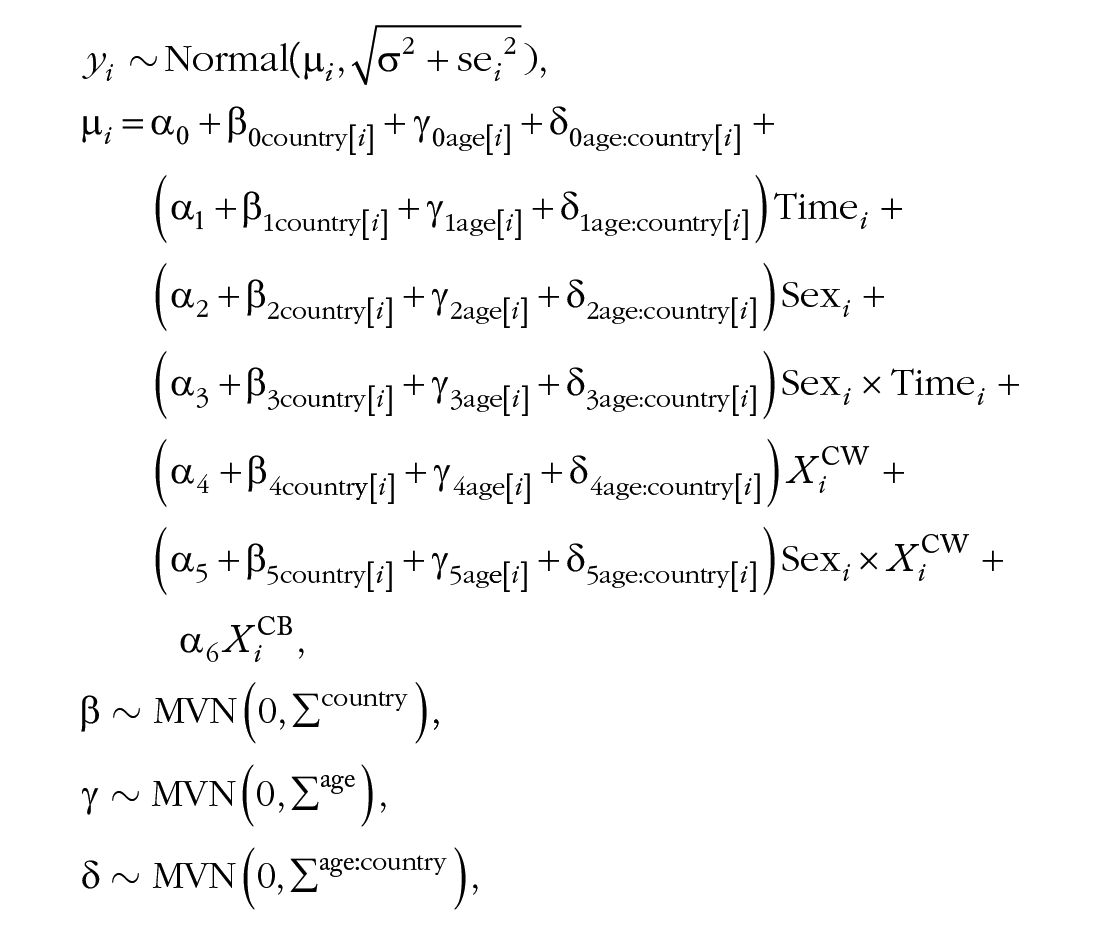
where i indexes rows in the data and are the known standard errors.

We used these priors to help model convergence on the assumption that differences in well-being between males and females are likely greater than differences associated with years, 1% increases in technology-adoption predictors, or the interaction terms.
Our third research question asked whether any trends in well-being or its associations with Internet or mobile-broadband adoption were specific to adolescents or other demographic groups. To answer, the model allowed all parameters to vary randomly across the age groups and the Age × Country interaction. Therefore, each age group, on average and within each country, received its own partially pooled estimates (Gelman & Hill, 2007). This Bayesian approach to estimating age-specific associations is beneficial given that the large number of age groups, especially within countries, would otherwise present difficulties with uncertain estimates and multiple comparisons. In addition, Bayesian methods allowed quantifying uncertainties at different levels of analysis rather than providing, for example, only point estimates of country-specific quantities. Therefore, we could compare younger age groups with older age groups and investigate other contrasts with confidence and without additional post hoc adjustment procedures (Gelman et al., 2012).
We conducted all data analyses with R (R Core Team, 2022) and estimated the models using Stan’s Hamiltonian Monte Carlo sampling via the brms R package (Bürkner, 2017; Stan Development Team, 2022).
Our main descriptive focus was on raw regression coefficients, which indicate contrasts in the outcomes on the percentage scale (Cohen et al., 1999) as a function of 1 unit (year or percent) increase in the predictor. We report these parameters’ 95% credibility intervals (CIs) and posterior probabilities of direction
In addition, on a reviewer’s request, we report standardized coefficients to describe the magnitudes in an alternative context. These standardized coefficients indicate contrasts in the z-scored outcomes (life satisfaction: SD = 14.0; negative experiences: SD = 13.4; positive experiences: SD = 13.3) as a function of the average year-on-year changes in Internet (2.8%) or mobile-broadband (6.2%) adoption. To determine the practical significance of the standardized associations, we report posterior probabilities that their magnitudes exceed the region of practical equivalence (ROPE) to zero (
Results
Figure 1a describes the levels of Internet and mobile-broadband adoption and the three well-being variables over time averaged over sex and age. Figure 1a shows the universal global penetration of Internet technologies in the past 2 decades and suggests that in contrast, changes in well-being are likely to be small.
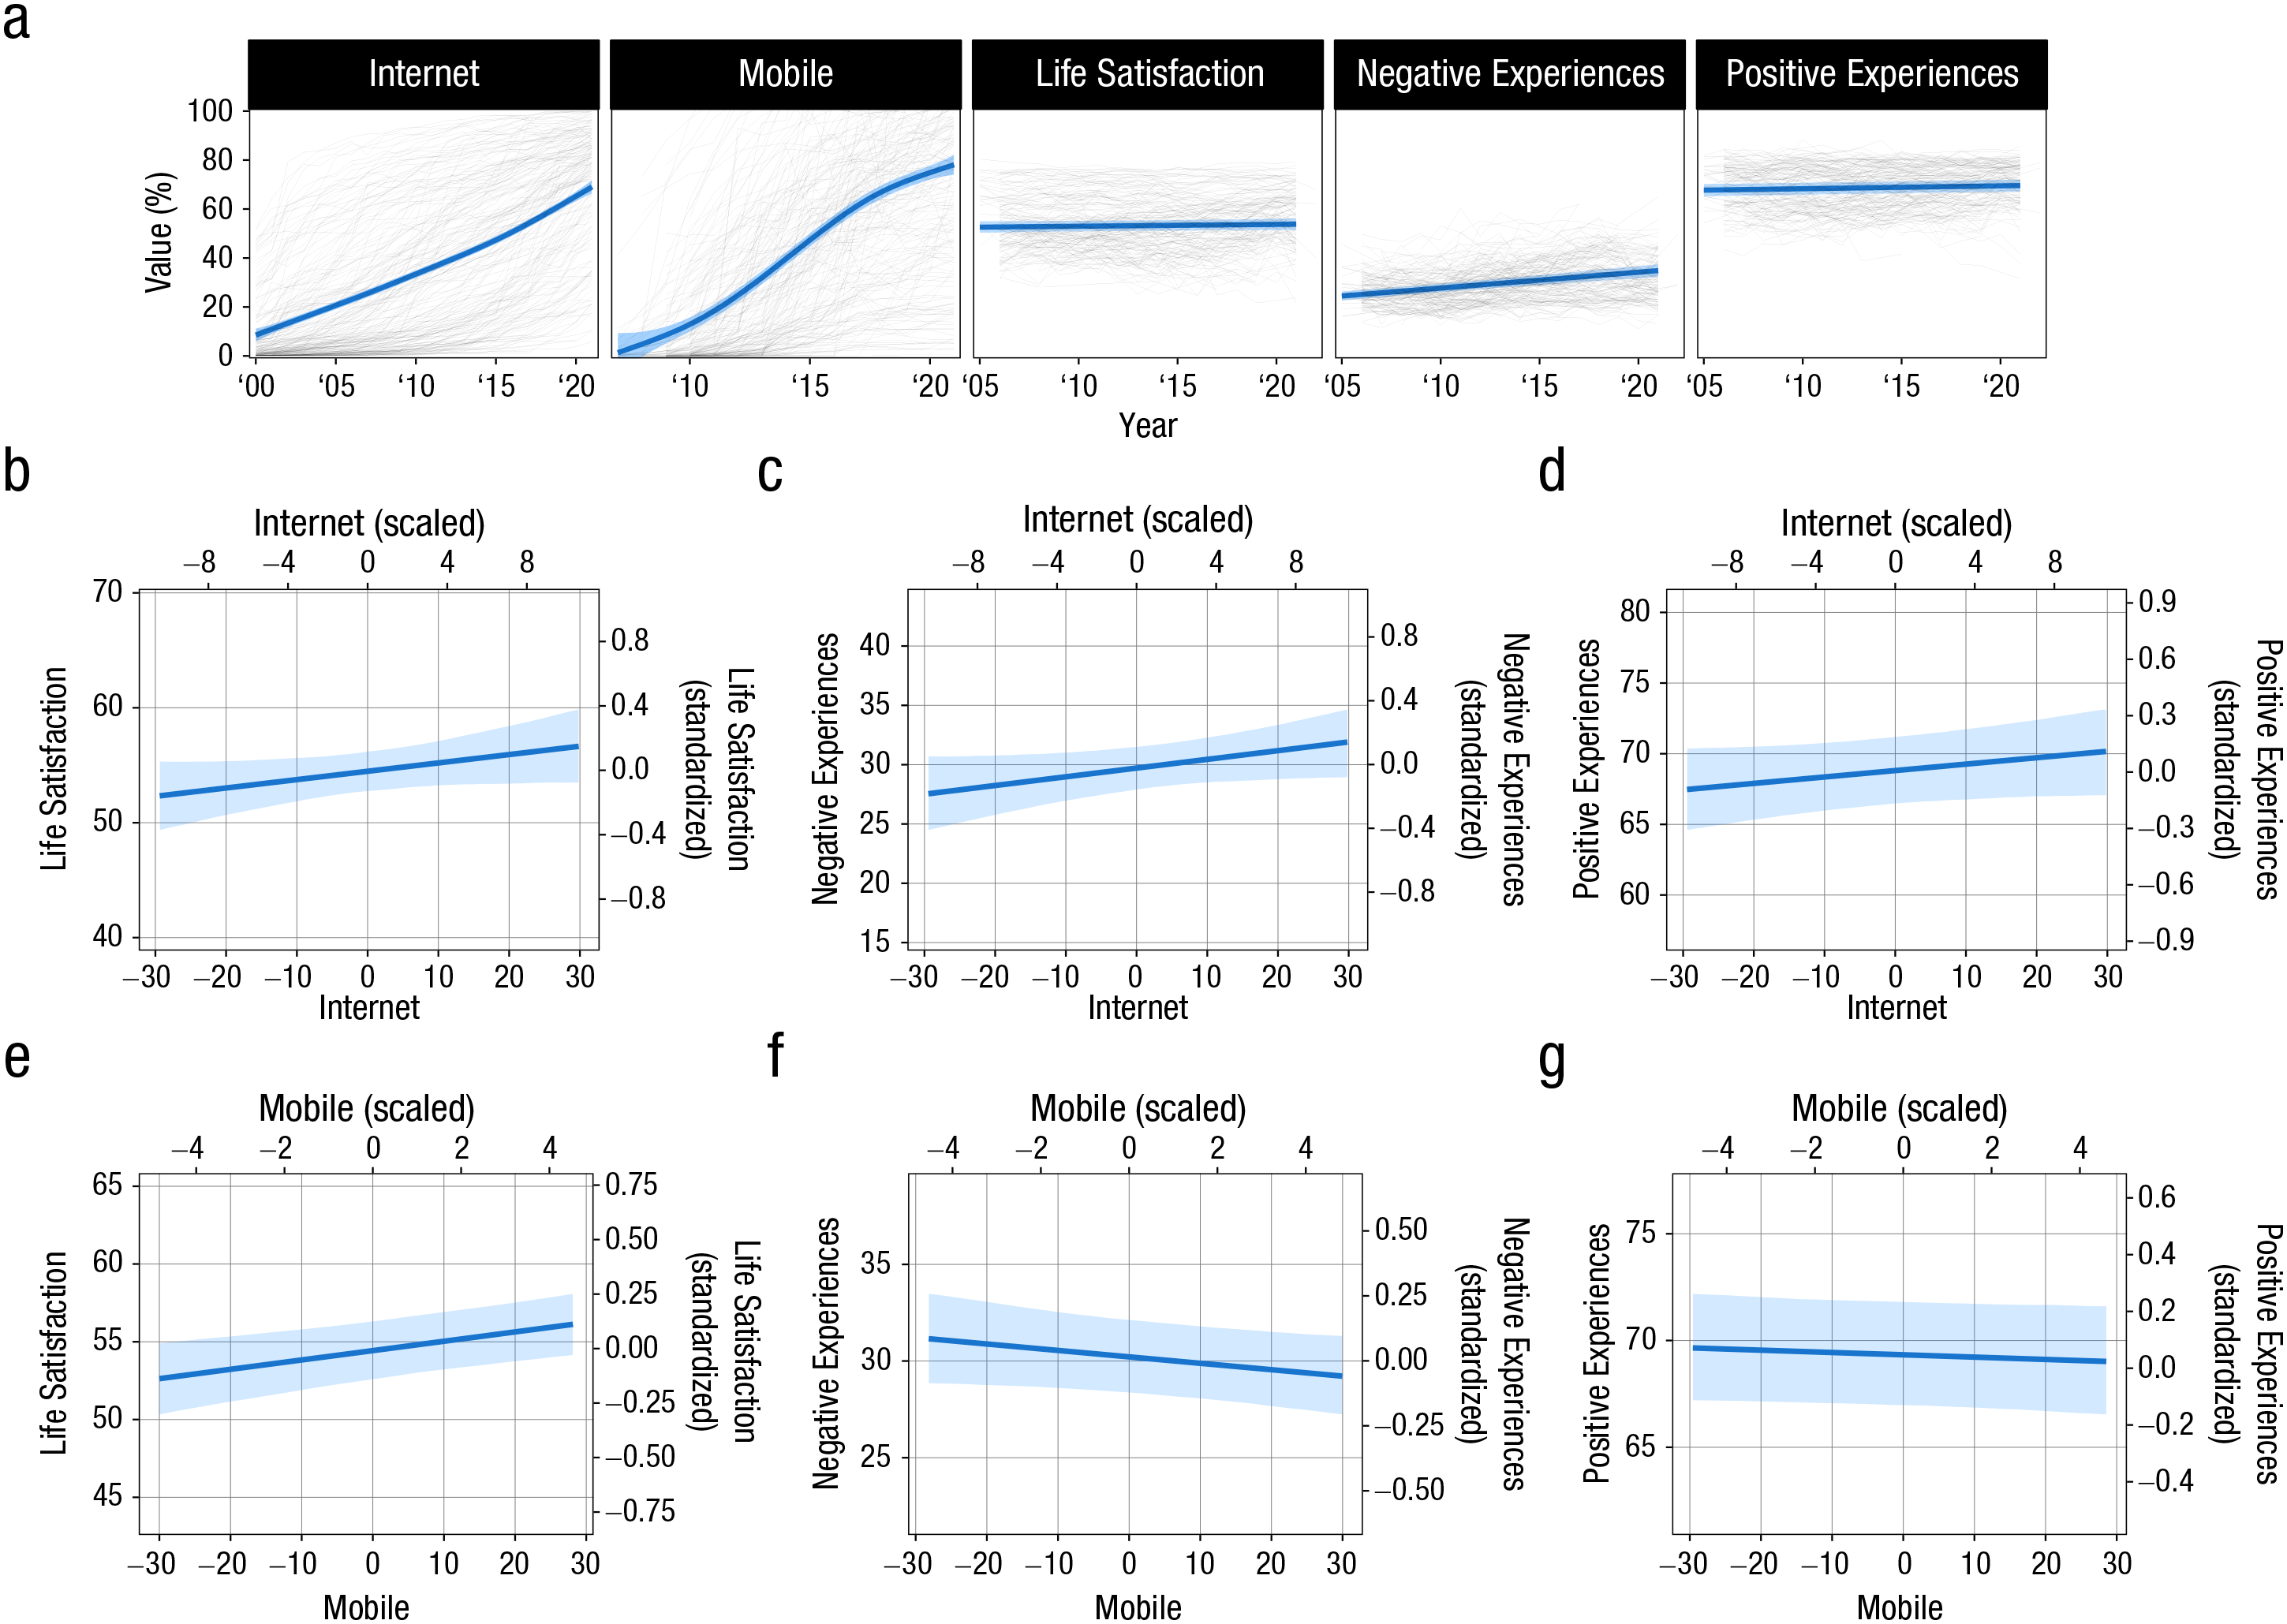
(a) Time courses of per capita Internet users, mobile-broadband subscriptions, and three psychological well-being outcomes. Thin dark lines indicate countries’ yearly means, aggregated across sex and age. Blue lines and ribbons indicate model-implied regression lines (exploratory generalized additive model fits for Internet and mobile-broadband adoption). (b–d) Estimated conditional means of three well-being metrics on within-countries centered per capita Internet users. Primary x- (bottom) and y-axes (left) display raw predictor and outcome values, and secondary axes (top, right) display z-scored outcomes and average year-on-year scaled within-countries Internet adoption. (e–g) Same as (b–d) but for mobile-broadband adoption.
Trends
We found that for the average country, life satisfaction had remained relatively stable, whereas both negative and positive experiences had increased (Table 1; blue lines and ribbons in Fig. 1a). The increase in negative experiences (second row in Table 1) was approximately fivefold to that in positive experiences. However, simple sign tests do not inform about the practical significance of magnitudes of changes. On the standardized scale, the coefficients were small (standardized estimate in Table 1) and in all cases, practically equivalent to zero with very high confidence. Because these trends were mixed across outcomes and practically equivalent to zero in all cases, these results do not offer convincing evidence for consistent or meaningfully large global changes in well-being during this period of global Internet-technology adoption, as would be expected—all else being equal—if the latter had broad negative consequences.
Well-Being: Population-Level Estimates
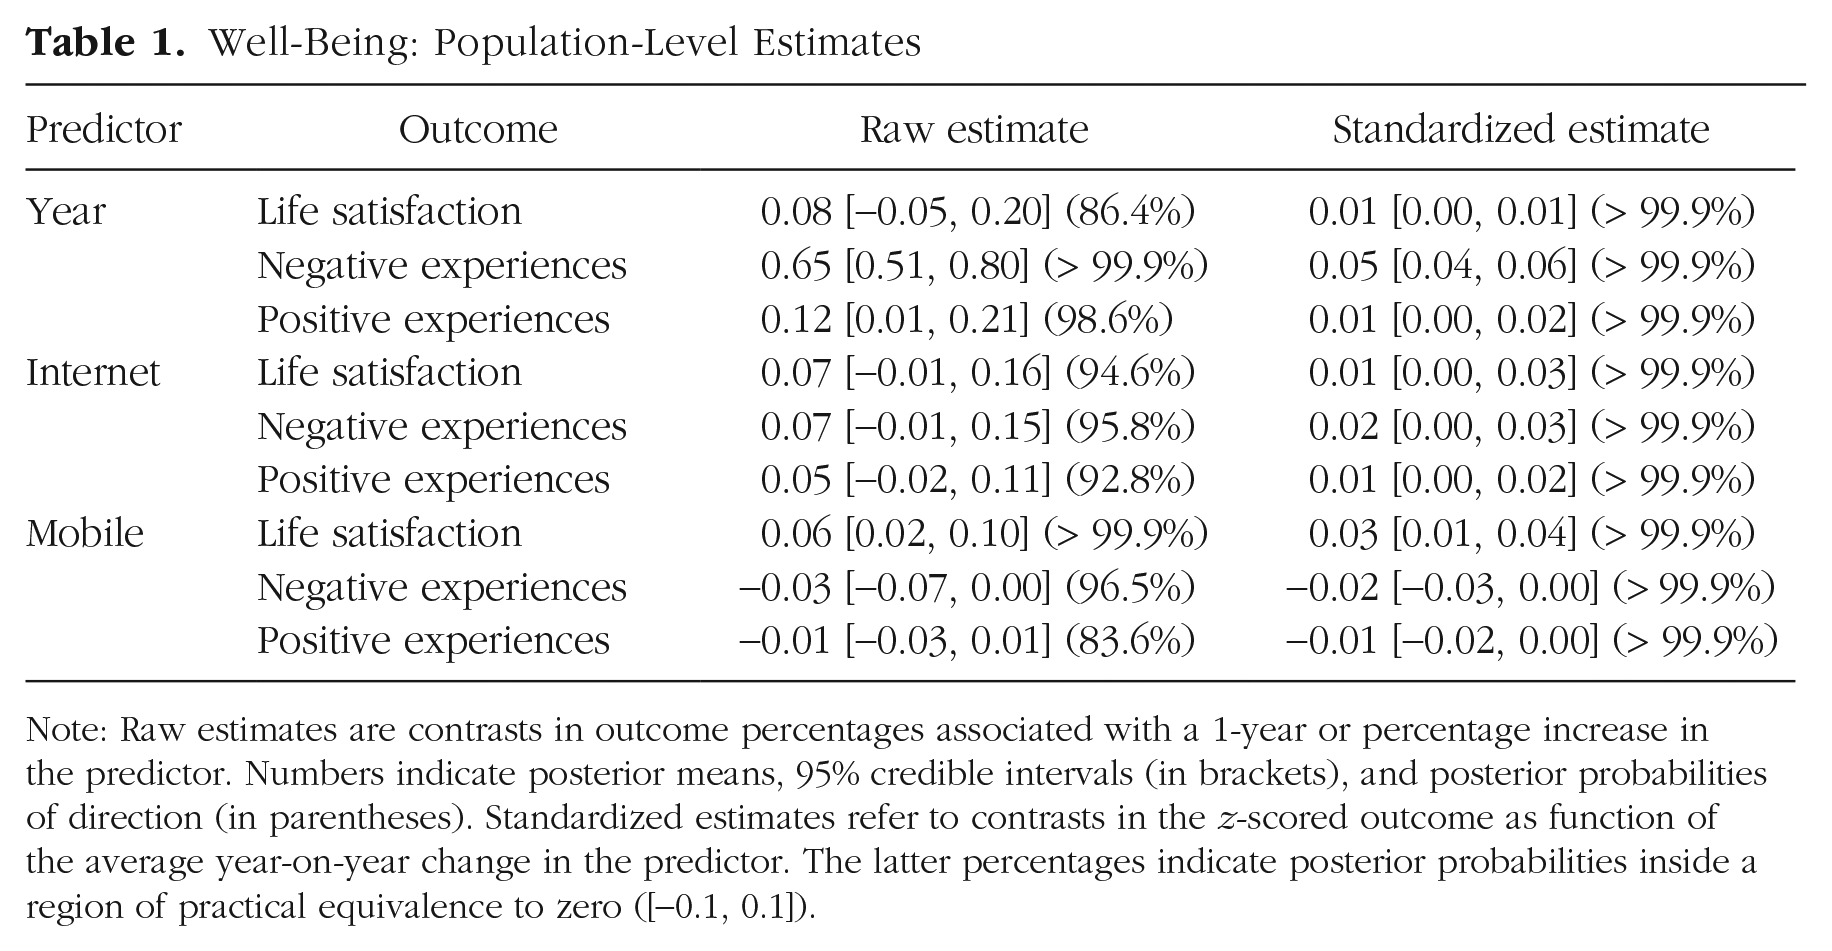
Note: Raw estimates are contrasts in outcome percentages associated with a 1-year or percentage increase in the predictor. Numbers indicate posterior means, 95% credible intervals (in brackets), and posterior probabilities of direction (in parentheses). Standardized estimates refer to contrasts in the z-scored outcome as function of the average year-on-year change in the predictor. The latter percentages indicate posterior probabilities inside a region of practical equivalence to zero ([−0.1, 0.1]).
Average associations
We then turned to our main question: understanding to what extent Internet-technology adoption predicted changes in well-being. We expanded the model of temporal changes to also predict well-being from within- and between-countries-centered per capita Internet users or mobile-broadband subscriptions (Table 1). The raw coefficients describe the extent to which a 1% increase in within-countries-centered per capita Internet users (or mobile-broadband subscriptions) predict that country’s well-being, adjusting for linear temporal trends. The standardized estimates describe the same quantities, but in terms of contrasts in the z-scored outcomes and average year-on-year percentage changes in the outcomes.
Per capita Internet users did not credibly predict any of the three well-being metrics: A 1% increase in per capita Internet users predicted small increases in life satisfaction (Fig. 1b), negative experiences (Fig. 1c), and positive experiences (Fig. 1d) for the average country, but the probabilities of direction (
In addition, (within-country centered) per capita mobile-broadband subscriptions were at best weak predictors of well-being. Although per capita mobile-broadband subscriptions predicted life satisfaction positively (0.06%,
In sum, we found that Internet-technology adoption did not predict life satisfaction or negative or positive experiences to a meaningfully large degree.
Countries
Our model also assessed the extent to which Internet-technology adoption predicted well-being between countries. These between-countries associations indicated, with high confidence, that countries with greater average levels of Internet and mobile-broadband adoption tended to report greater average levels of life satisfaction and positive experiences and lower average levels of negative experiences (Table 3 in Appendix 1). However, based on standardized magnitudes and ROPE tests, only the positive association between mobile-broadband adoption and life satisfaction was credibly different from zero with more than 90% confidence. Other between-countries associations were equivalent to zero on the standardized scale. To be clear, between-countries associations are likely to reflect multiple other causes, such as socioeconomic factors and levels of inequality, impinging on both well-being and Internet-technology adoption. For example, although wealthier nations are likely to have greater Internet coverage, they also tend to have greater health-care coverage, which, in turn, is likely to affect levels of well-being.
Although these trends and associations are meaningful summaries of the average country among the 168 examined or associations between them, they do not represent specific countries that might have unique patterns of associations. Figure 2 describes the country-level trends over time (top row) and associations linking per capita Internet users (middle row) and mobile-broadband subscriptions (bottom row) to each of the three outcomes (columns). We observed that all three were highly variable across countries.
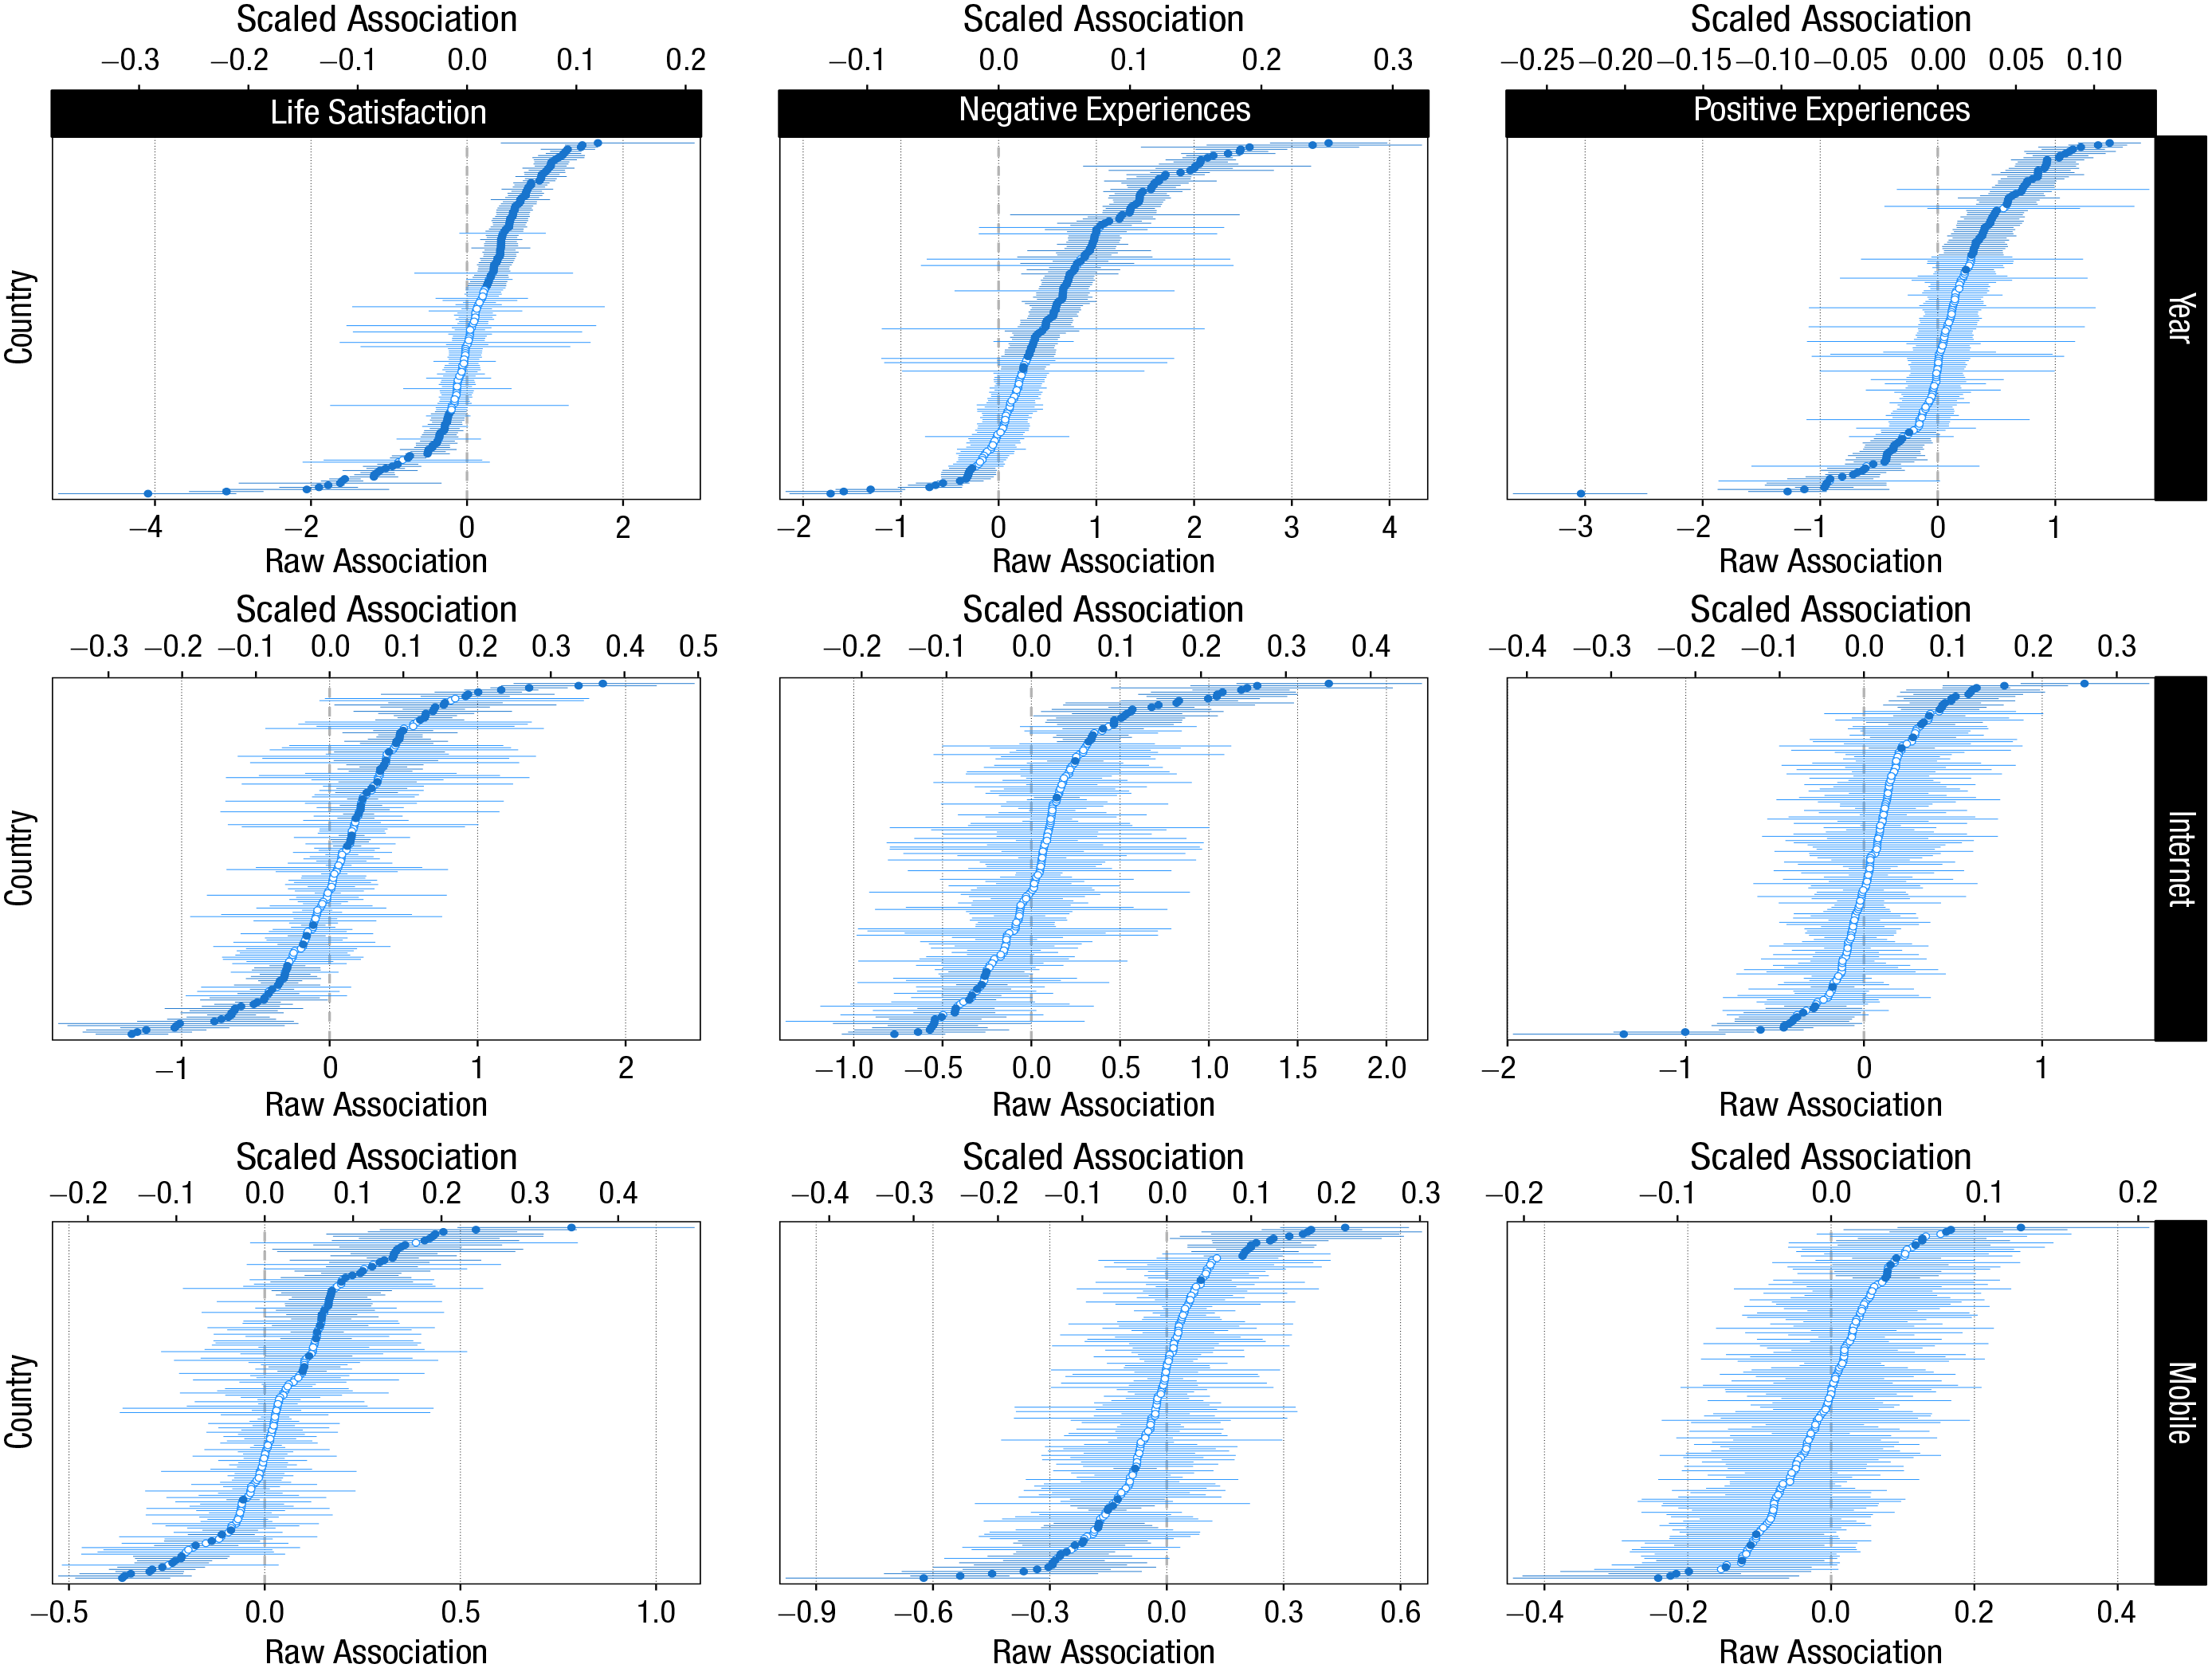
Country-specific yearly changes in (top row) three well-being outcomes and their associations with (second row) per capita Internet users and (third row) mobile-broadband subscriptions. Points and lines indicate individual countries’ posterior means and 95% credibility intervals. Countries are sorted from the most negative to most positive estimate. Filled points indicate that the parameter’s 95% credibility interval excludes zero (in both panels). Raw associations (bottom x-axes) indicate changes in the outcome percentage as function of percentage (or 1 year) change in the predictor. Scaled associations (top x-axes) indicate changes in standardized outcome as function of the average year-on-year change in the predictor.
First, there appeared to be no universal temporal trend that applied to all countries. Instead, the country-specific estimates varied from substantial decreases (greatest decrease in, e.g., life satisfaction: –4.09, 95% CI = [−5.24, –2.96],
To summarize these country-specific associations, we calculated proportions of countries with credibly positive, negative, null, and inconclusive associations based on either simple sign tests on the raw scale (
This heterogeneity and lack of consistent associations across countries should qualify any inferences concerning associations for the average country and is further evidence against the idea that the adoption of Internet or mobile broadband has had uniform global negative effects on well-being.
Demographics
These global and country-specific analyses are informative but shed no light on how Internet and mobile-broadband adoption might be differently associated with well-being across demographic groups. So we then examined variation across age and sex (for the average country) in the relations linking Internet and mobile-broadband adoption to psychological well-being. Age- and sex-specific estimates, for the average country, are shown in Figure 3.
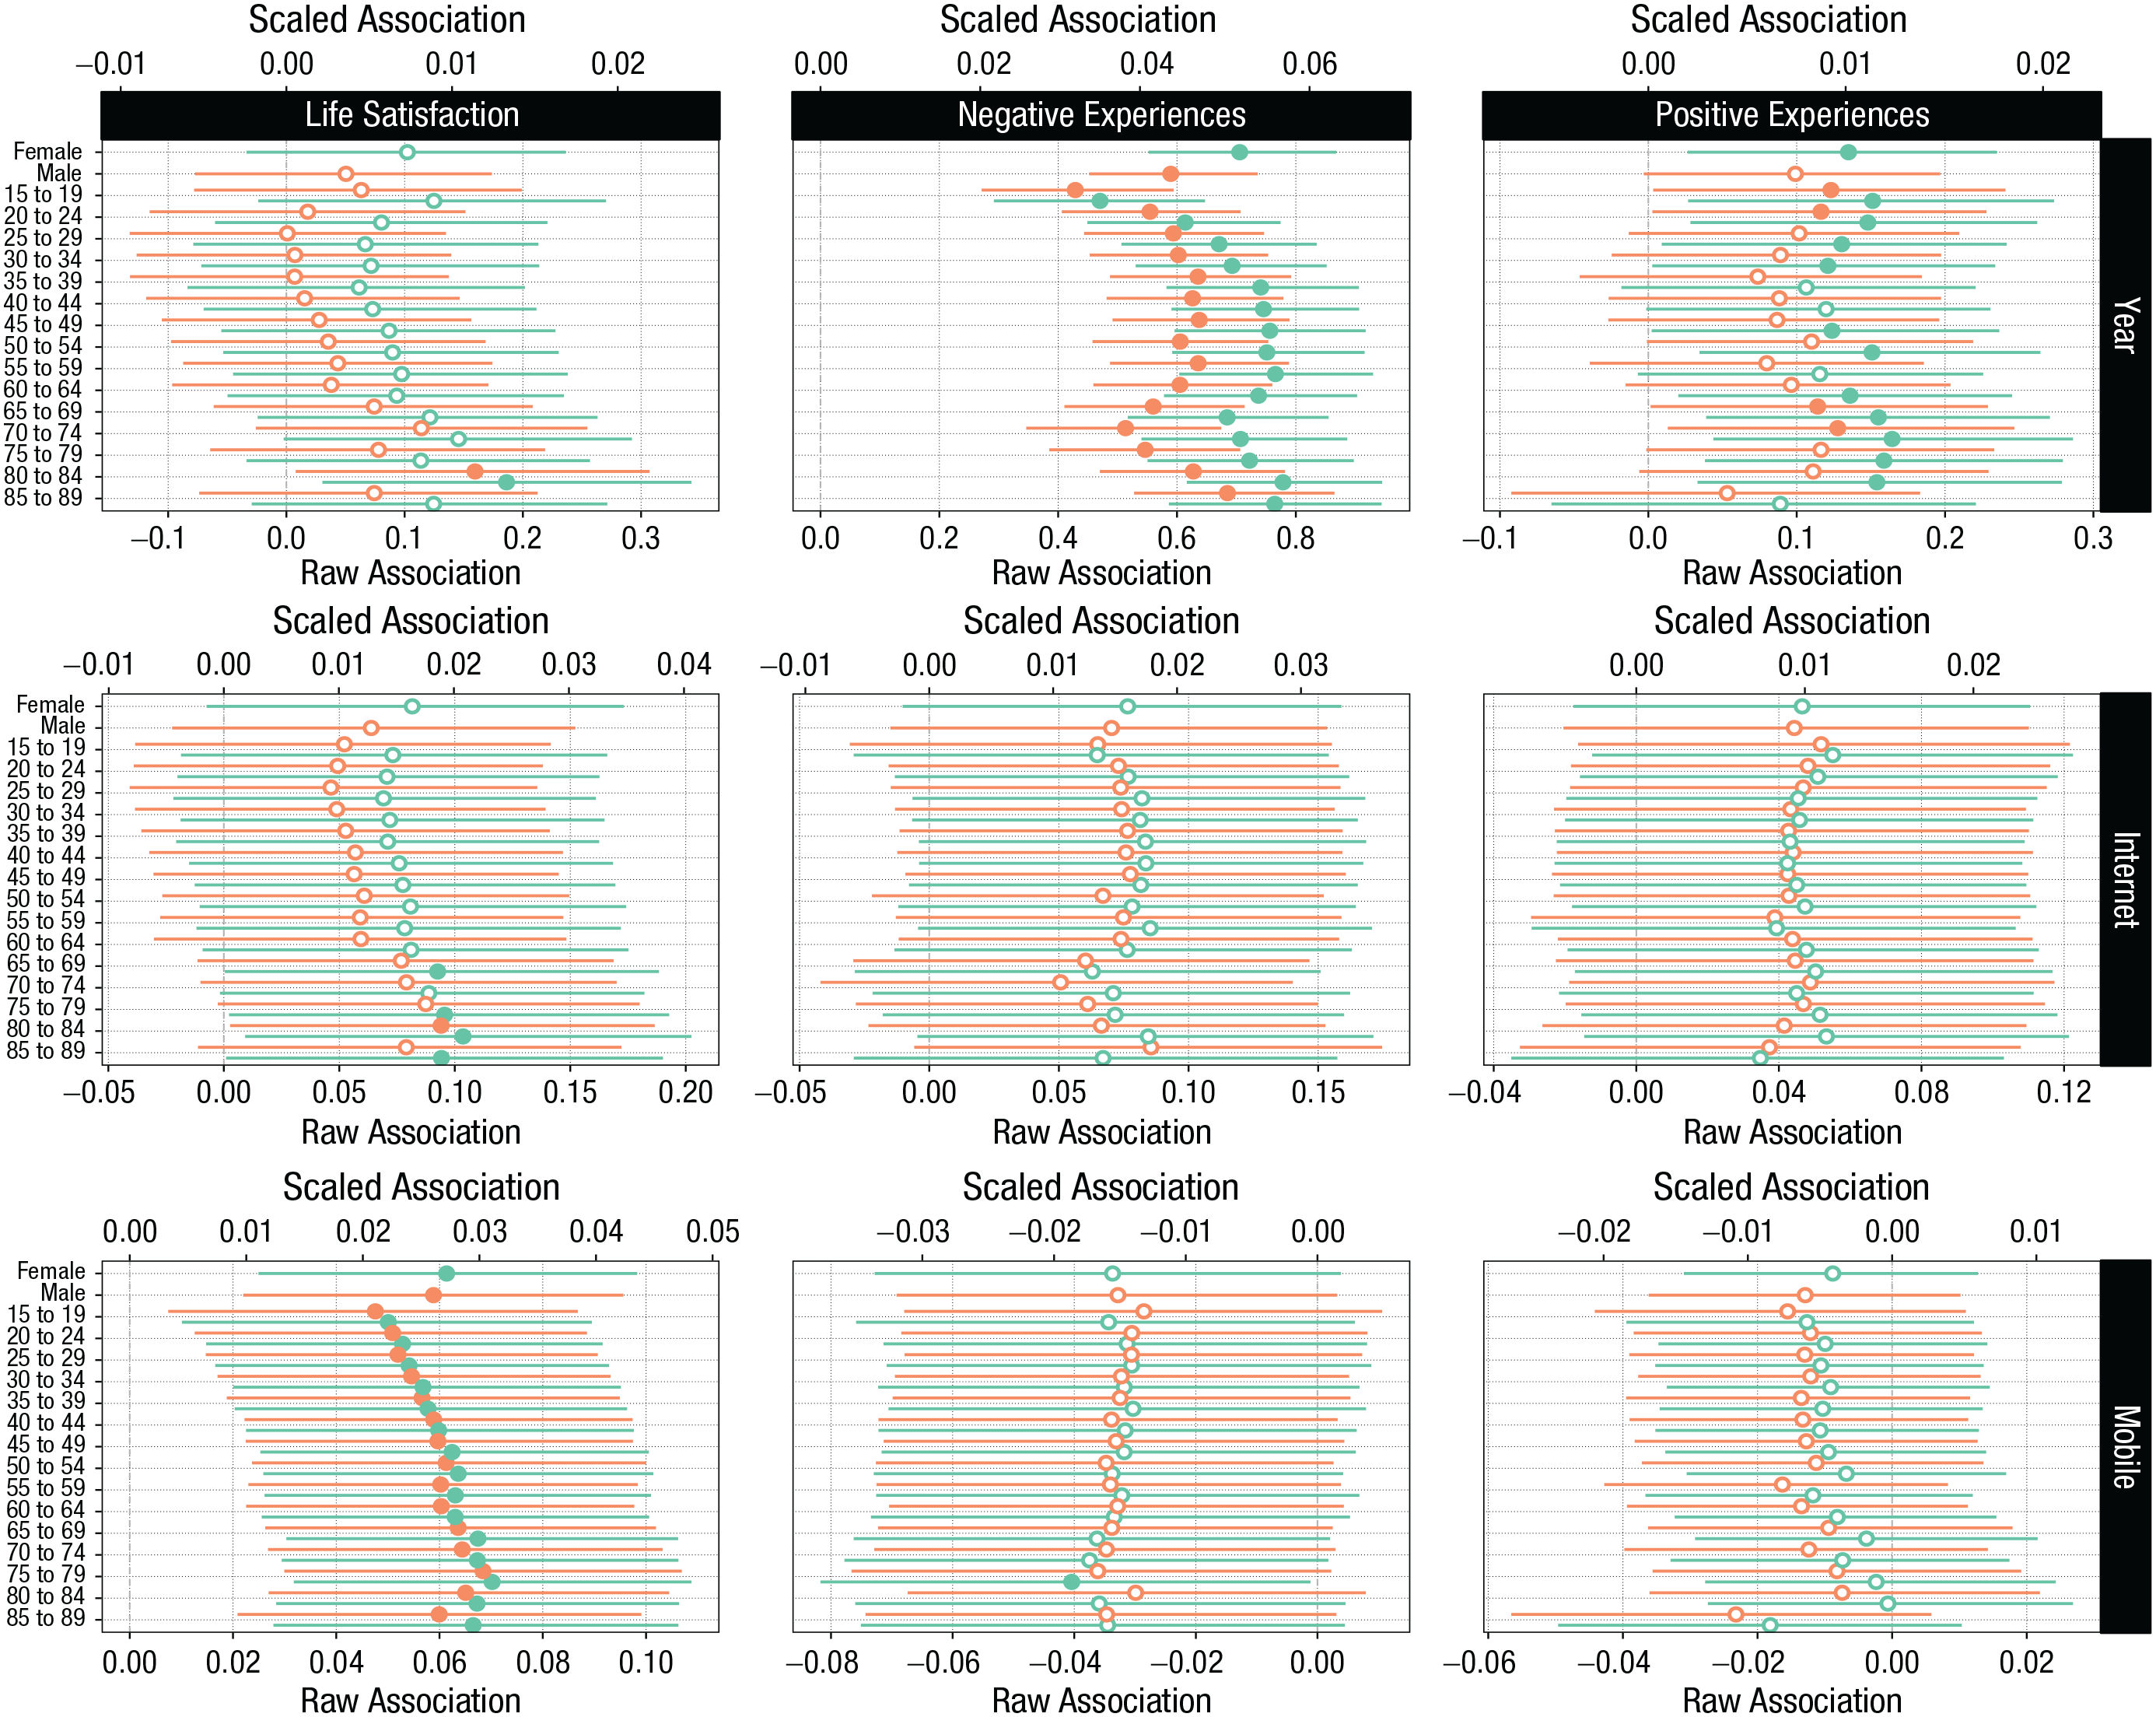
Age- and sex-specific (green: female; red: male) changes in (top row) three well-being outcomes and their associations with (middle row) per capita Internet users and (bottom row) mobile-broadband subscriptions. Bottom x-axes indicate raw associations; top x-axes are scaled associations.
We found that for the average country, life satisfaction had increased more for females (0.05, 95% CI = [0.01, 0.10],
There were no further differences in associations linking well-being and (mobile) broadband adoption between men and women when evaluated either with sign tests (Table 5 in Appendix 1, raw estimate) or equivalence tests against [−0.1, 0.1] (Table 5 in Appendix 1, standardized estimate). Overall, these demography-specific trends and associations indicated no clear patterns specific to a particular demographic group. Neither did they support the commonly offered narrative that young individuals, particularly young women, have experienced disproportionately large decrements in well-being in association with the adoption of Internet technologies.
Discussion
We examined the extent to which three indicators of psychological well-being had changed over time and in association with per capita Internet users and mobile-broadband subscriptions. Across 168 countries and 16 years, we found little to no support for changes in well-being over time and in association with Internet-technology adoption. Although we found that both negative and positive experiences had increased, based on simple sign tests, these changes were small enough to be credibly practically equivalent to zero when evaluated against a smallest association magnitude of 0.1 on the standardized scale.
Moreover, although mobile-broadband adoption did positively predict life satisfaction, when evaluated against ROPE on a standardized scale, this association, like all others, was credibly equivalent to zero.
We then examined variation in trends and associations across countries: Variability in sign and magnitude was large, suggesting no consistent connection between Internet-technology adoption and country-level well-being. Finally, our analysis of differences across demographic groups did not support the idea that young individuals or young women particularly were the most at-risk group. Nevertheless, this analysis was necessarily constrained to a limited range of available outcomes reflecting subjective well-being (e.g., Jebb et al., 2020). In Study 2, we extended our investigation to mental-health outcomes.
Study 2: Mental Health
In the second study, we extended our investigation to focus on mental health using meta-analytic rates of anxiety, depression, and self-harm from 2000 to 2019 among 202 countries and their associations with Internet-technology adoption, in place of self-reported measures of psychological well-being.
Method
Mental-health outcomes
We studied meta-analytic prevalence rates (per 100,000 individuals) of anxiety disorders (ICD10 F40–F44.9, F93–F93.2), depressive disorders (ICD10 F32–F33.9, F34.1), and self-harm (ICD10 X60–X64.9, X66–X84.9, Y87.0) in 204 countries from 2000 to 2019 as estimated by the Institute for Health Metrics and Evaluation’s (IHME) GBD 2019 study (James et al., 2018; Vos et al., 2020). The GBD collates heterogeneous data from all World Health Organization member states’ censuses, household surveys, civil registration and vital statistics, disease registries, health-service-use statistics, disease notifications, and other sources. It then aggregates data from these sources with Bayesian metaregression to produce country-specific yearly prevalence estimates.
The GBD 2019 prevalence-rate estimates are based on 19,773 data sources with varying coverage for individual countries; for details of the GBD 2019 methodology, see Vos et al. (2020) and especially Appendix 1 therein. The prevalence rates are estimated for females and males in 5-year age groups and are provided as the IHME metaregression model’s predicted rates and 95% CIs; we converted the latter to approximate standard errors for our meta-analytic modeling strategy (see Study 1, Method).
We emphasize that the GBD estimates are not observed data and therefore are accurate only to the extent that the GBD’s data-collection methods and modeling strategies are valid. We compared the GBD estimates with the Centers for Disease Control and Prevention’s (2022) estimates of self-harm in the United States and found that they are likely to deviate in systematic ways from other authoritative information sources. We nevertheless argue that because the GBD provides the most comprehensive data set of global mental health, studying these estimates is informative but emphasize this caveat. The sample size for our analyses (combinations of country, year, sex, and age) was 130,560.
Data analysis
Before analyses, we converted the GBD meta-analytic rates (per 100,000 population) to percentages, for consistency with Study 1. Otherwise, we analyzed the data in the same manner as in Study 1 but did not include varying parameters over the Age × Country interaction because the models did not converge because of invariance in the data. As above, we report coefficients on the raw scale, with 95% CIs and
Results
Trends
Because Study 2 concerned the GBD’s meta-analytic estimates of mental-health rates, we observed less variation in the variables over time than was the case with the well-being outcomes in Study 1 (Fig. 4a). Our results showed that rates of anxiety had increased (0.0065, 95% CI = [0.0046, 0.0084],
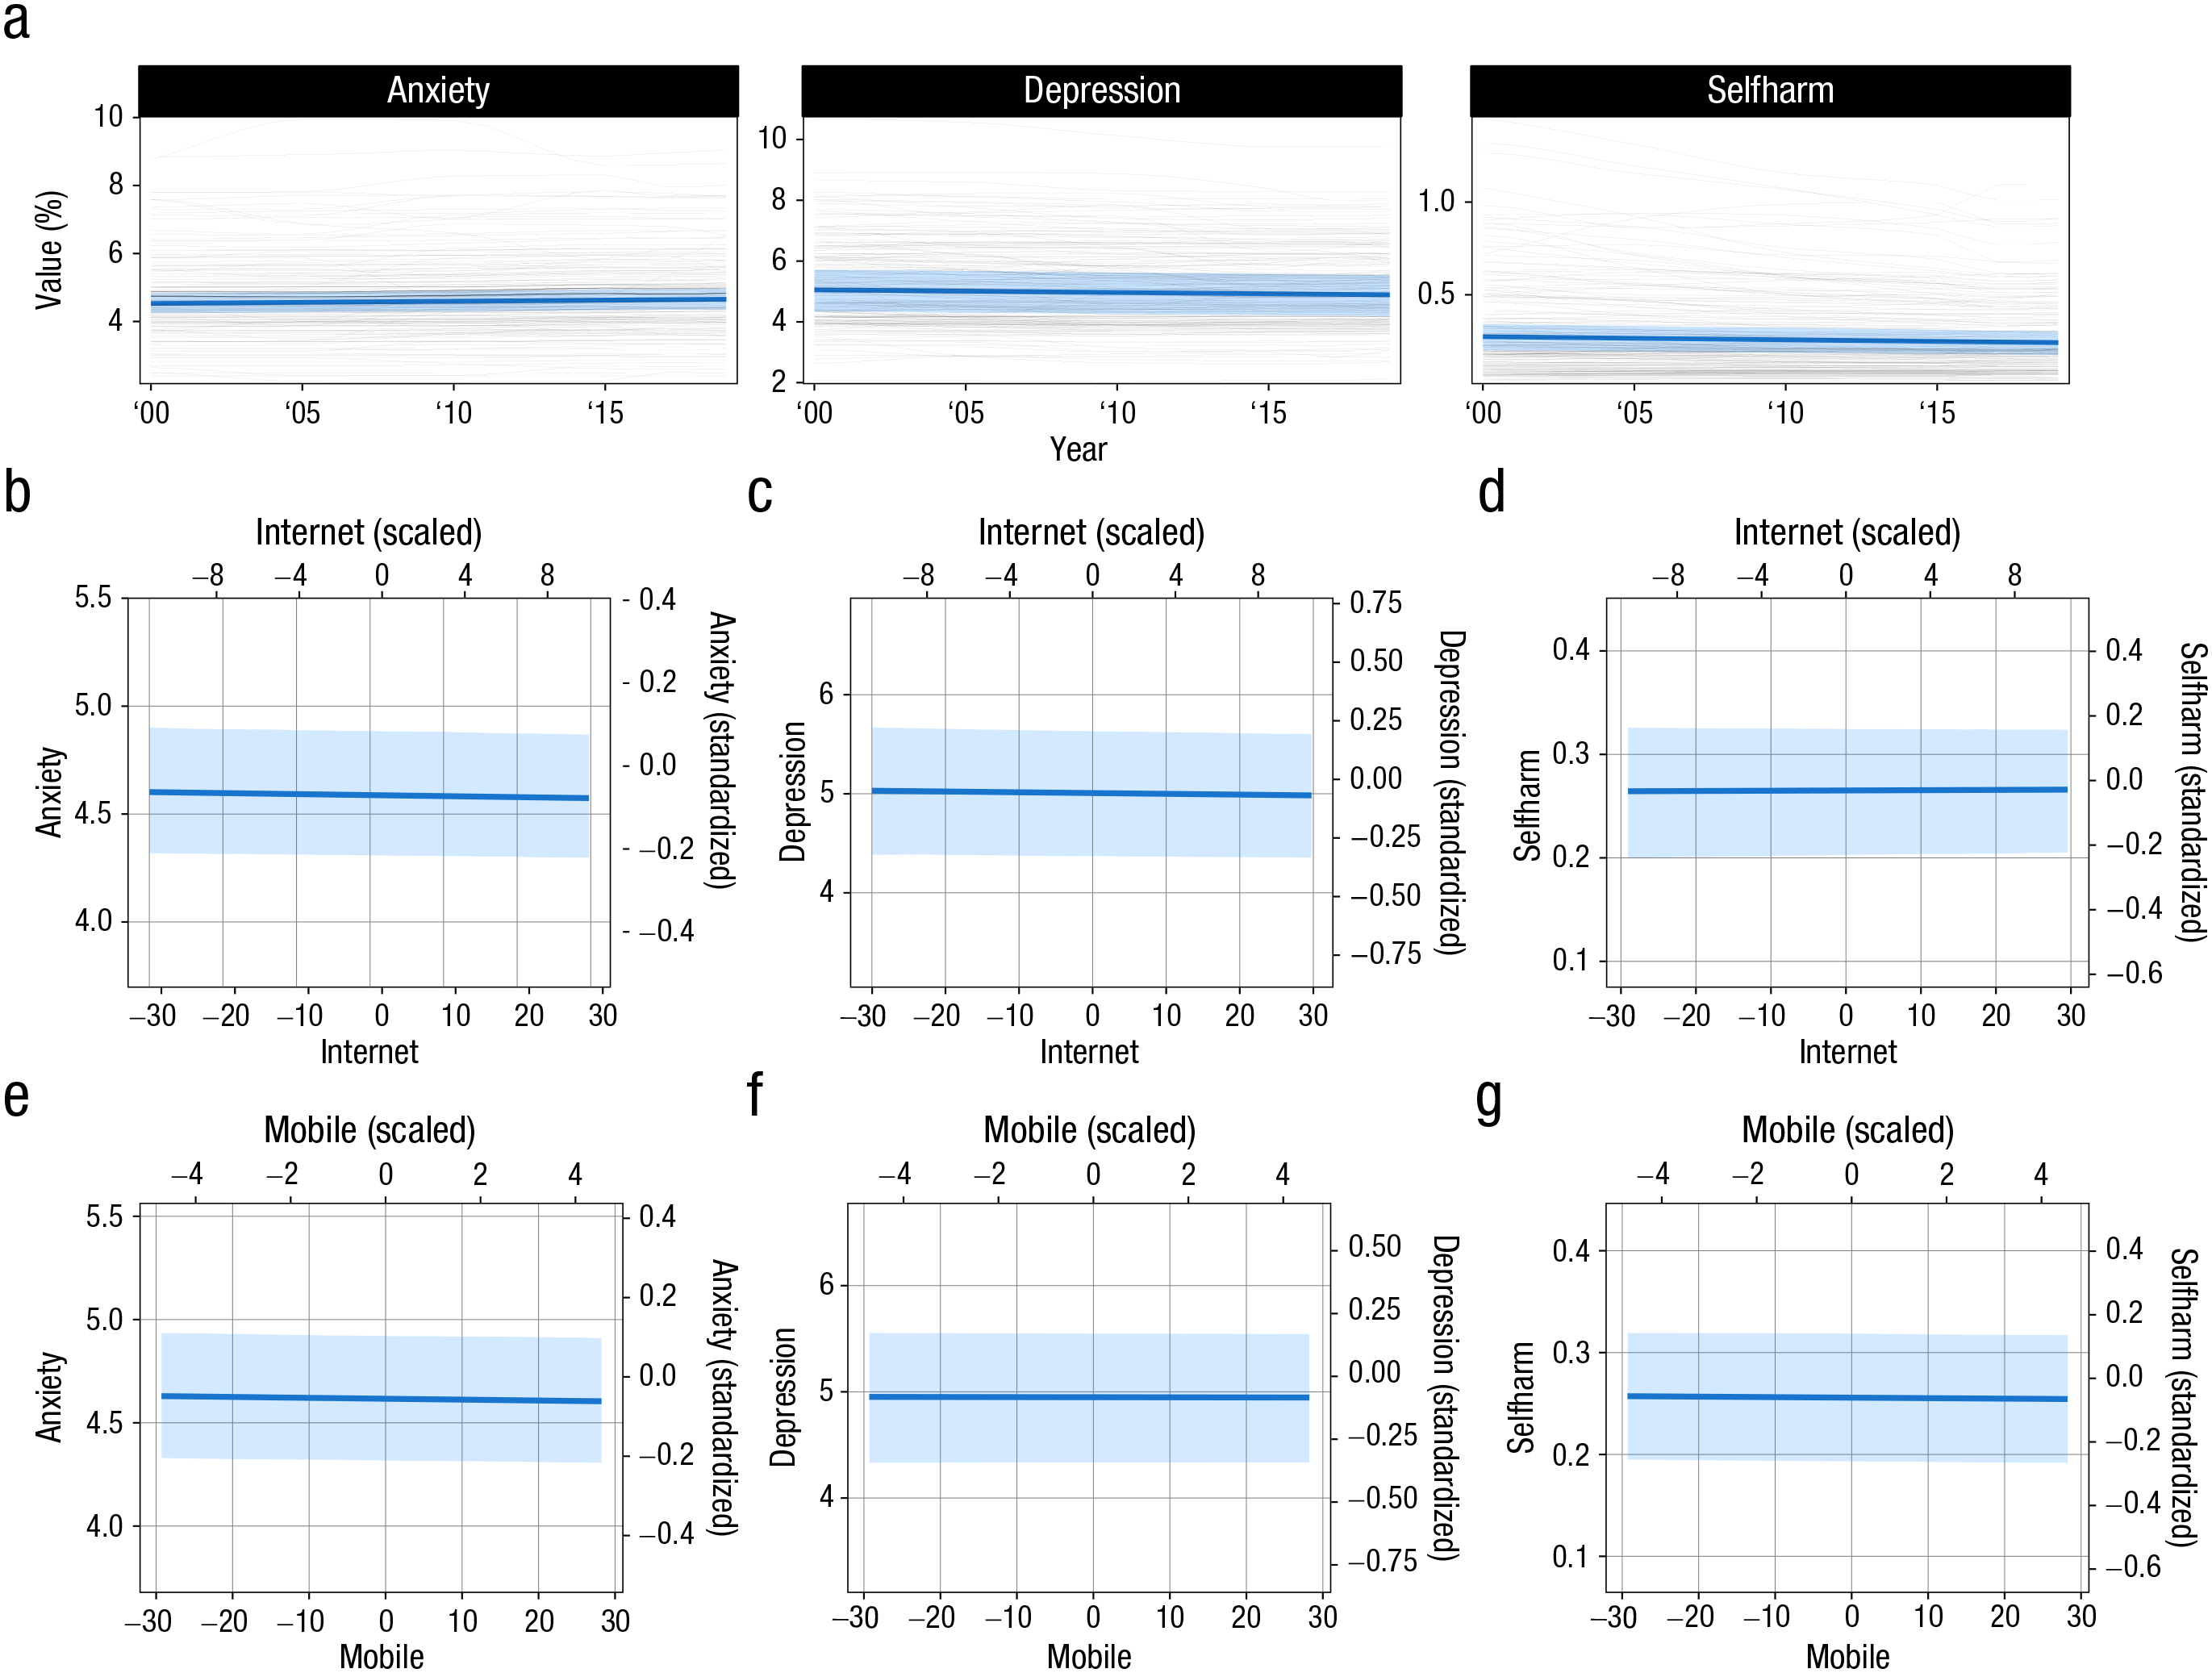
(a) Time courses of three mental-health outcomes. Thin dark lines indicate countries’ yearly means, aggregated across sex and age. Blue lines and ribbons indicate model-implied regression lines. (b–d) Estimated conditional means of three mental-health metrics on within-countries-centered per capita Internet users. Primary x- (bottom) and y-axes (left) display raw predictor and outcome values. Secondary axes (top, right) display z-scored outcomes and average year-on-year scaled within-countries Internet adoption. (e–g) Same as (b–d) but for mobile-broadband adoption.
Mental Health: Population-Level Estimates
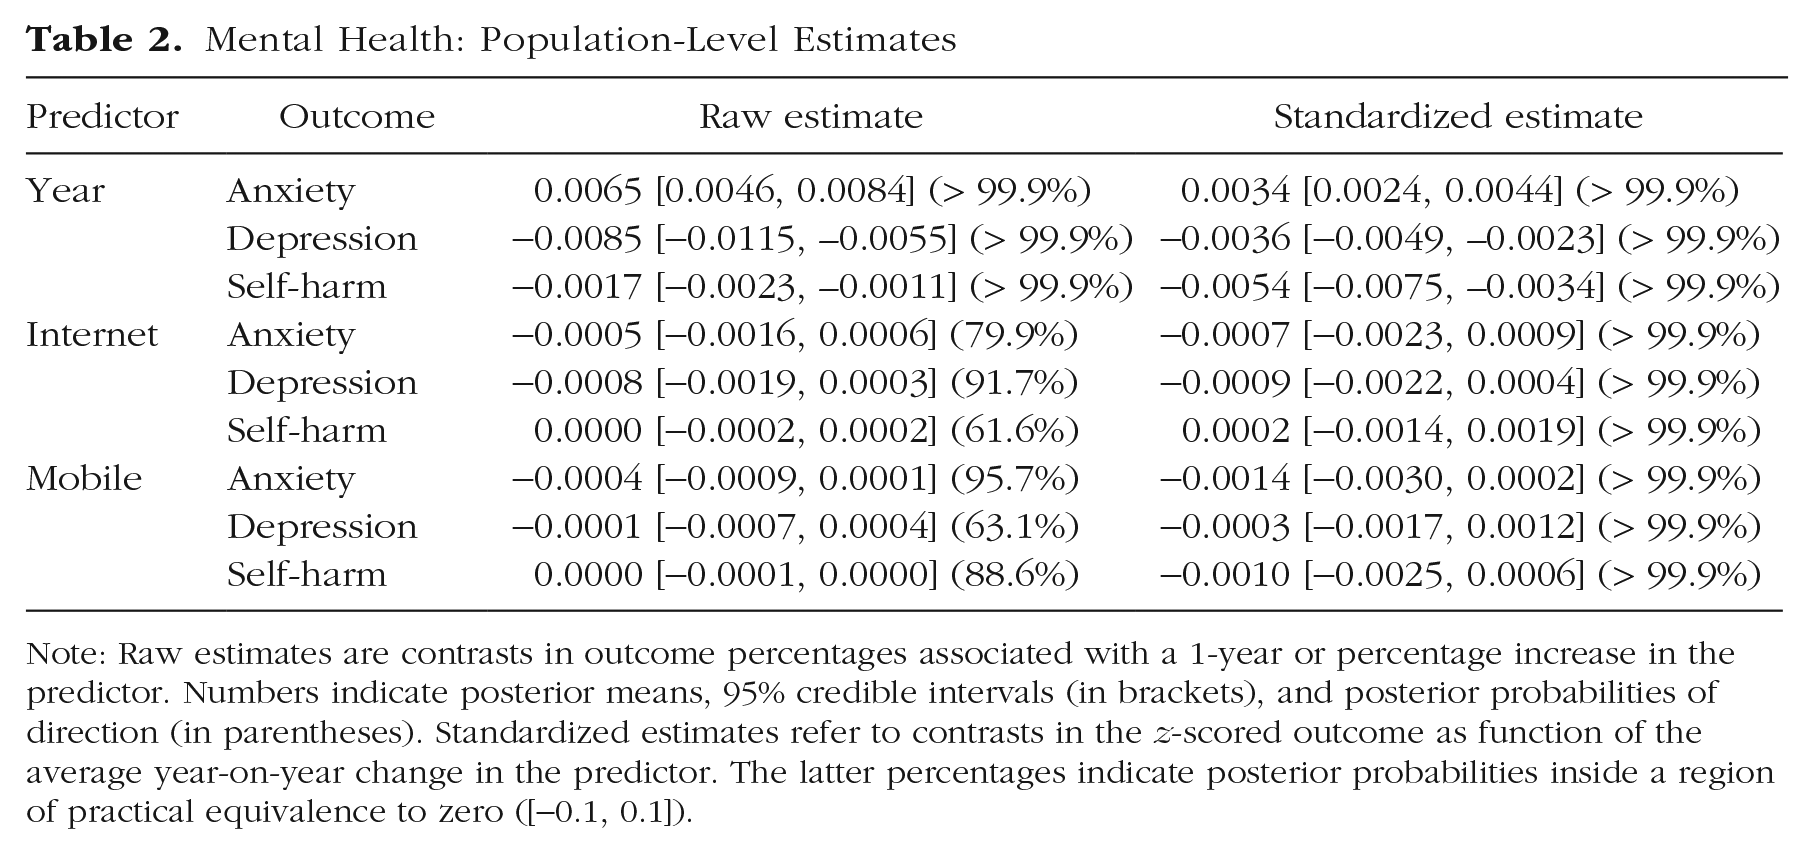
Note: Raw estimates are contrasts in outcome percentages associated with a 1-year or percentage increase in the predictor. Numbers indicate posterior means, 95% credible intervals (in brackets), and posterior probabilities of direction (in parentheses). Standardized estimates refer to contrasts in the z-scored outcome as function of the average year-on-year change in the predictor. The latter percentages indicate posterior probabilities inside a region of practical equivalence to zero ([−0.1, 0.1]).
Average associations
Then, to answer our primary research question, we examined the within-countries associations between Internet-technology adoption and mental health. We observed no credible (at the 95% level) associations between Internet adoption and either anxiety, depression, or self-harm (Fig. 4b), evaluated either against a point null on the raw scale (anxiety: –0.0005, 95% CI = [−0.0016, 0.0006],
We also examined the between-countries associations linking Internet-technology adoption with mental health. Countries with greater levels of per capita Internet users, on average, tended to be those with lower levels of depression and higher levels of self-harm (Fig. 4b, between-countries estimates). Likewise, per capita mobile-broadband subscriptions predicted lower rates of both anxiety and depression but higher rates of self-harm. However, all of these between-countries associations were within the region of practical equivalence to zero with very high confidence (> 99.9%).
Countries
We then examined the heterogeneity in the associations between countries. Although there were considerable differences in changes in anxiety, depression, and self-harm between countries, the associations varied less (Fig. 5). To summarize these country-level trends and associations, we calculated proportions of countries with negative, positive, null, and indecisive results based on both sign tests and ROPE tests, as in Study 1 (Table 7 in Appendix 1). First, we found that the vast majority of country-specific trends and associations were indecisive when evaluated against a point null hypothesis (Table 7 in Appendix 1). Moreover, when evaluated against a ROPE of [−0.1, 0.1], all country-level coefficients were credibly equivalent to zero.
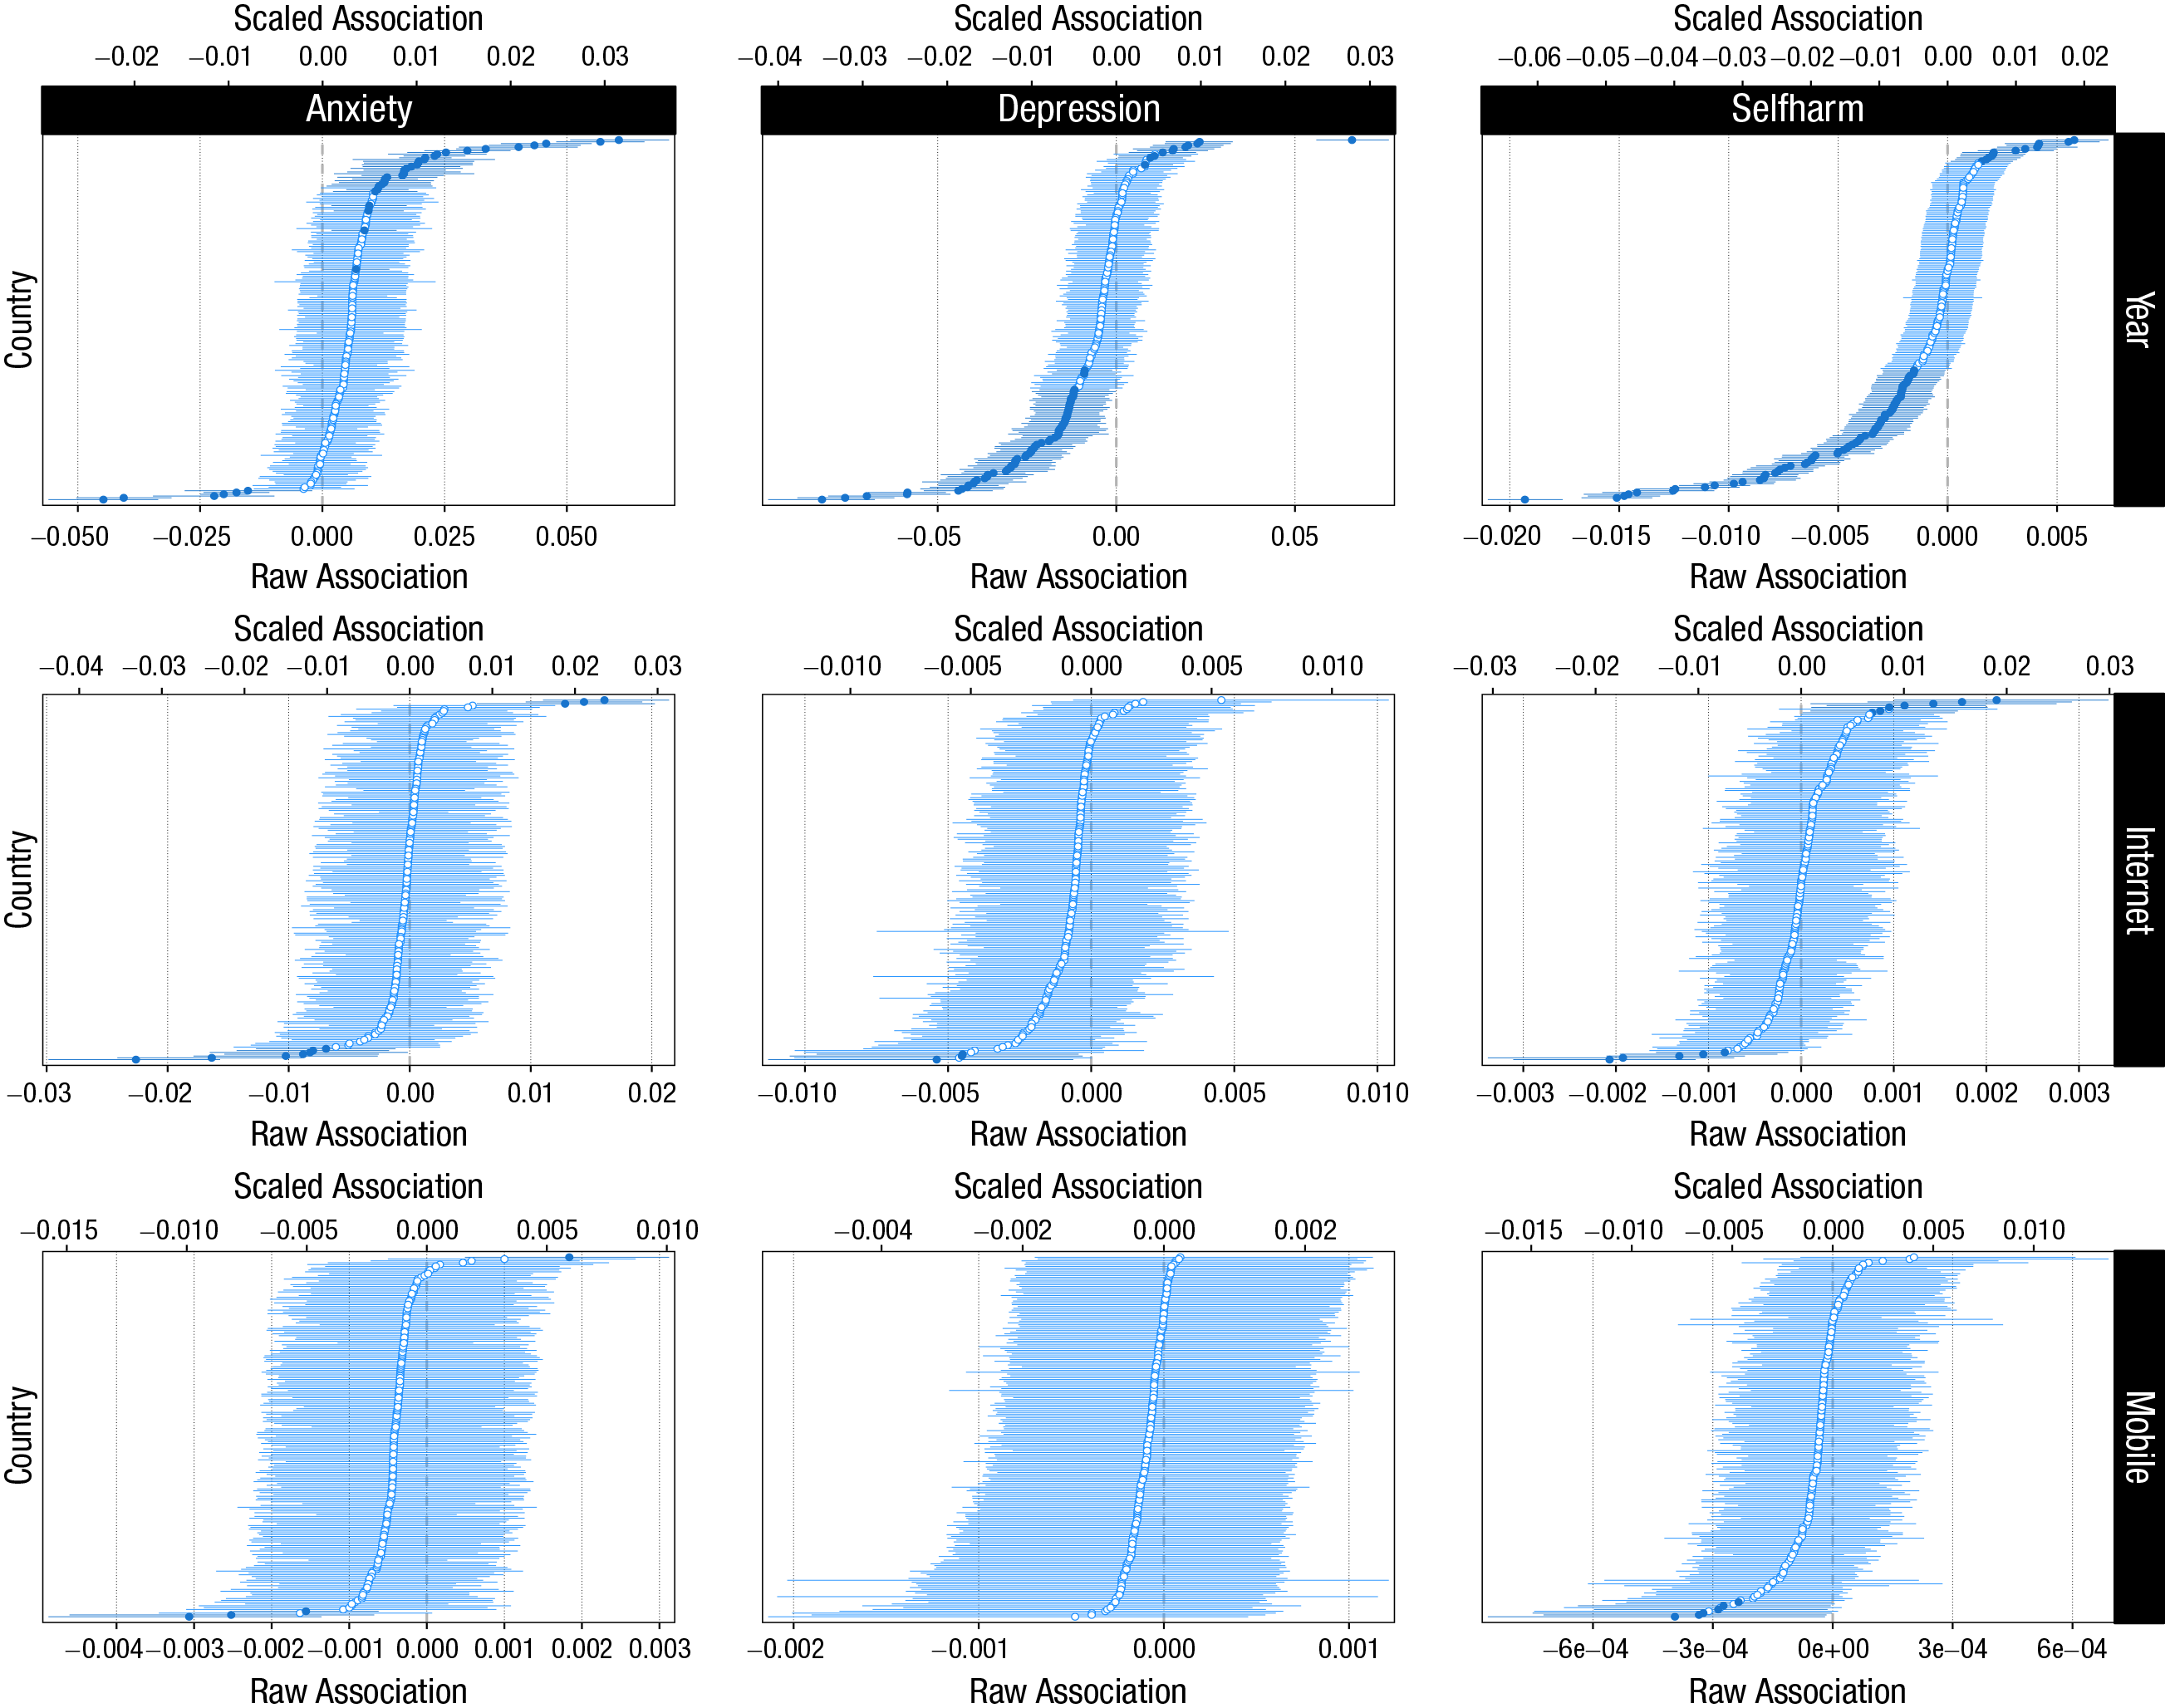
Country-specific yearly changes in (top row) three mental-health outcomes and their associations with (second row) per capita Internet users and (third row) mobile-broadband subscriptions. Points and lines indicate individual countries’ posterior means and 95% credible intervals. Countries are sorted from the most negative to most positive estimate. Filled points indicate that the parameter’s 95% credibility interval excludes zero (in both panels). Raw associations (bottom x-axes) indicate changes in the outcome percentage as function of percentage (or 1 year) change in the predictor. Scaled associations (top x-axes) indicate changes in standardized outcome as function of the average year-on-year change in the predictor.
Thus, analyses of country-specific associations provided stronger evidence that (mobile) Internet penetration does not meaningfully predict fluctuations in countries’ mental health.
Demographics
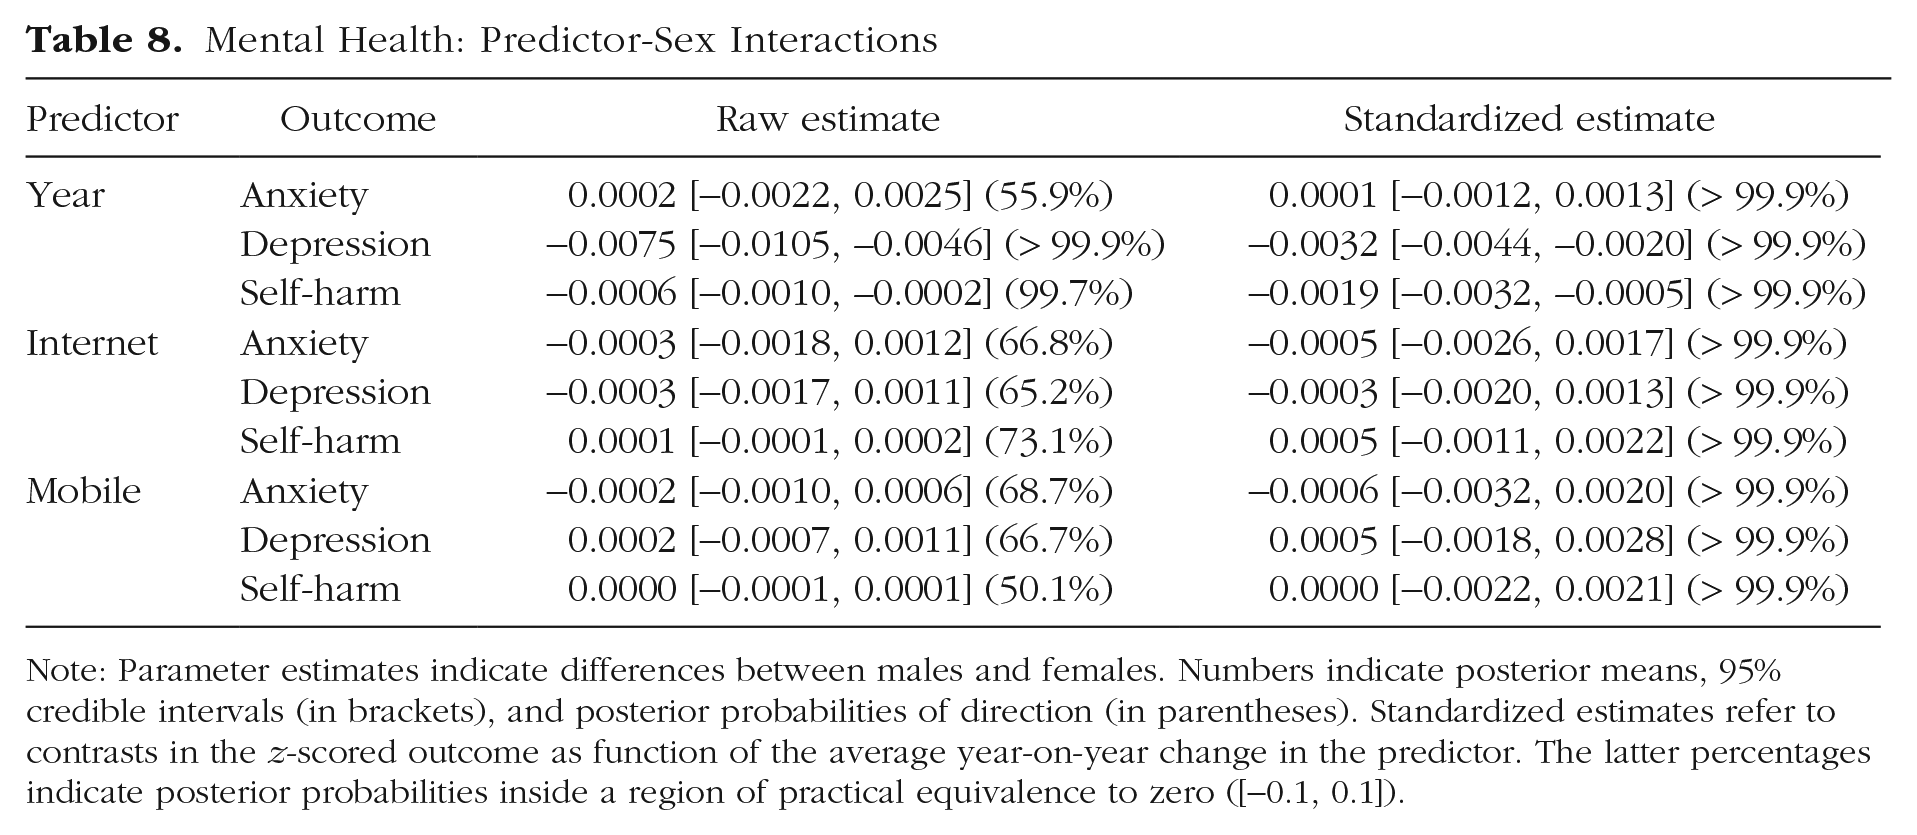
We then turned to our third research question and studied how trends in mental health or its associations with Internet-technology adoption varied across demographic groups. Changes in rates of anxiety showed a complex pattern whereby older males’ rates of anxiety increased more than younger males’, except the very youngest age group (Fig. 6). For females, on the other hand, rates of anxiety increased least for the oldest and youngest groups. Overall, the difference in changes in anxiety between males and females was credibly null (Table 8 in Appendix 1). Depression had decreased more for females than males (Table 8 in Appendix 1) and for the middle-age groups versus the youngest and oldest groups. There were no average sex differences in rates of decline of self-harm (Table 8 in Appendix 1), but the declines were greater for older than younger age groups (Fig. 6).
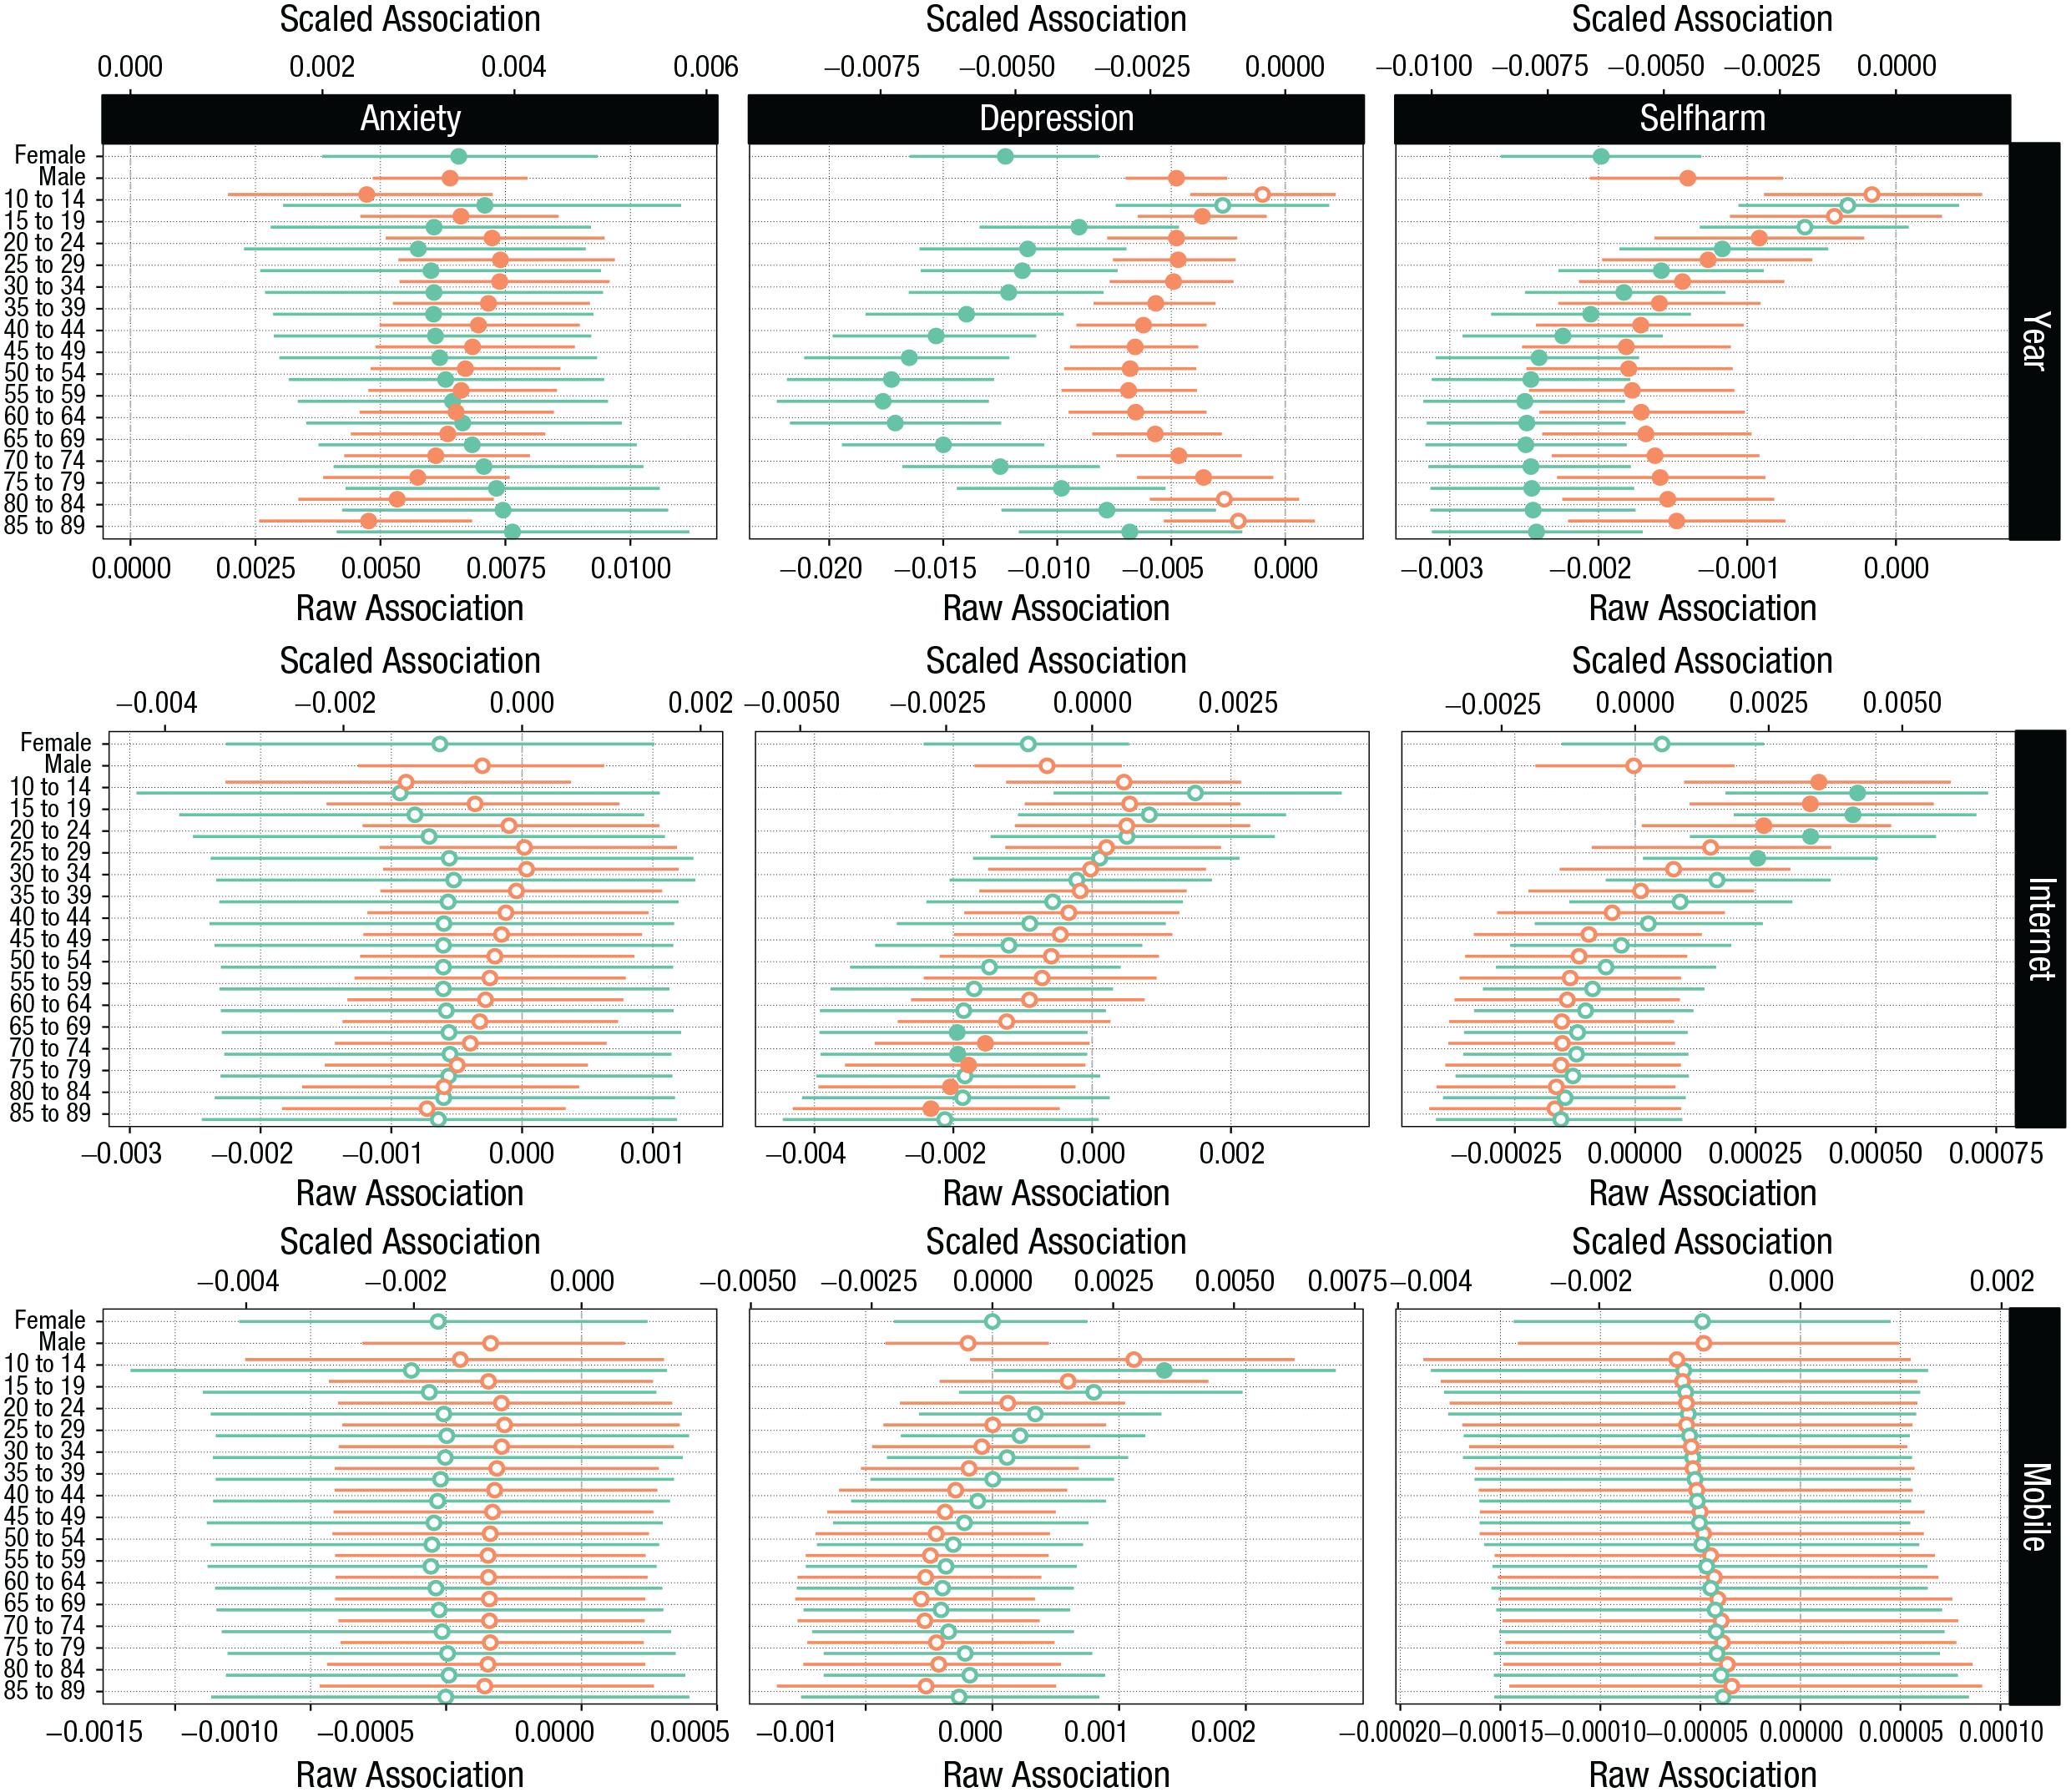
Age- and sex-specific (green: female; red: male) changes in (top row) three mental-health outcomes and their associations with (middle row) per capita Internet users and (bottom row) mobile-broadband subscriptions. Bottom x-axes indicate raw associations. Top x-axes are scaled associations.
Overall, the demography-based differences in the mental-health–internet-adoption associations were smaller than within the mental-health trends (Fig. 6). There were no sex differences in associations linking either per capita Internet users or mobile-broadband subscriptions to either mental-health outcome that were credibly different from zero. Tested against a ROPE of [−0.1, 0.1], all sex differences were credibly null. Age-based differences in links with anxiety were small. However, depression was negatively and credibly associated with Internet adoption for older age groups but positively and credibly associated with per capita mobile-broadband subscriptions for both sexes in the 10- to 14-year-old and 15- to 19-year-old age brackets, based on sign tests. The magnitudes of these associations were very small and supported null associations on the standardized scale. Likewise, per capita Internet users predicted self-harm negatively for older age groups in the 65- to 89-year-old brackets but positively in the 10- to 34-year-old brackets. These results indicated some support for the idea that younger individuals’ mental health may be more negatively associated with the adoption of Internet technologies, although this finding was not consistent across the two different predictors or three different mental-health outcomes and was, in fact, null considered in the context of a ROPE of [−0.1, 0.1] on the standardized scale.
Discussion
In Study 2, we replicated the analyses regarding well-being in Study 1 using three mental-health outcomes from a different data set. We found mixed results regarding changes in the rates of mental-health problems whereby rates of anxiety had increased but rates of depression and self-harm decreased for the average country and when tested against a point null hypothesis. However, when tested against a ROPE of [−0.1, 0.1] on a standardized scale, all associations were credibly equivalent to that null interval. Similar to the average contrasts, country-, age-, and sex-specific coefficients were all credibly equivalent to zero. With the important caveat that the GBD mental-health rates analyzed here are noisy meta-analytic estimates, our results suggested only small, if any, average changes in mental health globally and, moreover, no associations between mental health and Internet-technology adoption.
General Discussion
The idea that the rapid and global penetration of the Internet and technologies enabled by it is affecting psychological well-being and mental health is compelling but not adequately tested. In two studies, we focused on the degree to which well-being and mental health had changed in the past 2 decades across most world countries. On the basis of sign tests, we found mostly mixed and inconclusive results; on the basis of ROPE tests and a smallest coefficient size of interest of 0.1, we found evidence against meaningfully large changes in well-being and mental health. These results align with other results that tend to be mixed or find few changes over time (Bor et al., 2014; Collishaw, 2015; Cosma et al., 2020; Keyes et al., 2019). In addition, although previous reports have suggested increasing mental-health problems specific to young females (e.g., Bor et al., 2014), we did not find support for such changes for the average country.
We then measured the extent to which per capita Internet users and mobile-broadband subscriptions predicted levels of well-being and mental health (within countries). Although confidence for direction of these coefficients exceeded 95% in one case out of 12, on a standardized scale, all 12 associations were practically equivalent to zero with very high confidence. The small associations were also qualified by variability across countries and demographics. Furthermore, countries in which Internet technologies were more widely adopted overall were not those with lowest levels of well-being and mental health.
We also examined the moderating roles of sex and age: Both depression and self-harm were more positively associated with per capita Internet users and mobile-broadband subscriptions in the younger age brackets—including the youngest studied here at 10 to 14 years—than they were for older age groups. However, evaluated against a smallest association of interest, all sex- and age-based associations provided evidence for null associations. Studies on the association between Internet-technology use and mental health across wide age ranges are scarce. Nevertheless, although we found few gender differences, our results are in line with one study that reported that cross-sectional associations between social media use and life satisfaction are more negative at specific time windows in adolescence (Orben et al., 2022).
Our results do not provide evidence supporting the view that the Internet and technologies enabled by it, such as smartphones with Internet access, are actively promoting or harming either well-being or mental health globally. Our results also suggest that age- and sex-based differences in associations linking Internet-technology adoption and well-being are small. However, we did find some evidence suggesting that Internet-technology adoption is more negatively associated with young individuals’ mental health than older groups’ (whose associations were, in some cases, positive). Nevertheless, these associations, although sometimes credibly different from zero, appeared small in magnitude and were credibly in the null region when evaluated against a smallest effect size of interest of 0.1 on the standardized scale. Because of their apparently small magnitude and the fact that the data are not at the individual level, we highlight that these contrasts do not speak to whether the associations might be clinically relevant.
Note that the data and theory required to address this question at the causal level are absent. Consequently, our analyses cannot account for potential confounders in the associations linking mental health and well-being to Internet-technology adoption. Our descriptions, therefore, are suggestive but are not intended to provide evidence for or against causal relations. Although the first to study this topic within a global perspective, future studies should investigate other potential differences based on demographic, economic, and cultural factors, which we could not address here. In addition, our results regarding mental health, although comprehensive, are necessarily and considerably less certain than those on well-being because of the lack of diverse global data and our own reliance on GBD estimates in place of objective measurements of mental health. In addition, the data aggregation necessary to link Internet adoption and well-being at the national level precludes investigating other important and relevant questions, such as comorbidities.
Research on the effects of Internet technologies is stalled because the data most urgently needed are collected and held behind closed doors by technology companies and online platforms. It is crucial to study, in more detail and with more transparency from all stakeholders, data on individual adoption of and engagement with Internet-based technologies. These data exist and are continuously analyzed by global technology firms for marketing and product improvement but unfortunately are not accessible for independent research. It remains a fundamental challenge to this field of inquiry to ensure that this information is accessible to independent scholars. Until these data can be transparently analyzed for the public good, the potential harmful effects of the Internet and other digital environments will remain unknown.
Footnotes
Appendix 1
Mental Health: Predictor-Sex Interactions
| Predictor | Outcome | Raw estimate | Standardized estimate |
|---|---|---|---|
| Year | Anxiety | 0.0002 [−0.0022, 0.0025] (55.9%) | 0.0001 [−0.0012, 0.0013] (> 99.9%) |
| Depression | −0.0075 [−0.0105, –0.0046] (> 99.9%) | −0.0032 [−0.0044, –0.0020] (> 99.9%) | |
| Self-harm | −0.0006 [−0.0010, –0.0002] (99.7%) | −0.0019 [−0.0032, –0.0005] (> 99.9%) | |
| Internet | Anxiety | −0.0003 [−0.0018, 0.0012] (66.8%) | −0.0005 [−0.0026, 0.0017] (> 99.9%) |
| Depression | −0.0003 [−0.0017, 0.0011] (65.2%) | −0.0003 [−0.0020, 0.0013] (> 99.9%) | |
| Self-harm | 0.0001 [−0.0001, 0.0002] (73.1%) | 0.0005 [−0.0011, 0.0022] (> 99.9%) | |
| Mobile | Anxiety | −0.0002 [−0.0010, 0.0006] (68.7%) | −0.0006 [−0.0032, 0.0020] (> 99.9%) |
| Depression | 0.0002 [−0.0007, 0.0011] (66.7%) | 0.0005 [−0.0018, 0.0028] (> 99.9%) | |
| Self-harm | 0.0000 [−0.0001, 0.0001] (50.1%) | 0.0000 [−0.0022, 0.0021] (> 99.9%) |
Note: Parameter estimates indicate differences between males and females. Numbers indicate posterior means, 95% credible intervals (in brackets), and posterior probabilities of direction (in parentheses). Standardized estimates refer to contrasts in the z-scored outcome as function of the average year-on-year change in the predictor. The latter percentages indicate posterior probabilities inside a region of practical equivalence to zero ([−0.1, 0.1]).
Acknowledgements
We thank Niklas Johannes for feedback on this work. We also acknowledge the use of the University of Oxford Advanced Research Computing facility in carrying out this work (http://dx.doi.org/10.5281/zenodo.22558). The International Telecommunication Union data and a complete list of years, countries, and sources of data are freely available at https://www.itu.int/en/ITU-D/Statistics/Pages/stat/default.aspx. The Gallup World Poll data are available to subscribing institutions through Gallup. The Global Burden of Disease study data are freely available at ![]() . A. K. Przybylski’s research is currently supported by the Huo Family Foundation and the Economic and Social Research Council (ESRC; ES/S00324X/1) and was recently supported by the ESRC (ES/T008709/1). In the preceding five years A. K. Przybylski has also worked on research grants provided the John Fell Fund, The Diana Award and the children’s charity Barnardo’s. These research grants were paid to the A. K. Przybylski’s employer, the Oxford Internet Institute. During this period, A. K. Przybylski has also engaged unpaid consultations with several organisations including UNICEF, the Organization for Economic Co-operation and Development, Meta Inc., UKIE, UK Research and Innovation, The UK’s DCMS, The Office of the UK’s Chief Medical Officer, the Office of the US Surgeon General, The UK’s Academy of Medical Sciences, and the UK Parliament. There were no financial products or benefits resulting from these consultations. The funders and these organisations had no role in study design, data collection and analysis, decision to publish, or preparation of the article.
. A. K. Przybylski’s research is currently supported by the Huo Family Foundation and the Economic and Social Research Council (ESRC; ES/S00324X/1) and was recently supported by the ESRC (ES/T008709/1). In the preceding five years A. K. Przybylski has also worked on research grants provided the John Fell Fund, The Diana Award and the children’s charity Barnardo’s. These research grants were paid to the A. K. Przybylski’s employer, the Oxford Internet Institute. During this period, A. K. Przybylski has also engaged unpaid consultations with several organisations including UNICEF, the Organization for Economic Co-operation and Development, Meta Inc., UKIE, UK Research and Innovation, The UK’s DCMS, The Office of the UK’s Chief Medical Officer, the Office of the US Surgeon General, The UK’s Academy of Medical Sciences, and the UK Parliament. There were no financial products or benefits resulting from these consultations. The funders and these organisations had no role in study design, data collection and analysis, decision to publish, or preparation of the article.
M. Vuorre’s research is currently supported by the Economic and Social Research Council (ESRC; ES/W012626/1) and the John Fell Fund, and was recently supported by the Huo Family Foundation (awarded to A. K. Przybylski).
Transparency
Action Editor: Pim Cuijpers
Editor: Jennifer L. Tackett
Author Contribution(s)