
Abstract
The main diagnostic criteria for major depressive disorder (MDD) are consistent experiences of high levels of negative emotions and low levels of positive emotions. Therefore, modification of these emotions is essential in the treatment of MDD. In the current study, we harnessed a computational approach to explore whether experiencing negative emotions during psychological treatment is related to subsequent changes in these emotions. Facial expressions were automatically extracted from 175 sessions of 58 patients with MDD. Within sessions, a U-shaped trajectory of change in valence was observed in which patients expressed an increase in negative emotions in the middle of the session. Between sessions, a consistent increase in valence was observed. A trajectory of within-sessions decrease followed by an increase in valence was positively associated with greater perceived positive emotions and subsequent decreases in depressive symptoms. These findings highlight the importance of targeting negative emotions during treatment to achieve more favorable outcomes.
Keywords
Depression is one of the most prevalent mental-health disorders and the leading cause of disability worldwide (American Psychiatric Association, 2013; Friedrich, 2017). Much of the impairment in the functioning of individuals diagnosed with MDD emanates from mood disturbances in both positive and negative emotions (Gross & Jazaieri, 2014). Although there is an ongoing debate in the field as to whether individuals with MDD consistently display both high levels of negative emotions and low levels of positive emotions, these symptoms are currently used to diagnose depression (Hamilton, 1967; Joormann & Stanton, 2016; Joormann & Vanderlind, 2014). Although a range of empirically supported interventions are available for the treatment of MDD, rates of nonresponse remain high, highlighting the pressing need to improve current treatments (Cuijpers et al., 2014,). One way to improve treatment is by targeting the fundamental processes that go awry in depression.
One of the leading theoretical models to understand the mechanisms underlying MDD suggests that the emotional impairment observed in MDD results from “emotional avoidance.” Emotional avoidance is defined as an unhealthy attempt to control negative emotions by avoiding them (S. C. Hayes et al., 1996). According to this model, in an attempt to regulate distress, individuals with MDD exert considerable efforts to suppress and avoid the experience of negative emotions. This suppression prevents them from effectively responding to emotional stimuli and thus may reduce emotional distress in the short term but increases emotional distress and attenuates positive emotionality over time (Gross, 2013). Hence, emotional avoidance may increase the risk for depression (Bylsma et al., 2008). Consistent with the conceptualization of emotional avoidance as a mechanism underlying symptoms of MDD, numerous studies have found emotional avoidance to be related to depressive symptoms (Campbell-Sills et al., 2006; Cribb et al., 2006; Forbes et al., 2020; Mellick et al., 2019; Tull et al., 2004). In addition, strategies of expressing emotions were found to be associated with a decrease in depressive symptoms (Kahn & Garrison, 2009).
To improve mental health, most psychological treatment modalities incorporate interventions aimed at exposing patients to previously suppressed emotions and helping them experience and express them in adaptive ways (for reviews, see Aafjes-van Doorn & Barber, 2017; Greenberg, 2012; Summers & Barber, 2010; Thoma & McKay, 2014). It is assumed that people often avoid their emotions because they are unable to regulate them. Through therapy, people can first express their emotions and then learn how to regulate and process them in a healthier manner (Greenberg, 2012). Thus, negative emotions are expected to increase during a session but decrease from session to session as the patients enhance their ability to handle these emotions. Previous studies have found that interventions aimed at decreasing emotional avoidance and encouraging patients’ greater experience of emotions were associated with symptom decrease and improved mental functioning (Diener et al., 2007; Fisher et al., 2020; Peluso & Freund, 2018). In addition, patients who experienced their emotions during treatment and did it in a stable manner showed an improvement in their ability to regulate their emotions (Fisher et al., 2019). However, scant attention has been paid to the process of emotion modification—in which negative emotions are transformed into positive ones—during psychological treatment. In the current study, we thus explored how emotions change both within and between sessions by measuring emotions as they fluctuate continuously within each session. We also explored whether targeting emotional avoidance through the experience of negative emotions during psychological treatment can change the way emotions are experienced by patients diagnosed with MDD and improve depressive symptoms.
Most previous studies have identified emotions by self-report questionnaires or observer ratings, both of which curtail researchers’ ability to repeatedly measure within-sessions change (Sloan & Kring, 2007). Self-reports provide only a retrospective snapshot and thus cannot fully capture emotional dynamics during a session. Observer ratings are time-consuming, which makes them impractical for data with repeated observations for each participant. In addition, previous studies in psychotherapy have focused on patients’ verbal responses or self-reports to detect the experience of emotions; however, emotions are often also expressed nonverbally, through tone of voice or facial expressions. Therefore, focusing on the nonverbal expression of emotions can provide a deeper understanding of the ways in which emotions are displayed and modified during psychological treatment. Facial expressions constitute one of the most fundamental types of nonverbal expressions of emotions.
Depression as a mood disorder can be portrayed through a variety of nonverbal signs, including facial expression (Ellgring, 1989; Waxer, 1974). For example, the duration and intensity of spontaneous smiles (Scherer et al., 2013, 2014) or a lack of smiles (Lucas et al., 2015) are considered to contain valuable patterns for depression detection. Previous studies using automatic coding of facial expressions have reported that variance in facial expressions successfully predicted the presence of depression (Alghowinem et al., 2015; Girard et al., 2014; Pampouchidou et al., 2016; Schneider et al., 1990; Stratou et al., 2015). However, very little is known about how facial expressions change during the treatment of depression and how this change is related to patients’ perceived emotions and to changes in depressive symptoms.
Recent research has drawn on computer vision and machine learning to automatically identify emotions from video recordings of facial expressions (Harley, 2016; Ko, 2018). Recent developments in computer science have significantly improved the validity, reliability, and accessibility of automated facial-expression analysis (Cootes et al., 2001; Lewinski et al., 2014; Sandbach et al., 2012). These technologies are noninvasive, allowing for the detection of spontaneous facial behavior without the use of recording equipment, such as electrodes and wires. A growing body of literature has explored the reliability of automatic facial coding in detecting emotions by comparing it with traditional methods. Results have shown that automatic facial coding generates values that are comparable and highly correlated with those generated by untrained human coders (Krumhuber et al., 2021a, 2021b), trained human coders (Girard & Cohn, 2015; Girard et al., 2013; Gupta et al., 2022), and electromyography, which is currently considered the psychophysiological “gold standard” (Beringer et al., 2019; Höfling et al., 2021; Kulke et al., 2020).
Although there is growing use of these automated methods in psychology (Haines et al., 2019), few works have employed this method in psychotherapy (Arango et al., 2019). To the best of our knowledge, only one study has collected and analyzed facial expressions to explore how emotions change during therapy. In this study, facial expressions were automatically coded at the beginning and end (first 10 min and last 10 min) of 29 therapy sessions of 12 patients. A significant decrease in negative valence was found from the beginning of the sessions to the end (Arango et al., 2019). These findings point to the importance of psychological treatment in modifying emotions. However, given that only the beginnings and ends of the sessions were analyzed, it is not clear how emotions changed throughout the sessions. In most therapy sessions, patients share their difficulties with the therapists, thus suggesting that the increase in positive emotions found by Arango et al. (2019) may have occurred after an increase in negative emotions during the middle of the session, generating a U-shape of decrease followed by an increase.
In the current study, we incorporated automatic facial-recognition tools to explore how nonverbal emotional expressions change over the course of treatment. We explored changes in the short term, within the therapy session, and in the long term, between therapy sessions. We expected that a temporary increase in negative emotions would be observed within the therapy session but that there would be consistent decrease in negative emotions and increase in positive emotions over the course of treatment. To explore the gradual transition from positive to negative emotions and vice versa within a session, we used a dimensional approach according to which emotions exist on a continuum of affective dimensions (Barrett, 1998). In the dimensional approach, transitions of emotions can be easily captured on one or more continuous scales (Gunes & Schuller, 2013). One such scale is the “valence” scale, which refers to whether an emotion is pleasant/positive or unpleasant/negative and rated continuously from negative (low valence) to positive (high valence) emotions. The dimensional approach is consistent with previous research on depression, which showed that it is related to various positive and negative emotions (Power & Tarsia, 2007; Watson et al., 2011). In psychotherapy for depression, one of the main goals is to process, regulate, and transform negative emotions regardless of their specific category (Greenberg & Safran, 1990). This approach is widely used in depression research and has been applied in cases of human coding (e.g., Girard et al., 2013), automatic facial-expression coding (Flynn et al., 2020; Girard et al., 2013; Stöckli et al., 2018), physiological measures (functional MRI; Habes et al., 2013; Kim et al., 2020), and self-reports (Kuppens et al., 2013).
Finally, we explored how change in these expressions converged with patients’ prospective reports on their in-session emotions. On the basis of the literature on emotional avoidance, we hypothesized the following:
Hypothesis 1: Within treatment sessions, patients will exhibit a pattern of decrease in valence (more negative and fewer positive emotions) followed by an increase in valence (more positive and fewer negative emotions).
Hypothesis 2: Between sessions, patients will show an increase in positive valence and a decrease in negative valence from session to session.
Hypothesis 3: Within sessions, a pattern of decrease followed by an increase in valence will be associated with patients reporting that they experienced fewer negative emotions and more positive emotions during the session.
In addition, as an exploratory hypothesis, we investigated whether in-session changes in valence would also predict subsequent decreases in depressive symptoms.
Transparency and Openness
The study analysis code and supplemental materials are available at https://osf.io/3mehp. In addition, Supplemental Material is available online. When this study was carried out, the informed-consent form for the participants stated that we would keep the data strictly confidential and would not be shared. Therefore, the data are not available. We report how we determined our sample size, all data exclusions, all manipulations, and all measures in the study. The study design, procedure, and informed-consent form were approved by the Ethics Committee of the University of Haifa (Approval No. 395/19, October 30, 2019).
Method
Patients and procedure
The initial sample included 86 patients enrolled in 16-session manualized psychotherapy for MDD as part of a randomized control trial (RCT) comparing supportive treatment and supportive-expressive treatment (Zilcha-Mano et al., 2021). The inclusion criteria for participating in the RCT were (a) a current MDD diagnosis based on the Mini International Neuropsychiatric Interview (Sheehan et al., 1998) and scores above 14 on the 17-item Hamilton Rating Scale for Depression (HRSD; Hamilton, 1967) on two evaluations, 1 week apart; (b) if on medication, patients’ dosage had to be stable and they had to be willing to maintain a stable dosage for the duration of treatment; (c) age from 18 to 60 years; and (d) Hebrew-language fluency. The exclusion criteria were (a) current risk of suicide or self-harm (HRSD suicide item > 2); (b) current substance abuse disorder; (c) current or past schizophrenia or psychosis, bipolar disorder, or severe eating disorder, requiring medical monitoring; (d) history of organic mental disease; and (e) currently in psychotherapy. Table 1 lists the patients’ demographic and clinical characteristics. Further information on the RCT is provided in the Supplemental Material.
Patients’ Demographic and Clinical Characteristics
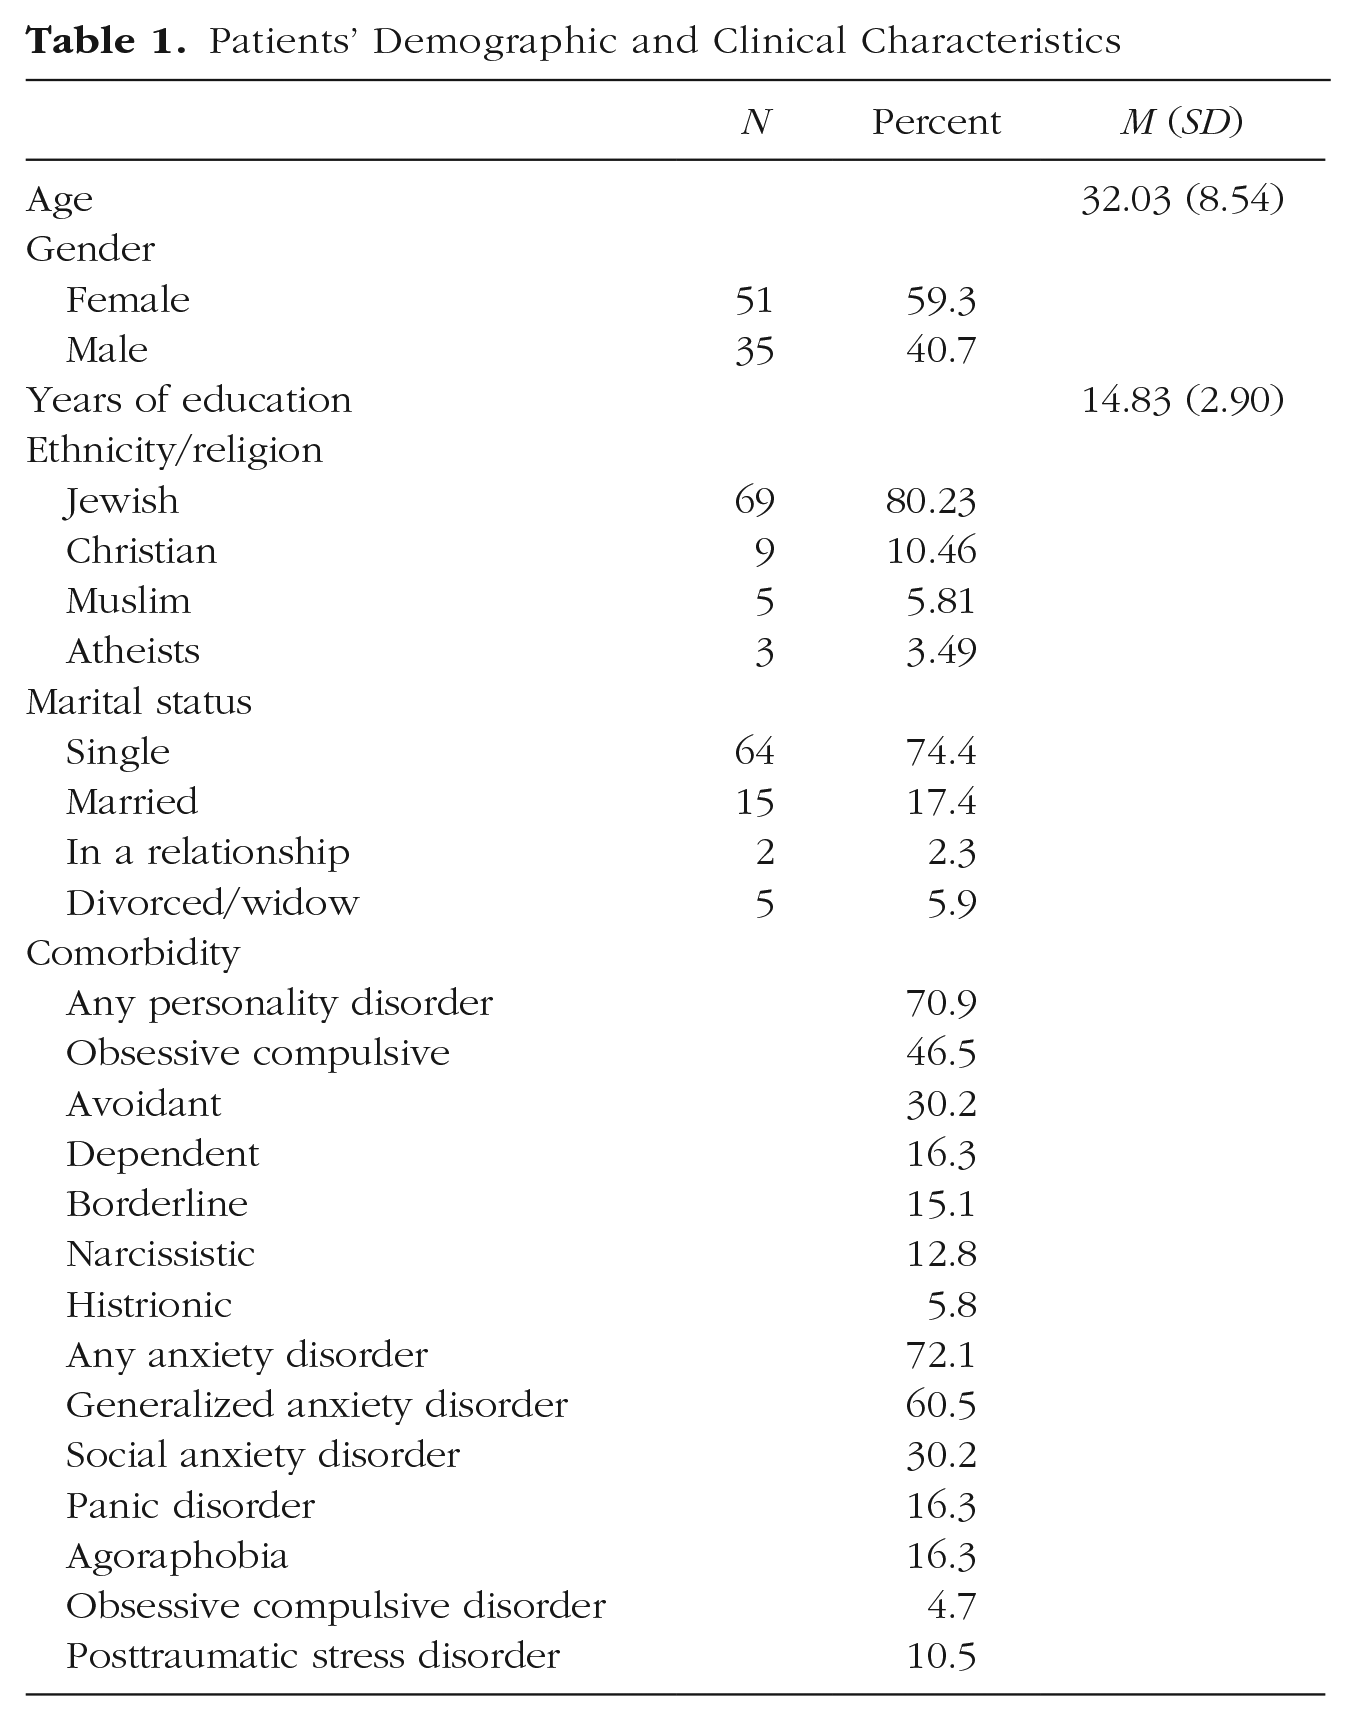
During the active phase of treatment, patients completed the Positive and Negative Affect Scale (PANAS; Watson et al., 1988) immediately after each session. All sessions were videotaped in the consulting room. The participants were given comprehensive information about the study procedure both orally and in writing. This information covered the possible implications of their participation, including potential risks, inconveniences, and benefits. Patients willing to participate signed informed-consent forms confirming their understanding that all treatment sessions would be videotaped and that they would have the right to withdraw from the study at any time.
The therapy sessions were recorded using a Type IP PTZ HD 1080-pixel (px) camera with a resolution of 1080 px (1920 × 1080 px) at a standard frame rate of 25 frames per second. The camera was attached to the wall in front of the chair in two therapy rooms where the chairs were fixed in place. The camera angle relative to the patients’ faces was frontal and at eye level such that the camera was not able to move or zoom during the sessions.
Measures
Automatic coding of facial expression
The video recordings from Sessions 1, 4, 8, 12, and 16 were processed by automated analysis using the AFFDEX classifier, which is part of the iMotions Biometric Research Platform (Version 9.3; iMotions, 2022). The Affectiva AFFDEX system is a widely used software-development kit that classifies emotional states (Magdin et al., 2019). Similar to other automated facial-expression-analysis systems, AFFDEX uses the facial action-coding system (FACS; Ekman & Rosenberg, 2005), an objective taxonomy widely used for coding facial behavior. FACS comprises approximately 33 anatomically based facial actions, known as action units (AUs), which combine to create various facial expressions. The system can recognize basic emotions through a combination of 20 AUs, which interact to form different facial expressions. It estimates the probability of occurrence (in percentages) for each of the seven basic emotions (anger, sadness, contempt, disgust, fear, joy, and surprise) within 40-ms time windows, providing scores of 0 to 100 for each frame (McDuff et al., 2016). More information about this system is provided in the Supplemental Material. For the purposes of the current study, we used the valence as analyzed by iMotions software. The valence metric, also calculated from a set of observed facial expressions, indicates whether the emotional state of the participant is positive or negative with a range of values from –100 to 100. Recent research suggests that valence is preferable when using automatic coding of facial expressions because it can resolve the issue of lower accuracy rates for nonprototypical emotions (Yitzhak et al., 2017). Valence can be applied to all relevant expressions, including subtle and complex emotions that may be missed with a categorical approach (Stöckli et al., 2018). In addition, the range of –100 to 100 is less subject to floor and ceiling effects than emotion variables that range from 0 to 100 and is closer to the normal distribution conventionally assumed in linear mixed-effect models. Information about the validity of the AFFDEX valence estimates in our data set is provided in the Supplemental Material.
Validity of the AFFDEX valence estimates
A total of 24 sessions (2,132 observations) were coded by four raters who had no prior training. Eight sessions were coded by one rater, 15 were coded by two raters, and one was coded by three raters. The advantage of using untrained volunteers is that it allows for a more naturalistic approach to studying how people perceive facial expressions rather than relying on experts who may have preconceptions or biases (Tottenham et al., 2009). In our analyses, AFFDEX ratings were averaged for every 30 s. To match this, the raters observed video recordings of the sessions and evaluated the valence of each 30-s interval on a scale ranging from –100 to 100. Thus, half-minutes were nested within sessions. There is no additional level of session within subjects because we evaluated no more than one session for each subject.
Validity of the AFFDEX estimates for our data was assessed in two stages. First, we calculated the interrater reliability among the human raters. Second, we examined the consistency between the human ratings (averaged across raters) and the ratings obtained from AFFDEX. Interrater reliability for the human raters was measured by intraclass correlation (ICC) for multilevel data using maximum likelihood estimation (Ten Hove et al., 2022). According to standard benchmarks for κ or ICC (Fleiss et al., 2013), which consider values of .40 and below as poor, .40 to .59 as fair, .60 to .74 as good, and .75 or above as excellent, we found fair interrater reliability at the within-sessions level (ICC = .52) and excellent interrater reliability at the patient level (ICC = .81).
To explore the consistency between human and automatic coding, we conducted correlation analyses at both the within-sessions and between-patients levels. Within-sessions correlation was computed by the method of Bland and Altman (1995) implemented in R by Bakdash and Marusich (2017). At the between-patients level, we estimated the overall correlations between average session ratings. The correlation between the valence derived from human coding and automated coding was strong at the within-sessions level (r = .38, p < .001) and stronger at the between-patients level (r = .68, p < .001). These findings align with a recent study by Gupta et al. (2022), which also demonstrated a substantial association between iMotions coding and human coding.
The PANAS
The PANAS (Watson et al., 1988) was used to assess patients’ retrospective reports on their emotions during each therapy session. The PANAS is a self-report questionnaire consisting of 20 items, 10 assessing subjective experience of positive affect (PA; e.g., interested, enthusiastic) and 10 assessing subjective experience of negative affect (NA; e.g., irritable, upset). Patients were asked to rate the extent to which they experienced each of the presented emotions during the session. Items were rated on a scale from 1 (very low or not at all) to 5 (very much). A mean score of positive and negative emotions was calculated for each session throughout treatment. Internal consistency is usually considered acceptable if the estimate is .70 or higher (A. F. Hayes & Coutts, 2020; McNeish, 2018; for a discussion of beliefs about conventional cutoffs for “acceptable” reliability, see Lance et al., 2006). Reliability in our study was acceptable, with a Cronbach’s α of .92 and a McDonald’s ω of .94 for PA and Cronbach’s α of .88 and a McDonald’s ω of .92 for NA.
The HRSD
To evaluate symptomatic change, the HRSD (Hamilton, 1960), a semistructured clinical interview designed to assess the severity of depression, was administered at baseline and before each session. The HRSD contains 21 items rated on 3-point (0–2) or 5-point (0–4) scales. The total score consists of the sum of the responses and ranges from 0 to 52 points, corresponding to greater severity of depression. The internal reliability was found to be acceptable, with a Cronbach’s α of .83 and a McDonald’s ω of .85.
Data preprocessing
To ensure the ecological validity and to avoid altering the usual routine of the session or influencing the interaction between the patient and the therapist, patients were not instructed to look at the camera. As a result, some videos lacked sufficient quality to be processed given the loss of data continuity because of the lack of follow-up of the patient’s face. To restrict our analyses to relatively high-quality data, we took the following steps.
First, the recordings were divided into segments of 30 s (750 frames), and only segments with at least 10% coded frames (75 frames) were considered “valid” for further analysis. Second, sessions were retained only if they included at least 40 valid 30-s segments, containing a total of at least 15,000 coded frames (i.e., approximately 20% of the session).
This process resulted in 175 naturalistic videos from the therapy sessions of 58 patients (14 patients with all five sessions, 11 with four sessions, 10 with three sessions, nine with two sessions, and 13 with one session). A comparison of these 175 retained sessions to the other 172 sessions (those with insufficient available coded frames) in terms of postsession PANAS (Watson et al., 1988) and presession depressive symptoms using the HRSD (Hamilton, 1960) indicated no significant differences (PANAS negative scale: t = −0.80, p = .42; PANAS positive scale: t = 0.05, p = .96; HRSD: t = −0.48, p = .63). To check the sensitivity of the results to different thresholds, we reran the models described below with three alternatives for each threshold. These alternative threshold values did not significantly affect the model results.
Data analytic plan
Therapy sessions were not equal in their length, although most of the sessions followed the 50-min protocol (M = 53.2 min, SD = 3.9, range = 44–60). To standardize the session length, we divided the time in session by the length of the session. Thus, the new variable range was between 0 and 1. For reasons related to interpretation of the models (see explanation after Model 2 below), we subtracted 1 from the session numbers (i.e., the sessions analyzed were numbered 0, 3, 7, 11, and 15).
Because of the scant literature on within-sessions changes in emotions during treatment, we adopted a flexible data-driven approach to describe within- and between-sessions changes in valence rather than assuming a prespecified form, such as linear or quadratic. Specifically, we used spline-based models in the general framework of semiparametric regression (Ruppert et al., 2003; Wood, 2017). This approach allows for flexible shapes of change in variables over time.
Given that assessments were conducted for five sessions (s = 0, 3, 7, 11, 15), the most general model that can be estimated for the mean valence at time t within session s is

where the mean valence is given by distinct smooth curves
More restrictive alternatives to Model 1 may be formulated by assuming (a) that the mean between-sessions change be a linear function of session number s for each within-sessions time point t and/or (b) that the mean between-sessions change be a constant independent of t, implying that the shape of the within-sessions mean valence trajectory is the same for each session.
The first requirement leads to the varying-coefficient model (Hastie & Tibshirani, 1993)

where
The second requirement yields the additive model

where
Imposing both requirements leads to the model

Note that Model 4 is equivalent to Model 2 with
Models 1 through 4 were fitted using the mgcv (Wood, 2017) and gamm4 (Wood & Scheipl, 2020) packages for R (R Core Team, 2022). These packages apply roughness penalties as a form of regularization. The tuning parameters that determine how much regularization to apply are chosen optimally by likelihood-based methods that are described in Wood (2011) and Wood et al. (2016). This approach allows us to avoid oversmoothing (underfitting) or undersmoothing (overfitting) of the data, ensuring that the models accurately captured the underlying trends in the data. For details on the spline implementation, see the Supplemental Material.
The models included random effects of subject and session within subjects. For example, in Model 4, the valence for subject i at time point tijk within his or her jth observed session (session sij) is

where
AIC was also used to evaluate the necessity of flexible models versus simpler quadratic parametric fits. The results showed that the flexible nonparametric approach fit the data better (see Table S2 in the Supplemental Material).
We fitted an additional model with a more complex random-effects structure to examine the relationship between within- and between-sessions change in valence (for this post hoc analysis, see Results section).
To investigate whether patients’ in-session trajectory of valence, as continuously evaluated by their facial expressions, could predict their reports of in-session negative and positive emotions and changes in depressive symptoms, we used scalar-on-function regression models (Dziak et al., 2019; Reiss et al., 2017). These models allow for a data-driven examination of which aspects of the within-sessions dynamics predict the overall assessment of the session by the patient. In their simplest version (omitting random effects), these models are of the form

where subscripts ij denote measurements for the ith client’s jth session and ui denotes the random effect of client i. This model was fitted using the R package refund (Goldsmith et al., 2022). The complete R code and a supplementary document describing additional analyses are available on OSF at https://osf.io/3mehp.
Results
When describing the results, a decrease in valence means more negative and less positive valence, whereas an increase in valence means more positive and less negative emotions. As described in more detail above, Model 1 is the most flexible because it allows the within-sessions valence trajectory to differ between sessions and does not assume linear change in the means between sessions. Model 2 also allows the within-sessions valence trajectory to differ between sessions but assumes linear change between the sessions. Model 3 assumes that the valence trajectory is the same for each session but does not assume linear change between the sessions. Model 4 is the least flexible because it assumes the same valence trajectory for each session and linear change between the sessions. In all models, the within-sessions curve
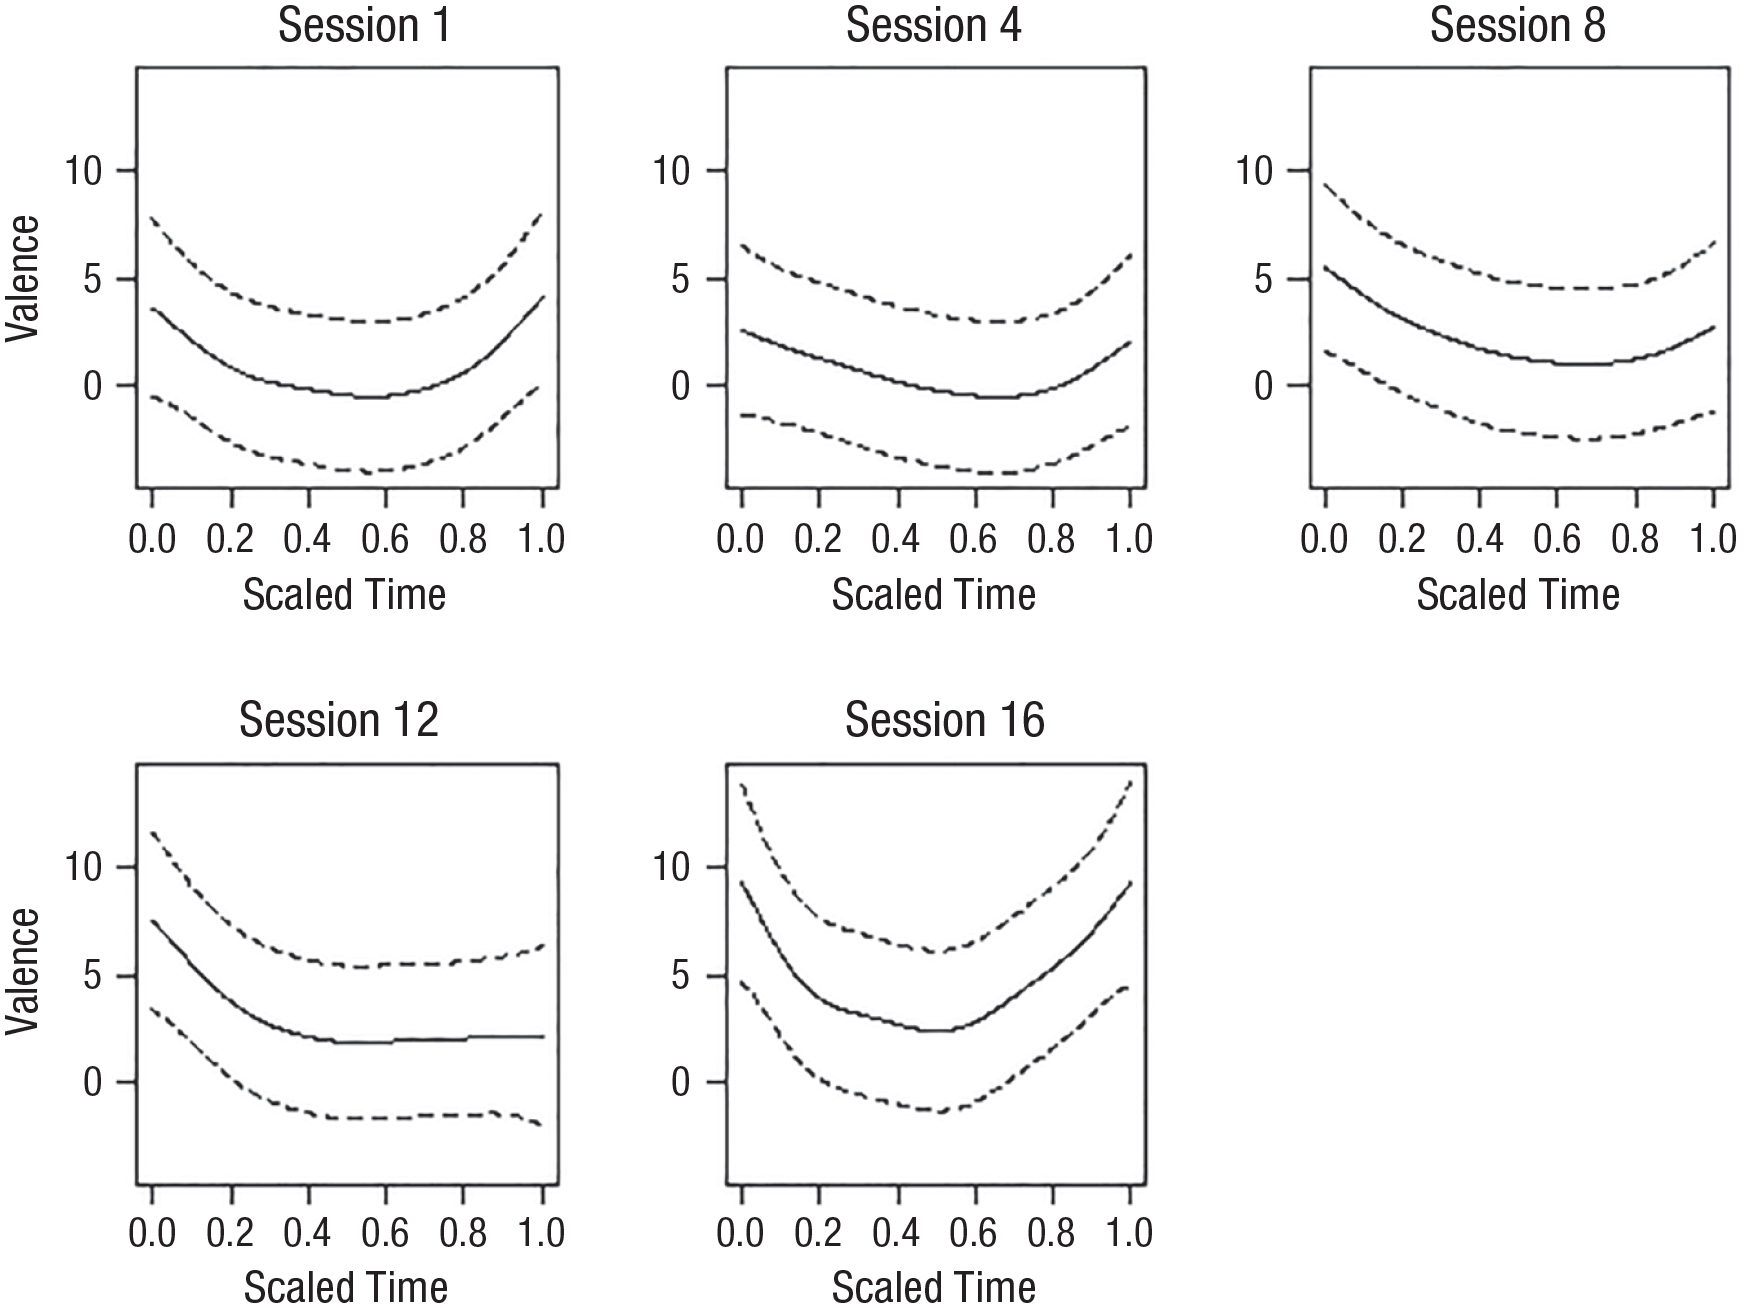
Model 1: curves representing the within-sessions changes in valence for each session. The solid line represents the mean change over the session. The dotted lines represent the confidence interval (CI).
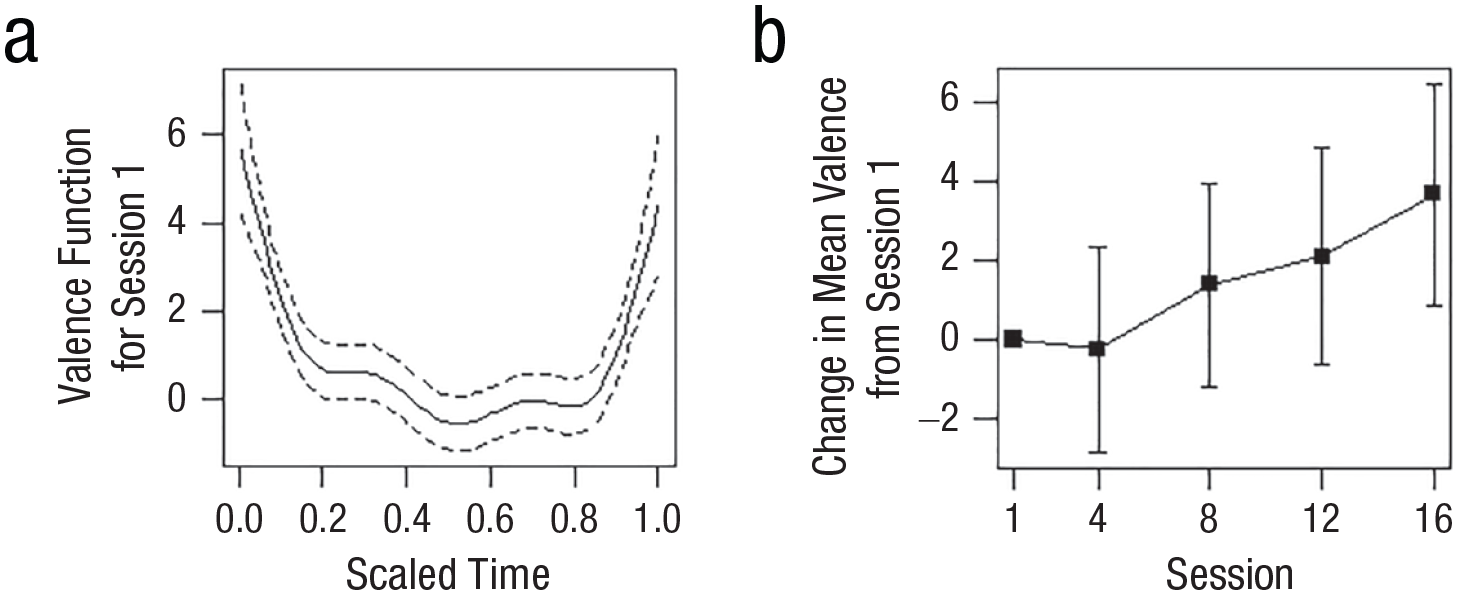
(a) Estimated average valence trajectory within Session 0 according to Model 3. The average valence for each of the later sessions had the same shape according to this model but was shifted vertically by a constant. (b) Estimated average between-sessions change in valence according to Model 3 (see Table 1).
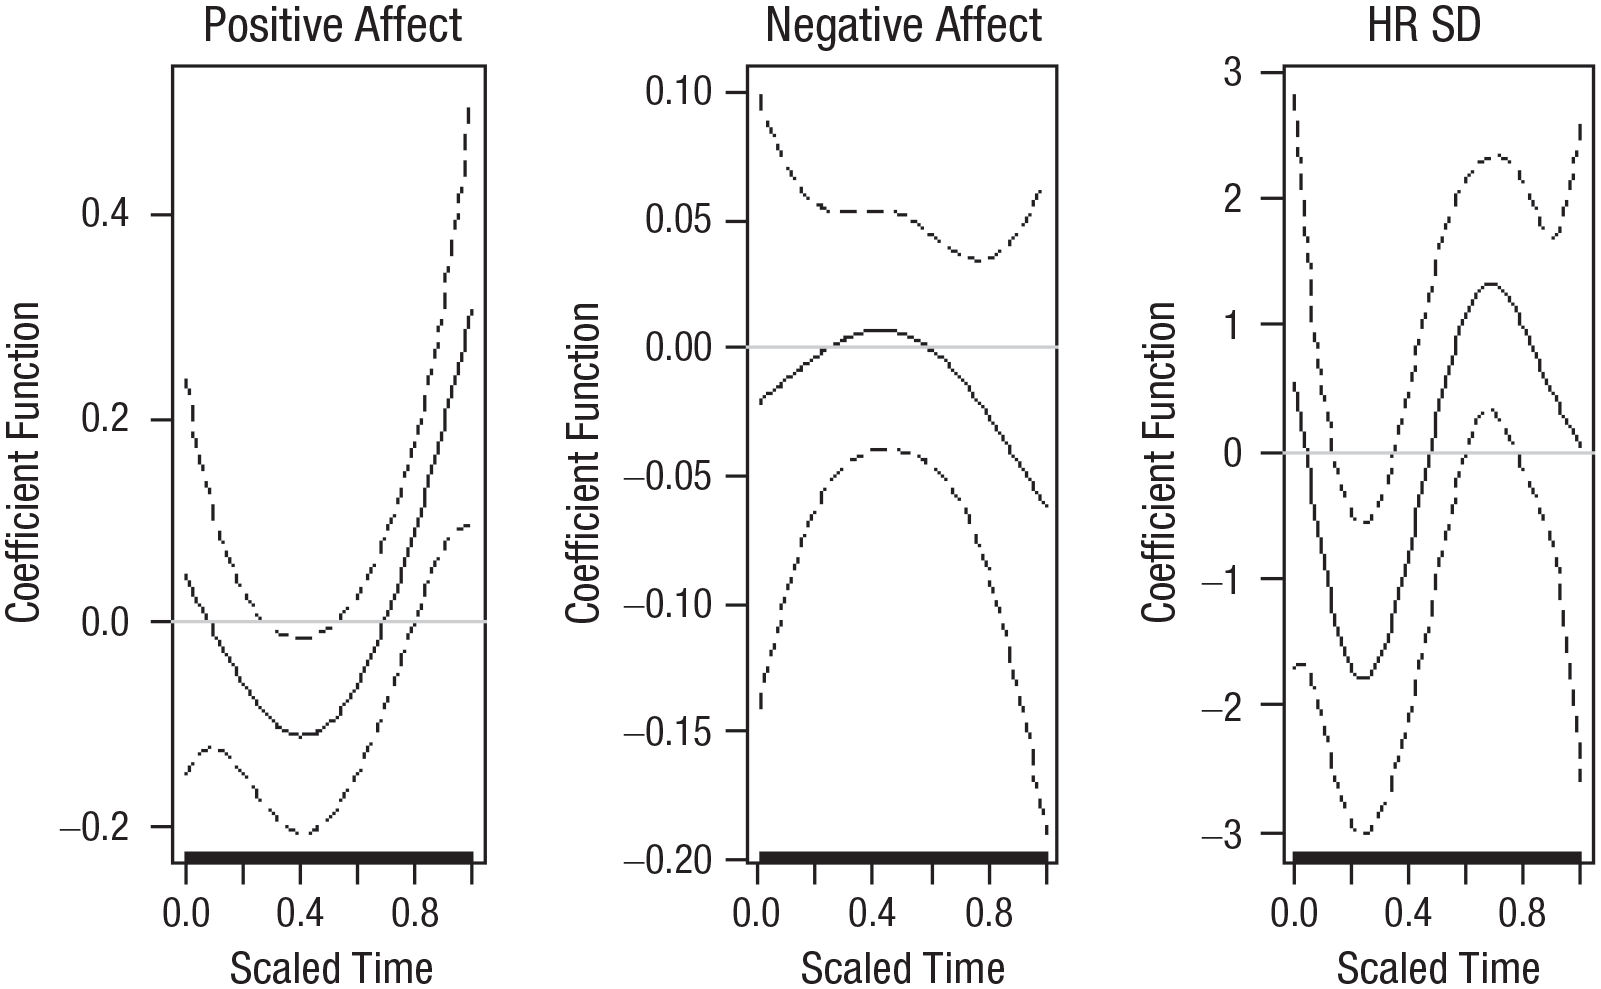
Coefficient functions predicting participants’ reports of (left) positive emotions, (center) negative emotions, and (right) change in depressive symptoms from within-sessions estimated valence trajectory. To facilitate interpretation, the change in depressive-symptom values were multiplied by –1. This adjustment indicates that the valence trajectory predicts a better outcome in terms of change in depressive symptoms.
Estimated Between-Sessions Change in Valence According to Models 3 and 4
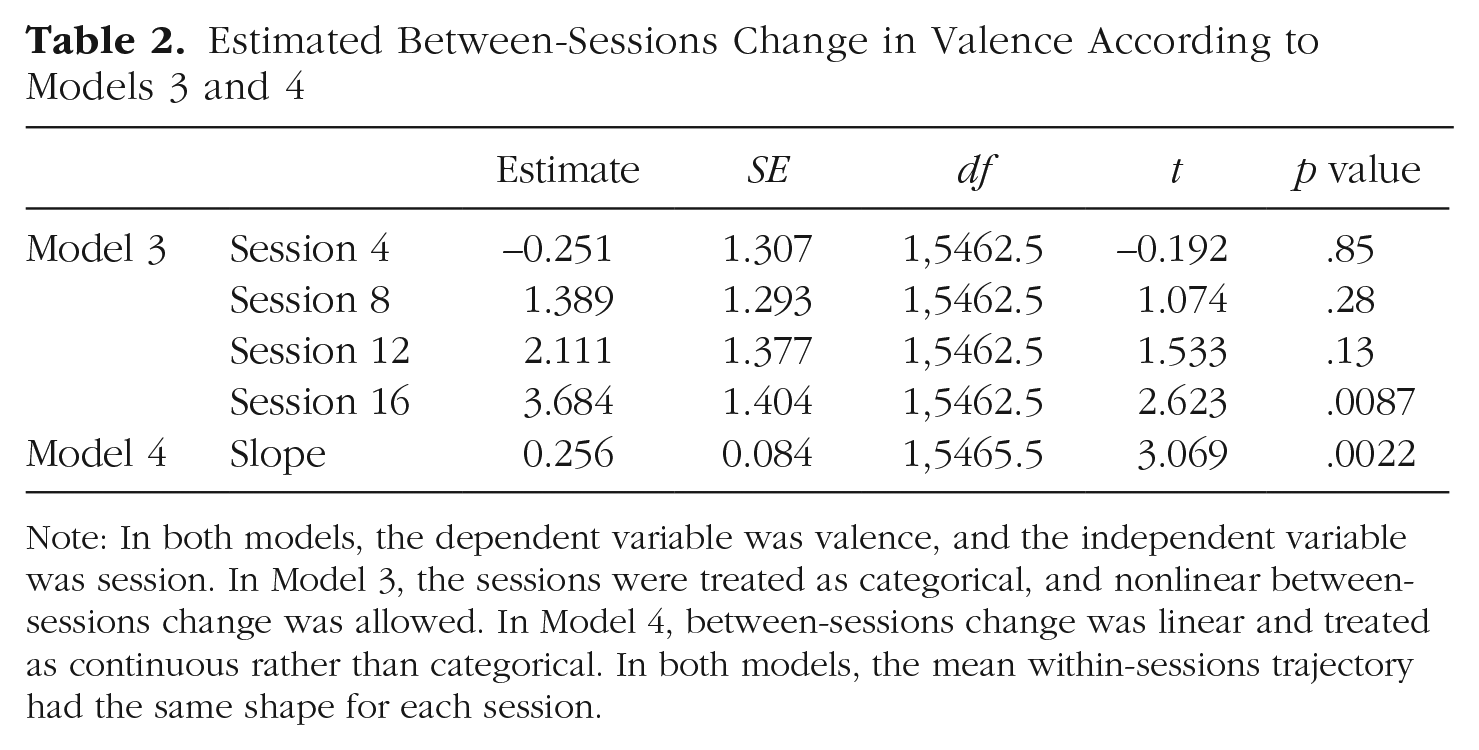
Note: In both models, the dependent variable was valence, and the independent variable was session. In Model 3, the sessions were treated as categorical, and nonlinear between-sessions change was allowed. In Model 4, between-sessions change was linear and treated as continuous rather than categorical. In both models, the mean within-sessions trajectory had the same shape for each session.
The above results indicate that on average, the valence followed a U-shaped trajectory within sessions and tended to increase between sessions. This prompted us to investigate whether there was an association between U-shaped within-sessions change and between-sessions increase. To address this question, we considered a variant of Model 4 with a more complex random-effects structure than Equation 5. This structure used orthogonal linear and quadratic functions

where bi is subject i’s random deviation from the mean slope with respect to session and w1i, w2i are within-sessions linear and quadratic random effects; the remaining terms are as in Model 5. The purpose of this nonstandard random-effects structure was to extract the quadratic random effect w2i for each subject, a measure of the average “U-shapedness” of subject i’s within-sessions valence trajectory. The random effects bi, w1i, w2i were assumed to be jointly normal with mean of zero and not necessarily independent of each other, thus allowing us to assess whether bi, which captures subject i’s between-sessions change in valence, was correlated with w2i, the U-shapedness measure for subject i. In other words, this correlation measures whether patients who exhibited a stronger within-sessions pattern of decrease followed by an increase also exhibited a greater between-sessions increase in valence. This correlation between the within-sessions random quadratic effect w2i and the between-sessions random effect bi was found to be 0.77. Although this would ordinarily be considered a very high correlation, we note that correlations between different random effects in linear mixed-effect models are not accompanied by p values and can be somewhat unstable. Therefore, we tested the positive correlation’s stability by refitting the above model in 1,000 bootstrap samples (Tibshirani & Efron, 1993). In 50 of these models, the estimated variance of the between-sessions random effects bi was 0; hence, the correlation estimate was undefined. For 851 of the remaining 950 models (89.6%), the correlation was positive, yielding a two-sided p value of .20 for the null hypothesis of zero correlation.
Finally, estimates of the coefficient function
Discussion
In the present study, we examined emotional avoidance, a primary mechanism underlying MDD, by delineating trajectories of change in emotions within and between sessions of psychological treatment for patients diagnosed with MDD. To the best of our knowledge, this is the first study to apply automatic coding of facial expressions and advanced statistical methods to explore these processes.
The results demonstrated that distinct and even opposite patterns of emotional change exist in the same data set depending on the temporal time frame of analysis. Consistent with the hypotheses, within a session, on average, the patients manifested a decrease in valence (more negative and fewer positive emotions) from the beginning to the middle of the session, followed by an increase in positive valence toward the end of the session. Alongside the temporary decrease in valence during the sessions, patients exhibited a consistent increase in valence throughout treatment.
Theoretically (e.g., S. C. Hayes et al., 1996), this pattern of change in emotions within and between sessions is consistent with the conceptualization of the emotional-avoidance model, which posits that over time, less recourse to emotional-avoidance strategies to regulate emotions may increase negative emotions in the short term but dampen the experience of negative emotions and facilitate the experience of positive ones in the long term. These results underscore the importance of overcoming emotional avoidance by showing that approaching negative emotions in the short term during treatment sessions may be beneficial in the long term for reducing negative emotions and increasing positive emotions. These changes are particularly crucial for patients diagnosed with MDD, who suffer from emotional disturbances and difficulties regulating emotions (Gross & Jazaieri, 2014).
This pattern of change in emotions closely resembles findings on the behavioral concept of habituation (Foa & Kozak, 1986; Mendolia & Kleck, 1993). “Habituation” broadly refers to a decline in response strength after repeated exposure to a stimulus. Previous studies addressing this concept in the context of negative emotions have suggested that repeated exposure to negative emotions results in a reduced response to such emotions through the process of habituation (Hunt, 1998; Low et al., 2008; Pascual-Leone et al., 2016). In these studies, participants were assigned to either emotional or control writing tasks following the induction of a distressing mood. Similar to the current findings, compared with the control group, participants in the study group manifested more negative emotional reactions immediately after the writing task but lesser reactions in subsequent assessments. The researchers argued that these emotional changes represent a process of activation and habituation of emotional responses across repeated presentations of a stressor (Hunt, 1998; Low et al., 2008). Thus, the current results lend weight to the recent suggestion that these principles of the habituation model can be applied to the treatment of MDD as well (A. M. Hayes et al., 2015).
In terms of the association between the U-shape valence trajectory and patients’ reports of their positive emotions, the results suggested that when patients experienced more negative emotions in the middle of the session and more positive emotions at the end of the sessions, they retrospectively reported having more positive emotions during the session. This finding may suggest that patients perceived positive emotions were more influenced by the process of emotion modification—in which negative emotions are transformed into positive ones—than by the actual expression of positive emotions (Berking et al., 2008). Alternatively, this finding may also imply that as a result of the regulation process, the way patients prospectively perceive these emotions undergoes a change, in addition to the felt changes in emotions. This finding also echoes the peak-end rule originally introduced by Kahneman et al. (1993), which states that people retrospectively evaluate subjective affective experiences by averaging the worst and the end of the experience. Similar findings were found in recent study in which acoustic features were extracted from couples’ conversations to identify their emotions at the end of these sessions (Boateng et al., 2020). In the current study, patients’ reports of negative emotions were not associated with changes in their expression of emotions during that session. If replicated in future studies, this finding may hint that one of the benefits of expressing negative emotions lies in making room for a greater perceived experience of positive emotions (Gleiser et al., 2008).
Finally, the results showed that when the valence was relatively low at the beginning of the session and increased toward the end of the session, this pattern predicted a decrease in depressive symptoms. This finding strengthens the theoretical assumption that expressing negative emotions during therapy sessions provides patients with an opportunity to modify and regulate their emotions, which may result in a reduction of depressive symptoms (Berking et al., 2008). Previous studies have relied on self-report measures administered after the session and found that improved emotion regulation was associated with a decrease in symptoms (e.g., Enrique et al., 2021). The current study is the first to use artificial-intelligence-based facial-expression analysis to study emotional dynamics, thus making it possible to track this dynamic as it unfolds during the session.
This study has several limitations that should be considered when interpreting the results. The primary limitation was the small sample size, which may have contributed to the weak association between in-session facial expressions and the patients’ retrospective self-reports. In addition, the naturalistic setting of the study and the specific naturalistic type of data and measurement resulted in a significant amount of missing data. Limited resources also prevented us from analyzing all the sessions. However, a pilot study was conducted in which all the sessions of one patient were coded. The analyses revealed similar patterns of change in valence within and between sessions, which supports the generalizability of the results. Furthermore, the approach used to measure emotions, specifically valence, may be unable to disentangle positive from negative emotions and different type of negative emotions, making it difficult to determine the specific emotional experience. Finally, emotions were measured through only the single modality of facial expressions. Future studies should integrate additional indicators, such as the measurement of heart rate, to fully and more accurately capture the nonverbal expression of emotions (Sloan & Kring, 2007). If replicated in future studies, the present findings can be harnessed to advance theories of emotions in psychopathology and point to novel interventions that can guide therapists and improve mental health. Future studies could also explore how other treatment processes affect the patterns of emotions observed during the therapy sessions. For instance, studies could investigate how the therapeutic alliance influences the experience of positive or negative emotions at different points in the session, such as feeling more positive emotions at the start of the session when first engaging with the therapist or feeling more comfortable expressing negative emotions as the participants build trust with their therapist (Fisher et al., 2016).
Overall, the findings indicated that patients manifested a short-term decrease and a long-term increase in valence during psychological treatment for depression. In addition, when patients displayed a pattern of heightened negative facial expressions followed by an increase in positive emotions during therapy sessions, they also reported feeling more positive emotions during the session and had a subsequent reduction in depressive symptoms. These findings underscore the significance of allowing patients to confront their negative emotions as a means of enhancing their emotion-regulation capabilities and facilitating the amelioration of depressive symptoms.
Supplemental Material
sj-docx-1-cpx-10.1177_21677026231195793 – Supplemental material for Facing Emotions: Between- and Within-Sessions Changes in Facial Expression During Psychological Treatment for Depression
Supplemental material, sj-docx-1-cpx-10.1177_21677026231195793 for Facing Emotions: Between- and Within-Sessions Changes in Facial Expression During Psychological Treatment for Depression by Hadar Fisher, Philip T. Reiss, Dovrat Atias, Michal Malka, Ben Shahar, Simone Shamay-Tsoory and Sigal Zilcha-Mano in Clinical Psychological Science
Footnotes
Transparency
Action Editor: Pim Cuijpers
Editor: Jennifer L. Tackett
Author Contribution(s)
Notes
References
Supplementary Material
Please find the following supplemental material available below.
For Open Access articles published under a Creative Commons License, all supplemental material carries the same license as the article it is associated with.
For non-Open Access articles published, all supplemental material carries a non-exclusive license, and permission requests for re-use of supplemental material or any part of supplemental material shall be sent directly to the copyright owner as specified in the copyright notice associated with the article.