
Abstract
Understanding eating-pathology development may enable meaningful prescriptions for its prevention. Here, we identified common trajectories of eating-pathology development and the personality factors associated with these trajectories. Participants were 760 female twins from the Minnesota Twin Family Study who reported on eating pathology at approximate ages 11, 14, 18, 20, 24, and 29. Parents reported on twins’ personality characteristics at age 11, and twins completed self-report personality questionnaires at ages 14 and 18. Latent class growth analysis identified two distinct trajectories for total eating pathology, binge eating, and weight preoccupation and three distinct trajectories for body dissatisfaction. Girls with more pathological trajectories already showed elevated eating pathology at age 11. These subgroups of high-risk girls self-reported greater proneness to anxiety, stress, and alienation, and less sociable personality styles. Prevention efforts may be enhanced by using self-reported personality traits to identify girls at high risk for eating pathology.
Keywords
Eating disorders are among the deadliest and most difficult to treat of psychiatric disorders (Arcelus et al., 2011; van Hoeken & Hoek, 2020). Below the threshold of clinical diagnosis, eating pathology may include binge eating, defined as eating large quantities of food coupled with loss of control; compensatory behavior, defined as inappropriate weight-control behaviors, such as self-induced vomiting, laxative use, excessive exercise, and fasting after a binge; body dissatisfaction, characterized by discrepancies between one’s perceived and ideal body weight, shape, or overall appearance; and weight preoccupation, defined as persistent overconcern with body weight (Luo et al., 2016). Unfortunately, subthreshold eating pathology is both common and harmful (Crow et al., 2002). For example, body dissatisfaction has been estimated to affect 11% to 72% of girls and women (Roy & Payette, 2012) and has been linked to a wide range of adverse outcomes, including anxiety and depression (Davison & McCabe, 2005; Murray et al., 2018), initiating cigarette use (Howe et al., 2017), avoidance of social interactions (Mills et al., 2014), lower likelihood of receiving cancer screenings and completing breast self-examinations (Ridolfi & Crowther, 2013), and overall poorer physical- and mental-health-related quality of life (Griffiths et al., 2017; Wilson et al., 2013). Unfortunately, programs designed to improve body image and prevent eating pathology have demonstrated only modest benefits, with effects that are typically short-lived and small in magnitude (Kusina & Exline, 2019).
Development of eating pathology
Understanding how and among whom eating pathology develops may enable meaningful prescriptions for its prevention. Specifically, there may be sensitive periods during which body image and eating pathology change more rapidly and are more responsive to intervention (Arango et al., 2018). Prior research has described adolescence, specifically ages 12 to 18, as such a period (Voelker et al., 2015; Wertheim & Paxton, 2011) because it coincides with puberty and greater sensitivity to intervention. Consistent with such an understanding, Slane et al. (2014) examined 745 female twins (the same sample as the present study) and found an average pattern of increases in eating pathology from 11 to 25 years. Additional longitudinal research has provided evidence of similar developmental trends (Bucchianeri et al., 2013; Rohde et al., 2015).
More recently, researchers have applied statistical techniques such as latent class growth analysis (LCGA), enabling more nuanced descriptions of heterogeneous individual trajectories of body-image development and uncovering individual differences in eating-pathology development that are obscured when samples are described in terms of a single average pattern. For example, Rodgers et al. (2016) studied adolescent girls from around ages 13 to 14 and within this short developmental period, identified four common trajectories of body dissatisfaction: stable high (9.3%), moderate-increasing (16.6%), moderate-decreasing (30.9%), and stable low (43.2%). Wang et al. (2019) studied boys and girls from ages 15 to 31 and identified four common trajectories similar to those identified by Rodgers et al. Lacroix et al. (2020) studied boys and girls from ages 11 to 15 and identified three trajectories: high body esteem (39.1%), moderate body esteem (46.1%), and low body esteem (14.8%), each trajectory characterized by largely stable body esteem across these years.
Personality characteristics and eating-pathology development
A potentially important yet underexplored predictor of eating-pathology development is personality, the patterns of thinking, feeling, and behaving that encompass both character traits and predispositions toward positive- and negative-affect states (Farstad et al., 2016; Pervin, 2000). Negative emotionality, analogous to the trait of neuroticism within the Big Five model (McCrae & Costa, 2008), is defined as the propensity toward experiencing negative emotions such as fear, sadness, and anger (Shiner et al., 2021, p. 119). In a meta-analytic review, traits related to negative emotionality emerged as the strongest personality predictors of eating-disorder diagnosis (Hedges’s g = 0.78; Dufresne et al., 2020). Among 16- to 19-year-old boys and girls, Presnell et al. (2004) identified self-reported negative emotionality as a predictor of body dissatisfaction measured 9 months later. Contrastingly, Martin et al. (2000) found that negative emotionality at ages 11 to 12 predicted higher drive for thinness and bulimia symptoms at ages 13 to 14 but was only cross-sectionally related to body dissatisfaction. In another longitudinal study that examined boys and girls from approximately ages 11 to 15, negative emotionality failed to emerge as a significant predictor of body-esteem trajectories, but higher levels of positive emotionality (i.e., the tendency to more frequently experience positive emotions) were protective (Lacroix et al., 2020). One study that employed a laboratory paradigm to assess negative and positive emotionality in younger boys and girls found that higher negative emotionality at age 6 predicted higher levels of body dissatisfaction at age 12; however, higher levels of positive emotionality also predicted higher body dissatisfaction (Bufferd et al., 2022). Indeed, positive-affect dysregulation has been identified as a maintenance factor that contributes to anorexia nervosa (Coniglio et al., 2019). Beyond negative and positive emotionality, other personality factors that have been linked to eating-pathology development are perfectionism (Kehayes et al., 2019), negative urgency (i.e., the tendency to act impulsively in an attempt to alleviate intense negative affect; Puccio et al., 2019), and constraint (i.e., behavioral control; Steinglass et al., 2019), to name a few.
Disparate findings regarding the prospective link between personality and eating-pathology development may be explained by a combination of factors, including methodological differences (e.g., the constructs examined, the measures used, when data were collected, and how much time elapsed between data-collection intervals) and sample characteristics (e.g., sample age, size, gender composition, and attrition rates). Carefully designed longitudinal studies may help better represent the process of eating-pathology development. To reconcile conflicting findings, it may be informative to characterize the individualized trajectories that are obscured when only global average development is examined and to expand beyond negative emotionality, exploring the potentially predictive roles of a wider array of personality traits.
Beyond these measurement challenges, additional biological and socioeconomic factors also merit consideration. Adiposity, typically operationalized by the body mass index (BMI; kg/m2), 1 is known to play a role in the development of eating pathology such that increases in BMI are associated with increases in body dissatisfaction during adolescence and young adulthood (Bucchianeri et al., 2013). Pubertal development has been shown to exert a similar influence such that early pubertal timing has been associated with increased eating pathology among girls (Klump, 2013; Shope et al., 2022). There is emerging evidence for small associations between pubertal development and personality maturation: early pubertal timing has been linked to lower self-reported extraversion (i.e., the tendency to be sociable, active, and feel positive emotions), conscientiousness (i.e., the tendency to be diligent, committed, and self-disciplined), and agreeableness (i.e., the tendency to be trusting, sympathetic, and cooperative; Fry & Debats, 2009; Van den Akker et al., 2021). Finally, with increasing recognition of the importance of social determinants of mental health (Allen et al., 2014), there is a need to model and control for variables such as socioeconomic status (SES). By demonstrating that eating disorders present across all socioeconomic backgrounds, reviews have refuted the stereotype that eating disorders are “diseases of affluence” (Huryk et al., 2021; Mitchison & Hay, 2014). However, these findings are based on studies that examined global patterns of association, and it is unknown whether SES tends to differ among people who display riskier versus more positive trajectories of eating-pathology development.
Current Study
Using data from the Minnesota Twin Family Study (MTFS; Iacono & McGue, 2002), a longitudinal study of twins and their parents, in the current study, we aimed to identify common trajectories of eating pathology over a 17-year period from late childhood ending in adulthood and describe the personality characteristics of individuals who exhibit these trajectories. On the basis of a previous examination of our sample (Slane et al., 2014), we hypothesized that global average trajectories of eating-pathology development would be characterized by increases in total eating pathology, body dissatisfaction, and weight preoccupation over time, at least until age 25 (i.e., the last follow-up time point in Slane et al., 2014). Whereas Slane et al. (2014) examined only a single average trajectory for each eating-pathology outcome, we used LCGA to identify the most common trajectories for each type of eating pathology. We hypothesized that for each type of eating pathology examined, LCGA would reveal multiple developmental trajectories that deviated from global average patterns of development. LCGA does not test a priori predictions about the shape of individual trajectories; accordingly, we did not have specific hypotheses about the precise shapes of individual trajectories. Controlling for BMI, pubertal development, and SES, we explored the influence of personality traits to determine whether trajectory membership could be predicted by personality traits reported by parents at age 11 or self-reported at ages 14 and 18. We hypothesized that participants with more pathological trajectories of eating pathology would have higher levels of self- and parent-reported negative emotionality traits at ages 11, 14, and 18. The potential predictive roles of other personality traits were examined in an exploratory manner.
Describing trajectories and personality predictors of eating-pathology development can enable meaningful prescriptions to enhance the effectiveness of prevention efforts. For example, understanding patterns of body-image development in high-risk subgroups can inform decisions about the timing of intervention delivery. In addition, identifying personality traits that predict problematic trajectories (e.g., high or increasing eating pathology) may inform the design of personality-targeted prevention programs, which have demonstrated effectiveness in other areas of adolescent mental health, such as the prevention of substance misuse (Edalati & Conrod, 2018).
Transparency and Openness
This study was not preregistered. This study involved an analysis of existing data rather than new data collection. We report how we determined data exclusions and obtained scores for all measures in the study. Sample Mplus code has been provided in the Supplemental Material available online. Secondary use of the data was approved under the University of Calgary Conjoint Faculties Research Ethics Board: REB20-0235.
Method
Participants
Participants were 760 female twins (i.e., 380 twin pairs) who took part in the MTFS (Iacono & McGue, 2002), an ongoing prospective study of same-sex twins reared in the same household and their parents. A large body of evidence suggests that twin research may be reliably generalized to singletons—this includes research on eating disorders in particular (Munn-Chernoff et al., 2013). The MTFS is a population-based study: public records were used to identify twins born in the state of Minnesota, more than 90% of twins born between 1971 and 1985 were located, and 83% of all eligible families agreed to participate (Blonigen et al., 2008). The twins were broadly representative of the Minnesota population at the time they were born (Iacono & McGue, 2002): approximately 60% came from the Minneapolis-St. Paul urban area, whereas the remainder were from rural areas and smaller cities. Nearly all participants (> 95%) were White. Participating twins and their families completed follow-up assessments at roughly 3-year intervals, yielding a data set with assessments at six waves: ages approximately 11, 14, 18, 21, 25, and 29 years. The retention rate at the final time point (i.e., over a 17-year follow-up period) was 89.2%; 79.9% provided relevant personality and eating-pathology data.
Measures
Primary outcomes
At each wave of data collection, twins completed the Minnesota Eating Behavior Survey (MEBS; Klump et al., 2000; von Ranson et al., 2005), 2 a 30-item true/false self-report questionnaire. The MEBS yields a total score of overall disordered-eating attitudes and behaviors and four subscales: body dissatisfaction, compensatory behavior, binge eating, and weight preoccupation. Previous examinations of the MEBS’s psychometric properties yielded evidence of internal consistency, convergent validity, and criterion validity (von Ranson et al., 2005). For participants missing responses to one or fewer items on a subscale, items were averaged to yield prorated subscale scores. For the total score, for participants with 10% or less data missing (i.e., three or fewer items), items were averaged to yield a prorated total score.
For the purposes of growth modeling, too few participants endorsed items on the compensatory-behavior subscale. Specifically, across waves, the numbers of participants who reported compensatory behaviours was between n = 43 participants or 6.2% of the sample at age 11, and n = 112 participants or 18.2% of the sample at age 18. At all waves, most (i.e., 65.1%–76.7%) of the participants who reported any compensatory behaviors endorsed only a single item, indicating very low levels of compensatory behavior. Scores on this scale contributed to participants’ MEBS total scores but were not included in growth models. For internal consistency for predictor and outcome variables at each wave of data collection, see Table S1 in the Supplemental Material. Cronbach’s α values ranged from .86 to .92 for the total score, from .72 to .83 for body dissatisfaction, from .67 to .84 for binge eating, and from .78 to .90 for weight preoccupation. We also examined temporal stability of the MEBS subscales: all MEBS subscales had positive correlations among survey waves (total score: rs = .34–.73; body dissatisfaction: rs = .33–.68; binge eating: rs = .12–.58; weight preoccupation: rs = .33–.67; p < .001); the highest correlations were observed between ages 25 and 29.
Predictors
Personality
Personality was assessed at ages 11, 14, and 18 using three versions of the Multidimensional Personality Questionnaire (MPQ; Tellegen & Waller, 2008). The full-length MPQ examines 10 traits (i.e., primary scales) loading on three higher-order factors; we examined all traits for which MPQ data were available. The three factors are (a) positive emotionality, which includes the primary trait scales of achievement (diligence, enjoyment of demanding projects, and valuing work), well-being (tendency to have a cheerful disposition, be optimistic, and live an active and exciting life), social potency (persuasiveness, decisiveness, tendency to prefer to take charge), and social closeness (tendency to be sociable, enjoy others’ company, and value relationships); (b) negative emotionality, which includes the primary trait scales of alienation (tendency to be suspicious of others’ motives, feel they are treated unfairly, and see oneself as a victim), aggression (tendency to be competitive, intimidate others, and seek revenge), and stress reaction (tendency to be sensitive, irritable, and prone to worry and guilt); and (c) constraint, which includes the primary trait scales of traditionalism (tendency not to challenge authority and to value high moral standards and a conservative social order), harm avoidance (tendency to prefer safe and tedious to potentially risky and exciting tasks), and control (tendency to be reflective, rational, cautious, and to plan ahead).
At age 11, parents completed a 33-item informant report version (Harkness et al., 1995) of the MPQ about each twin. In this version, three items load onto each of the 10 MPQ trait scales of interest. With three exceptions (i.e., six twins; 0.78% of data set), biological mothers provided reports on their children. Each question was rated on a scale from 1 to 4 (1 = my daughter is definitely low on this trait, 2 = my daughter is probably low on this trait, 3 = my daughter is probably high on this trait, 4 = my daughter is definitely high on this trait). Given that only three items loaded onto each scale, these data were not prorated, so missing items led to missing scale scores.
At age 14, twins completed a 133-item self-report version of the MPQ. This abbreviated version omits four scales (achievement, social potency, social closeness, traditionalism), but the items and scale composition are otherwise identical to the full-length MPQ; 18 items load onto each of the six trait scales. At age 18, twins completed the 198-item self-report version of the MPQ (Tellegen & Waller, 2008); 18 items load onto each of the 10 trait scales of interest on this version. At ages 14 and 18, we prorated trait scale scores of participants who were missing responses to two or fewer items on a given trait scale. For consistency, trait scales at ages 14 and 18 were transformed to be on a scale of 3 to 12, the same as for age 11.
Internal consistency of personality trait scales was lowest at age 11 (i.e., parent responses to the 33-item MPQ, which has three items per subscale): for this version, Cronbach’s α values ranged from .52 to .57. Cronbach’s α values were higher for the age-14 and age-18 self-report versions of the MPQ (age 14: αs = .85–.90; age 18: αs = .83–.91). Low Cronbach’s α values for the MPQ at age 11 could be attributed to several factors: the smaller numbers of scale items (Vaske et al., 2017), the lower stability of personality at younger ages (Bleidorn et al., 2022), or the fact that this scale was administered to parent informants rather than the participants themselves. For the intercorrelations among parent-reported personality traits at age 11 and self-reported personality traits at age 14, see Table S2 in the Supplemental Material. For the traits of well-being, alienation, aggression, stress reaction, harm avoidance, and control, which were assessed at both time points, these correlations were small to moderate (rs = .15–.34) and all significant (p < .05). These values were somewhat lower than those obtained in a prior study that compared self-reports and parent reports for university students (Harkness et al., 1995), as would be expected given the younger age of our sample. The pattern of correlation strength reported by Harkness et al. (1995) was similar to what we observed in the current study, with the highest interrater correlations for the traits of control and harm avoidance, and lower correlations for aggression and alienation.
Trait anxiety
The Trait scale of the State-Trait Anxiety Measure for Children (STAI-CH; Spielberger, 1973) was used to assess individual differences in proneness to anxiety, also described as “temporally stable anxiety across situations” (Muris et al., 2002). At age 11, children self-reported the frequency with which they experienced 20 anxiety-related symptoms on a scale from 1 (hardly ever) to 3 (often). The STAI-CH has demonstrated internal consistency and convergent and discriminant validity in nonclinical adolescent samples (Muris et al., 2002); it also discriminates well between youths with and without anxiety disorders (Seligman et al., 2004). For participants with 10% or less data missing (i.e., two or fewer items), items were averaged to yield a prorated total score. In our sample, Cronbach’s α for the Trait scale of the STAI-CH was .83.
Control variables
BMI
Height and weight were measured at each study visit, allowing for the calculation of BMI.
SES
We used parent-reported household income at baseline as an indicator of SES. Income was entered as an ordinal variable; 13 categories in ordered denominations ranged from less than $10,000/year to more than $80,000/year.
Pubertal development
The Pubertal Development Scale (PDS; Petersen et al., 1988) is an interview measure designed to assess Tanner stages of pubertal development. The PDS assesses changes in four secondary sex characteristics on a 4-point scale from 1 (development has not yet begun) to 4 (development seems completed); menarche is rated dichotomously as absent (1) or present (2). Total scores on the PDS range from 4 to 18. Longitudinal examinations of the PDS’s psychometric properties in community samples have provided evidence of internal consistency (Cronbach’s α range = .68–.83, Mdn = .77), sensitivity to developmental change, and convergent validity, evidenced by high correlations with physician and interviewer ratings and measured height (Petersen et al., 1988). Variability in pubertal development is low in girls past age 15, and more than 99% of girls over this age are postpubertal (T. Wu et al., 2002). Accordingly, the PDS was administered at only the first and second waves of data collection. In our sample, Cronbach’s αs for the PDS were .73 at age 11 and .60 at age 14.
Data analyses
Missing data
Little’s (1988) missing completely at random test indicated that data were missing completely at random, χ2(5874) = 1,971.67, p = 1.00. We used the hybrid approach outlined by Wu et al. (2022) to handle missing data: We first used proration to calculate the scale scores for participants missing 10% or fewer of item scores, as detailed in the Measures section. Following proration, the proportions of missing data were as follows across survey waves: eating pathology (MEBS) missing between 6.7% (n = 51) and 16.3% (n = 124) of data, personality (MPQ) missing between 14.8% (n = 113) and 17.2% (n = 131) of data, trait anxiety (STAI-CH) missing 2.9% (n = 22) of data, BMI missing between 2.8% (n = 21) and 14.8% (n = 113) of data, SES missing 0.7% (n = 5) of data, and pubertal development (PDS) missing 8.9% (n = 68) of data at age 11 and 3.9% (n = 30) at age 14. When too many items were missing to meet the proration cutoff, full information maximum likelihood (FIML) estimation handled missing data at the scale level, which ensured individuals with missing scale data could be included in analyses. FIML has demonstrated superiority to multiple imputation (Larsen, 2011), and this hybrid approach has been applied previously (Anderson, 2022; Oppermann et al., 2023).
LCGA: overview
We used LCGA to identify the most common trajectories of disordered-eating development from ages 11 to 29. Conventional growth-curve modeling approaches assume that individual participants come from a single population and that a single growth trajectory can adequately approximate an entire population, potentially failing to capture the diverse and complex patterns of change over time among members of different subgroups (Jung & Wickrama, 2008). Conversely, LCGA acknowledges that different subpopulations may be characterized by different growth patterns and that not all individuals change in the same direction or at the same rate. LCGA is a person-centered and data-driven analysis approach in which the goal is to classify individuals into groups so that individuals within a group are more similar than individuals between groups (Jung & Wickrama, 2008) without making a priori assumptions about the shape of developmental trajectories (Preacher, 2010).
All models were fitted in Mplus (Version 8; L. K. Muthén & Muthén, 2007) using 500 final iterations and 20 random start values with age 11 (baseline) fixed as the centering point. We used the Mplus cluster option to account for nonindependence of observations within twin pairs, assigning the family as the cluster unit. This method has been shown to successfully correct for family resemblance or dependency in phenotypic twin and family data irrespective of the source of such dependency (genetic or environmental; Rebollo et al., 2012) and has been used extensively in previous longitudinal twin studies (e.g., Lyons et al., 2017; Neumann et al., 2011; Wichers et al., 2013).
Global average eating-pathology development
We fitted single average growth models of MEBS total and subscale scores, adding terms to estimate the intercept (i.e., initial level of the eating-pathology outcome), slope (i.e., linear change in eating pathology over time), quadratic (i.e., an upturn or downturn in eating pathology, beyond linear change), and cubic (i.e., a second inflection in eating-pathology levels over time) parameters in a stepwise manner. In this step, we also examined the influence of potential control variables as assessed at baseline, establishing whether these variables were associated with any of our parameters. We examined model fit using the following model-fit cutoff values, suggested by Hu and Bentler (1999): standardized root mean squared residual (SRMR) close to .08 or below, root mean square error (RMSE) values close to .06 or below, and comparative fit index (CFI) and Tucker-Lewis index (TLI) values close to .95 or greater. Mplus tests of model-fit computations are robust to violations of normality and independence of observations (B. Muthén et al., 2006).
Identification of eating-pathology trajectories
We conducted LCGA to identify the most common trajectories of MEBS total and subscale scores, controlling for BMI, pubertal development, and SES as needed (established by the results of the previous step). The variance and covariance estimates for the growth factors within each class were fixed to zero, as is standard in LCGA models, which assume homogeneity of individual growth trajectories within classes. In line with previous recommendations (Jung & Wickrama, 2008; Nylund et al., 2007), LCGA proceeds by running, in a stepwise manner, models with an increasing number of class solutions (i.e., trajectories). To determine the optimal number of trajectory classes, we compared each increasingly complex model with its precedent by examining Bayesian information criteria (BIC) values and classification accuracy (i.e., entropy) and employing the Lo et al. (2001) likelihood ratio test and the rule of thumb that no class should contain less than 5% of the full sample (Delucchi et al., 2004). For each eating-pathology variable, we ceased to examine increasing class solutions once the more complex models failed to improve fit and classification accuracy or yielded underpopulated classes.
Comparison of predictor levels across classes
We conducted pairwise χ2 comparison tests to examine whether levels of predictor variables differed among people categorized into different eating-pathology trajectories. These comparisons were added to the best-performing trajectory models that we identified in the previous step.
Predictors of eating-pathology trajectories
For each eating-pathology variable, we conducted multinomial logistic regressions to examine whether the most likely trajectory class membership (i.e., the categorical outcome) could be predicted by personality and trait anxiety variables measured at ages 11, 14, and 18; we report odds ratios and 95% confidence intervals for these results. To avoid controlling for inappropriate variables, which can bias the results of regression analyses and inflate Type I error rates (Wysocki et al., 2022), we included in these regressions only the personality variables that had been shown in the previous set of analyses to differ across each respective eating-pathology class.
Results
Global average eating-pathology development
We first examined global mean-level longitudinal trends in eating pathology across our sample. We fitted a series of increasingly complex growth models for the MEBS total score and three subscales, capturing changes in eating pathology from ages 11 to 29. We first estimated only the intercept and then added the slope, quadratic, and cubic terms in a stepwise manner.
For fit statistics of baseline models depicting single growth curves, see Table S3 in the Supplemental Material. For the MEBS total score and the body dissatisfaction, fit was maximized in the most complex models in which all four growth parameters were estimated. For the binge-eating and weight-preoccupation subscales, fit was maximized in the model in which only the intercept, slope, and quadratic terms were estimated. In subsequent models for MEBS total score and body dissatisfaction, we estimated all four growth parameters, whereas models for binge eating and weight preoccupation estimated only the intercept, slope, and quadratic terms. In line with our hypotheses, global average trajectories were characterized by increases in total eating pathology, body dissatisfaction, and weight preoccupation between ages 11 and 29. Binge eating was infrequently reported and showed minor fluctuations over time.
Next, we added the covariates of baseline BMI, pubertal development, and SES to the best-fitting models identified above. These analyses informed if and how these candidate control variables were incorporated in subsequent analyses. For MEBS total and body-dissatisfaction scores, there were significant effects of BMI on intercepts (total MEBS: B = 0.51, SE = 0.05, p < .001; body dissatisfaction: MEBS: B = 0.66, SE = 0.05, p < .001), indicating an association of higher BMI with higher total MEBS scores and higher levels of body dissatisfaction at baseline. There were also significant effects of SES on the slope (total MEBS: B = 0.28, SE = 0.10, p < .01; body dissatisfaction: MEBS: B = 0.34, SE = 0.10, p < .01), quadratic (total: MEBS: B = −0.50, SE = 0.19, p < .01; body dissatisfaction: MEBS: B = −0.63, SE = 0.14, p < .001), and cubic (total MEBS: B = 0.76, SE = 0.30, p < .05; body dissatisfaction: MEBS: B = 0.96, SE = 0.10, p < .001) terms, indicating an association of higher SES with greater growth in MEBS total scores and body dissatisfaction over time. There were also significant effects of BMI on the intercepts of binge eating (B = 0.22, SE = 0.08, p < .01) and weight preoccupation (B = 0.53, SE = 0.05, p < .001), indicating that individuals with higher BMI at baseline tended to have higher levels of these symptoms at baseline. There were no significant effects of pubertal-development scores on any of the growth parameters. Subsequent models controlled for the influence of BMI on intercepts and the effect of SES on slope, quadratic, and cubic terms. Given the lack of significant effects of pubertal development, we did not control for the influence of this variable. Figure 1 depicts global average trajectories of the MEBS total and subscale scores controlling for BMI and SES.

Average eating-disorder-psychopathology trajectories of total sample (SE). On the y-axis, values ranged from 0 to 28 for total scores, from 0 to 8 for weight preoccupation, from 0 to 6 for body dissatisfaction, and from 0 to 7 for binge eating. In these trajectories, we controlled for the influence of body mass index and socioeconomic status. MEBS = Minnesota Eating Behavior Survey.
Identification of eating-pathology trajectories and associated personality differences
For fit indices of LCGA models with one to four trajectories controlling for BMI and SES, see Table S4 in the Supplemental Material. Four-class solutions did not yield improvements over three-class solutions for any eating-pathology outcomes; thus, we did not examine solutions of five or more classes. As expected, LCGA revealed multiple trajectories of total eating pathology, body dissatisfaction, binge eating, and weight preoccupation. Two-class solutions performed best for the MEBS total scale and the binge-eating and weight-preoccupation subscales; a three-class solution performed best for the body-dissatisfaction subscale.
All models converged on replicated solutions. The class solutions described below provided optimal balances of fit and entropy and had no underpopulated classes. Trajectories are depicted in Figure 2, and estimates of growth parameters for each of the trajectories are presented in Tables 1 through 4. Significant intercept terms indicate significantly different levels of the eating-pathology outcome at baseline, significant slope terms indicate significant increases or decreases in the outcomes over time, and significant quadratic and cubic terms indicate either one or two significant inflections (i.e., changes in the direction of change over time). Pairwise χ2 tests revealed significant personality differences depending on eating-pathology-trajectory membership; these differences are described in the subsections that follow.
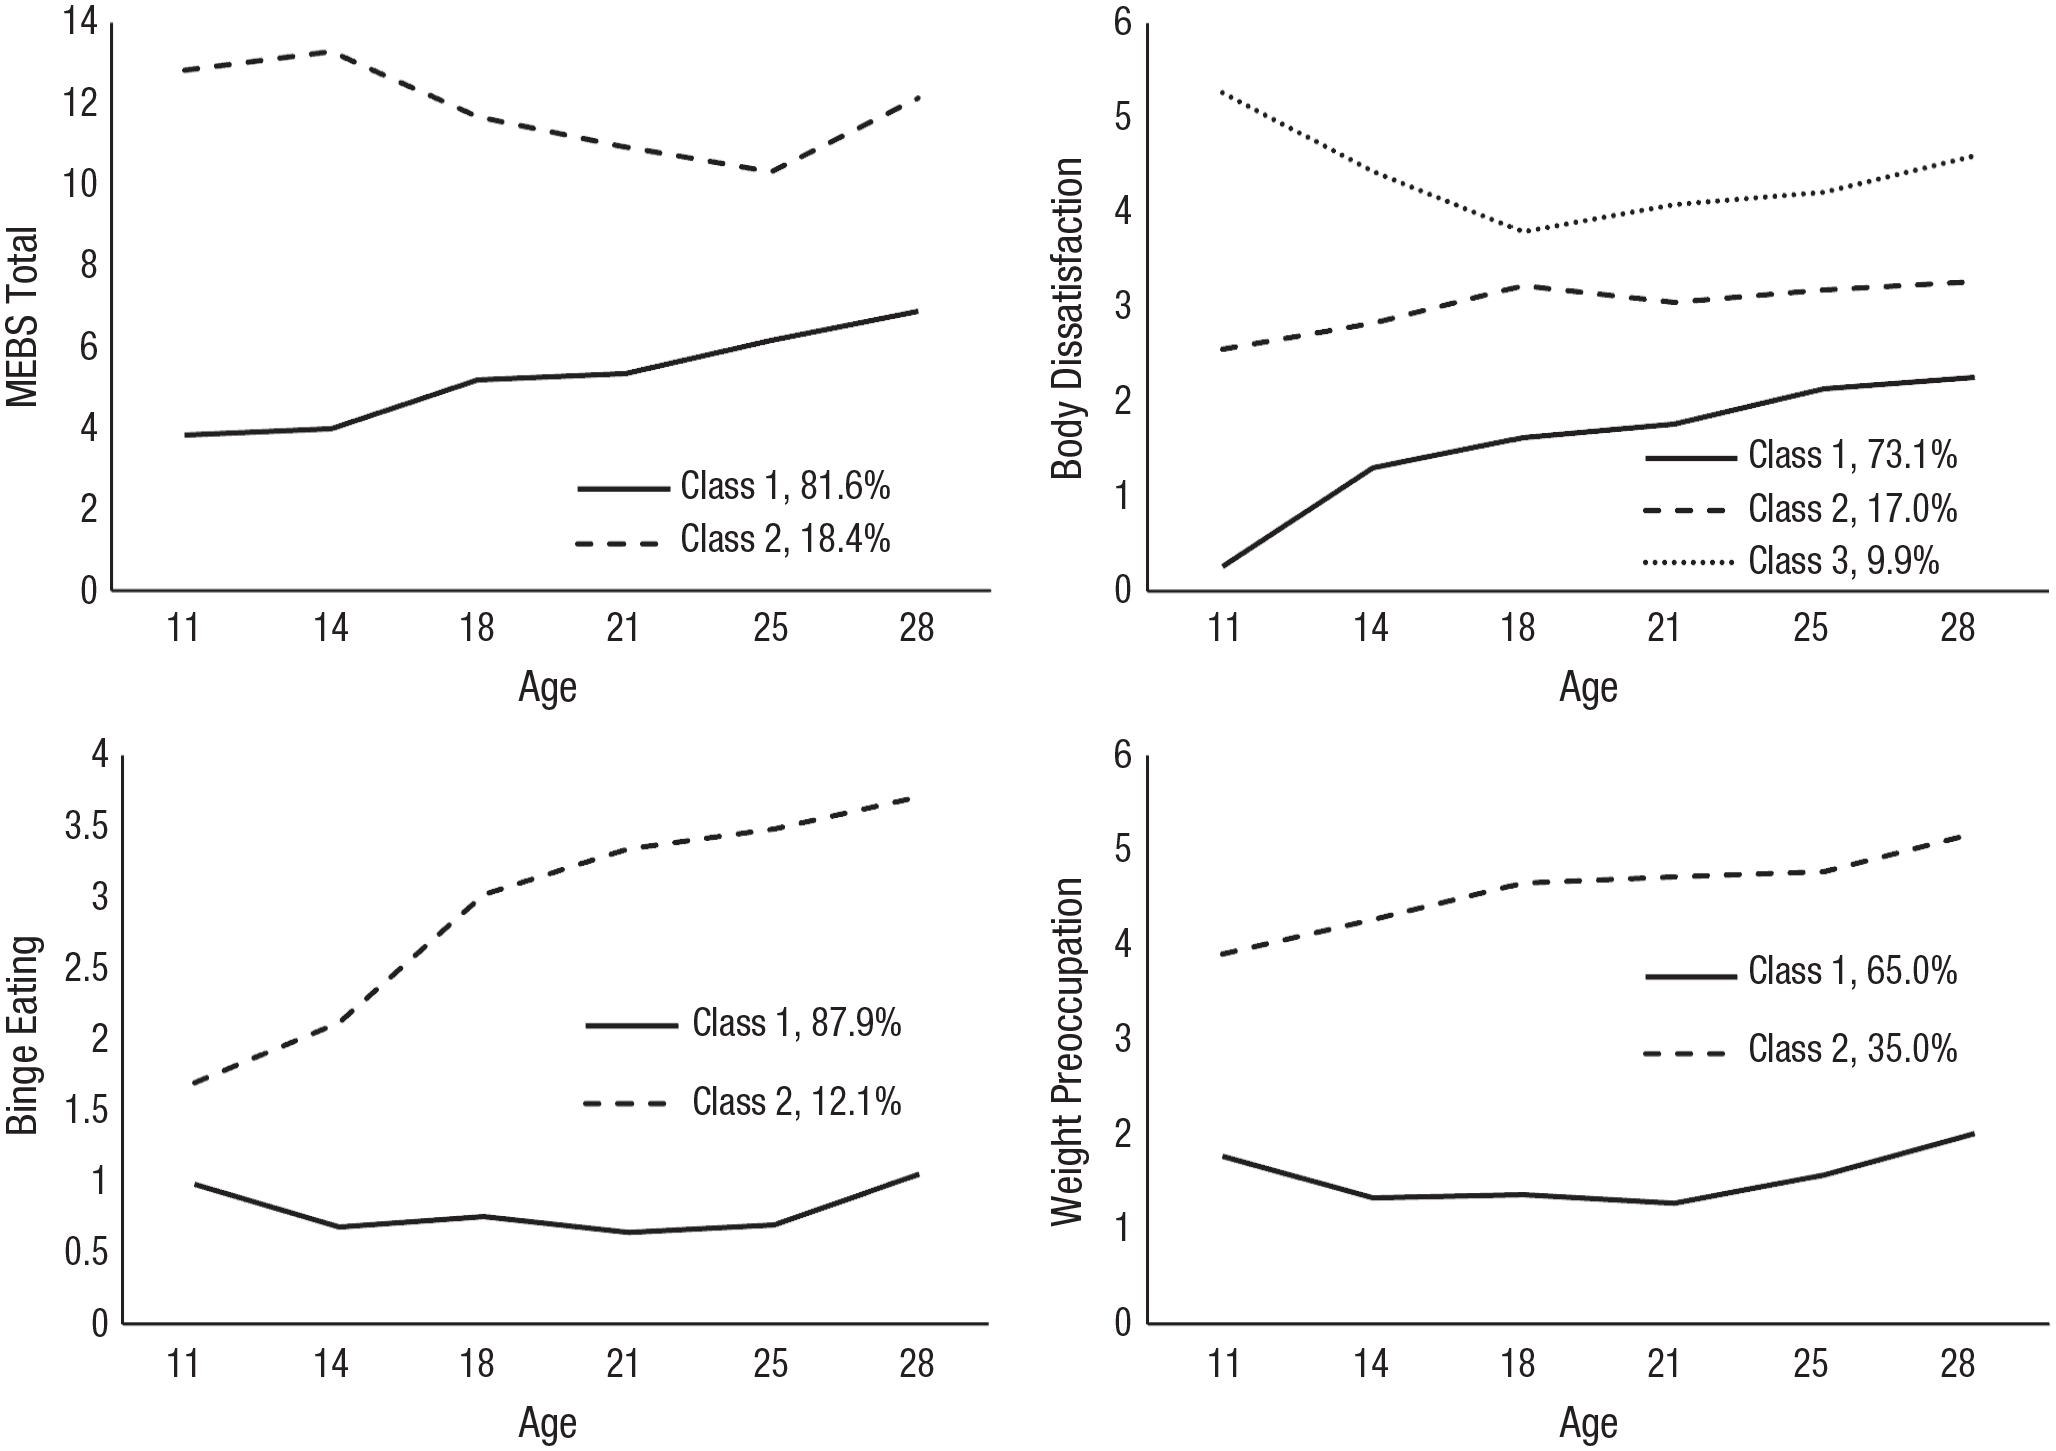
Trajectories of eating-disorder psychopathology development. For each type of eating-disorder psychopathology development, we labeled the most common and favorable trajectories “Class 1” to facilitate interpretation. On the y-axis, values ranged from 0 to 28 for total scores, from 0 to 8 for weight preoccupation, from 0 to 6 for body dissatisfaction, and from 0 to 7 for binge eating. MEBS = Minnesota Eating Behavior Survey.
Growth Parameters and Mean Levels of Predictor Variables Across Eating-Pathology Trajectories
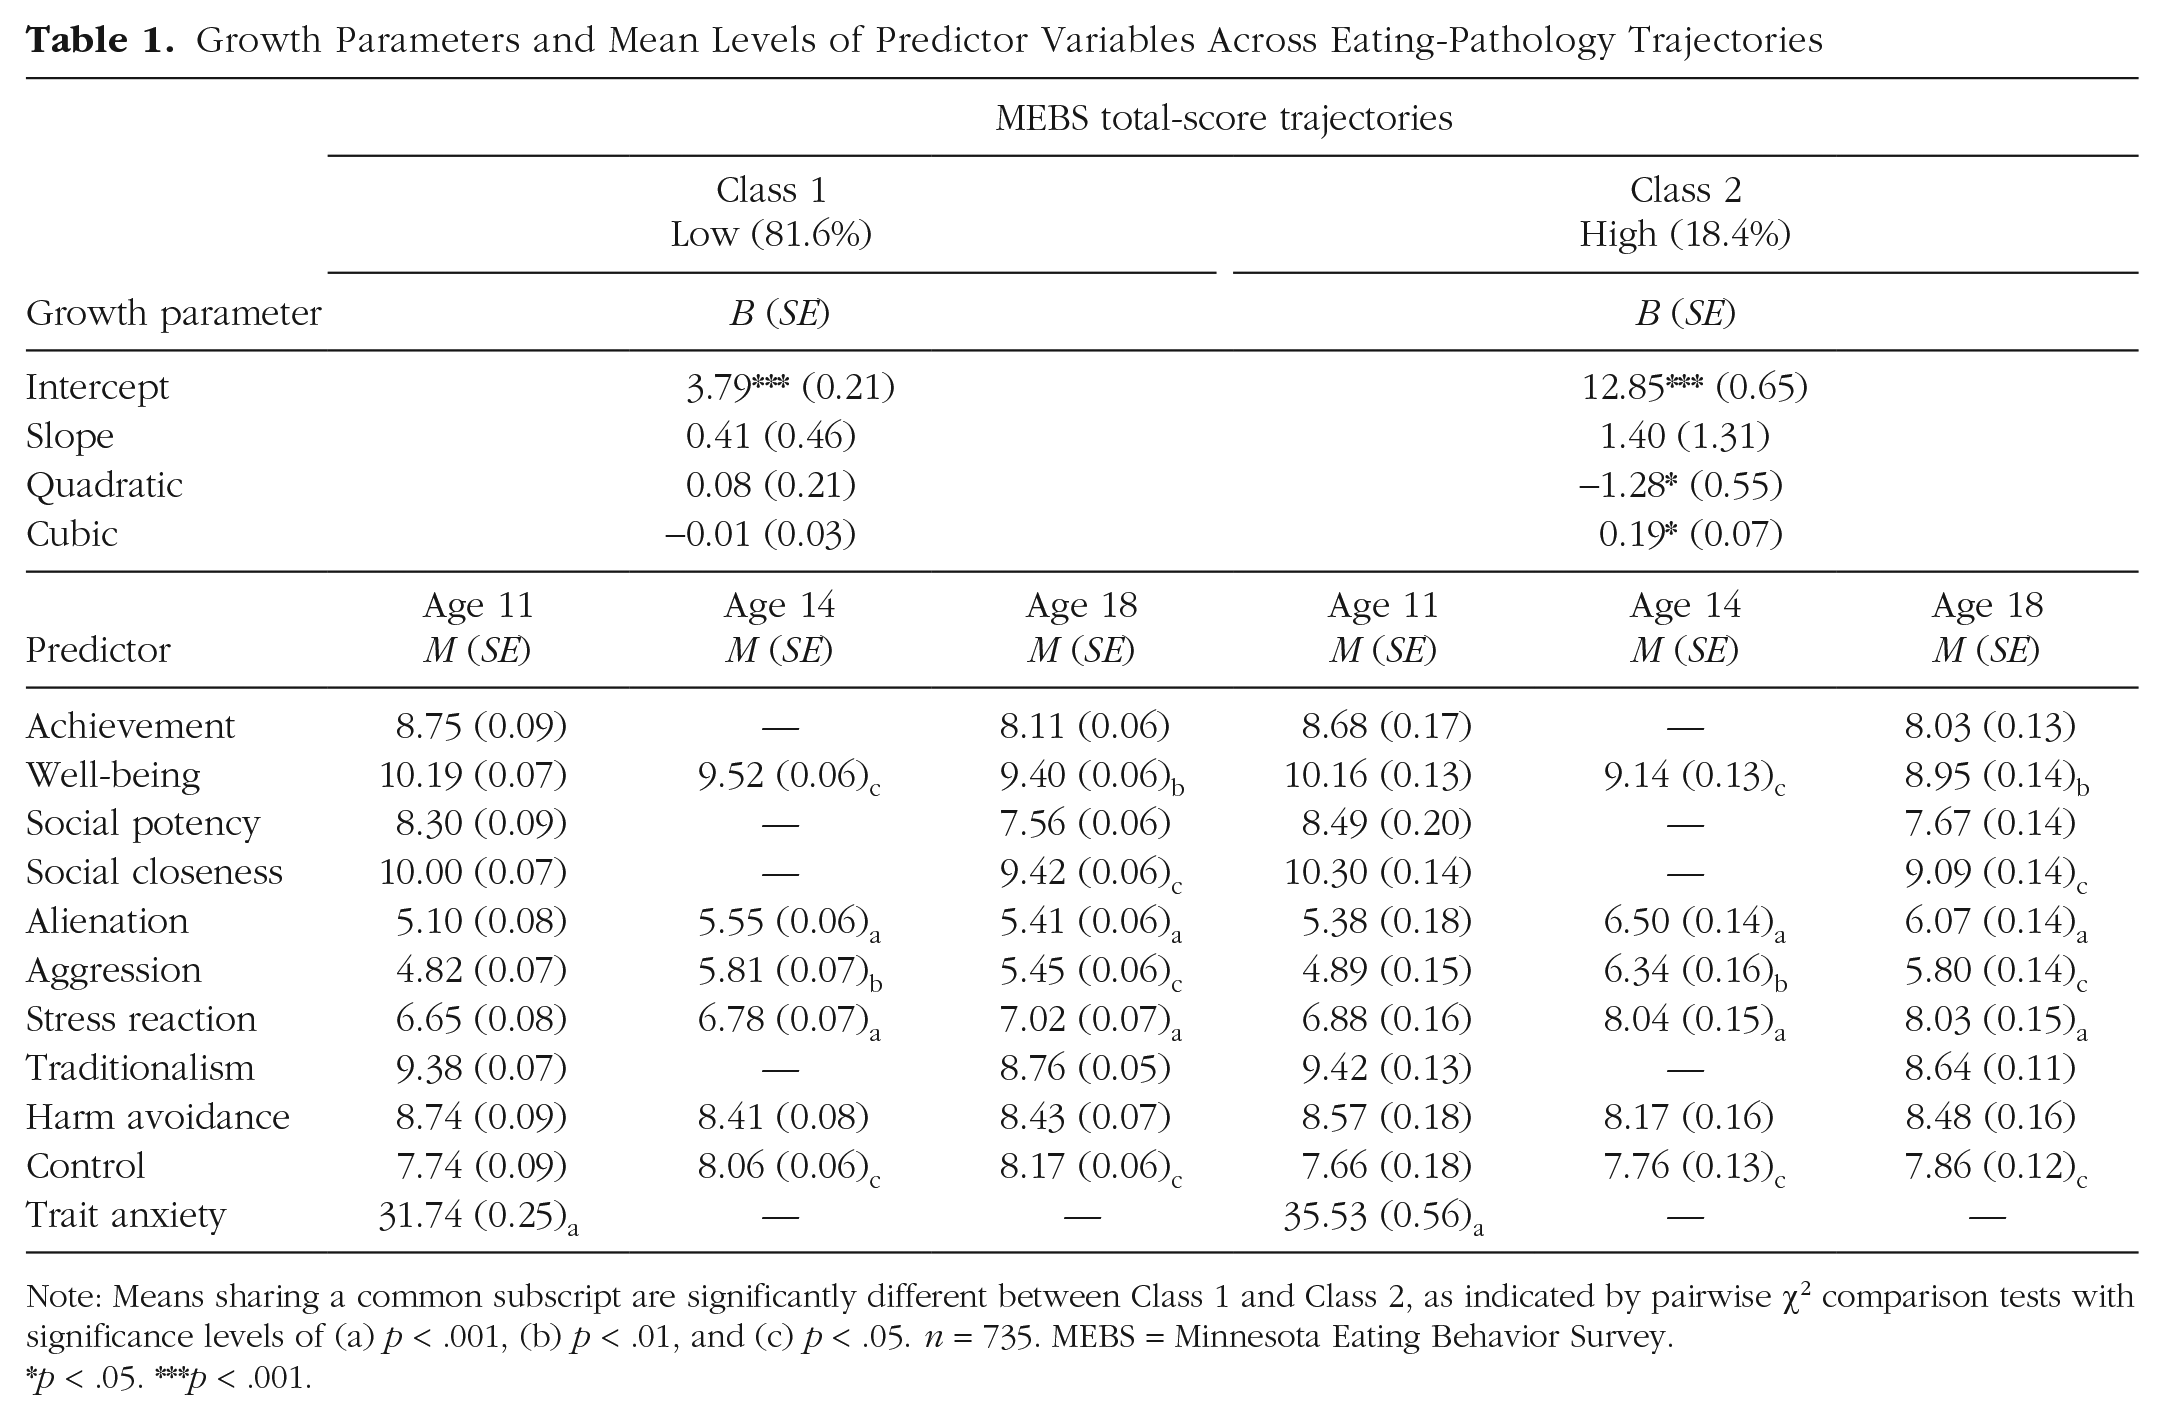
Note: Means sharing a common subscript are significantly different between Class 1 and Class 2, as indicated by pairwise χ2 comparison tests with significance levels of (a) p < .001, (b) p < .01, and (c) p < .05. n = 735. MEBS = Minnesota Eating Behavior Survey.
p < .05. ***p < .001.
Growth Parameters and Mean Levels of Predictor Variables Across Body-Dissatisfaction Trajectories
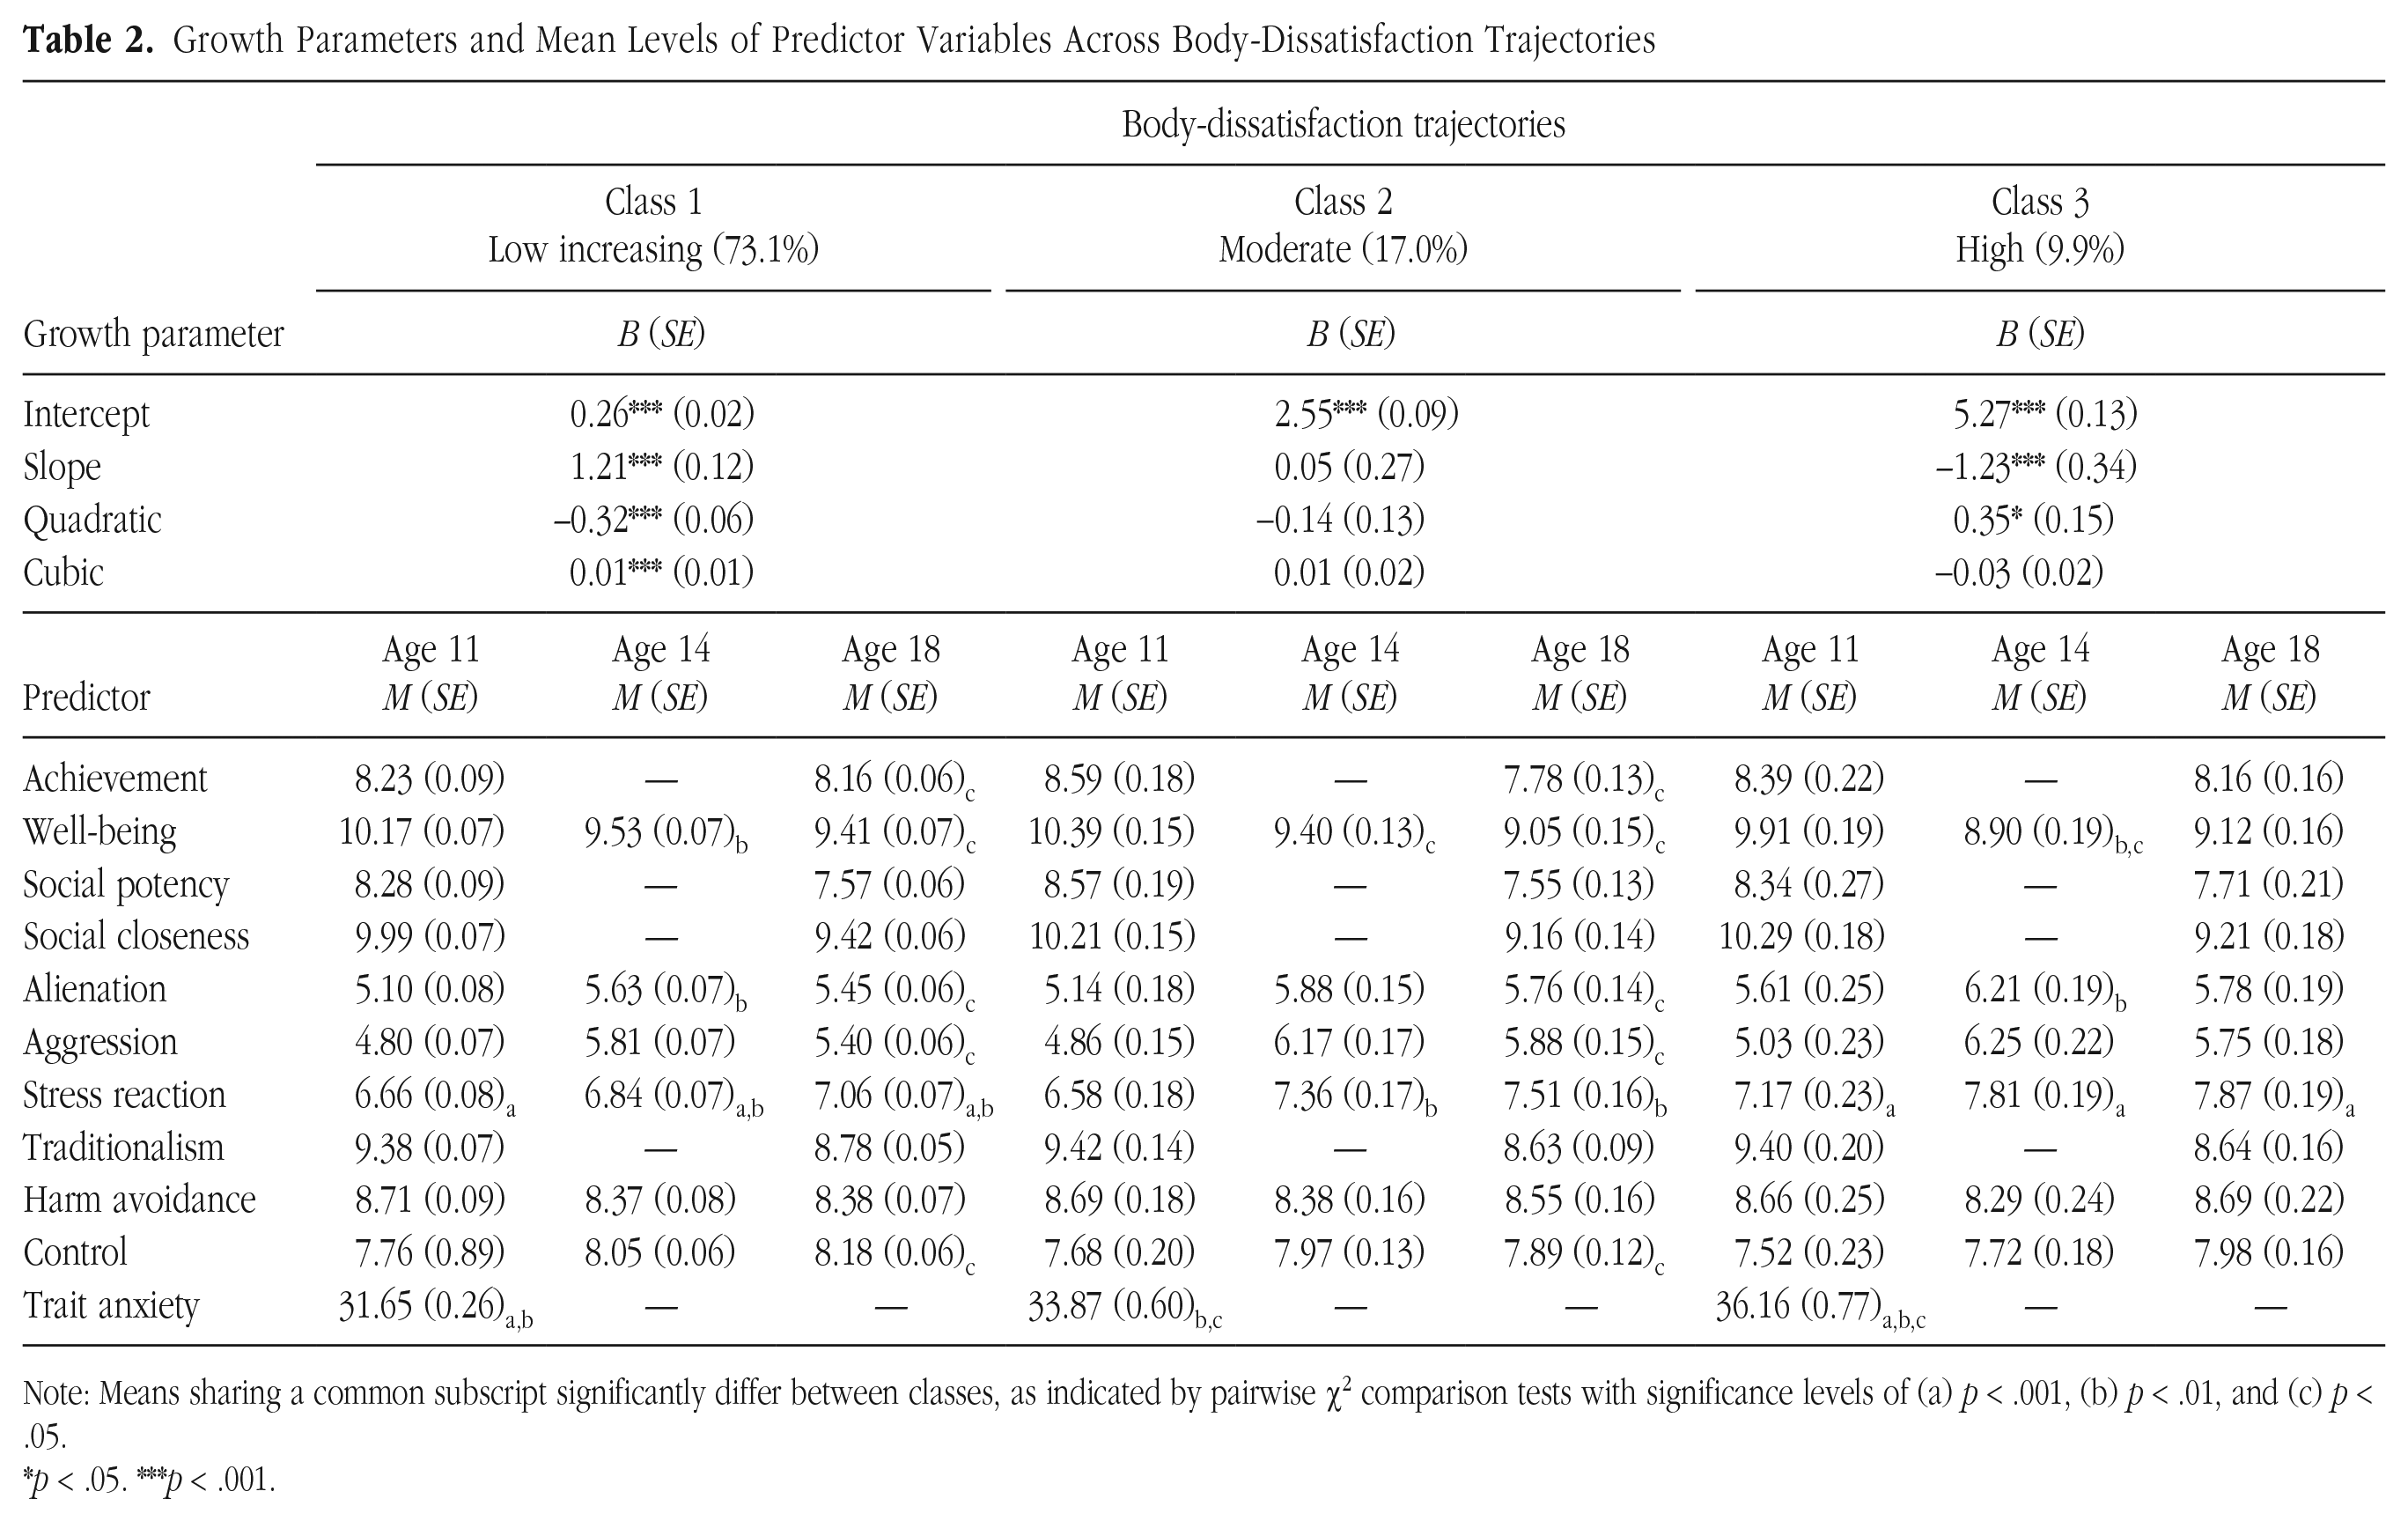
Note: Means sharing a common subscript significantly differ between classes, as indicated by pairwise χ2 comparison tests with significance levels of (a) p < .001, (b) p < .01, and (c) p < .05.
p < .05. ***p < .001.
Growth Parameters and Mean Levels of Predictor Variables Across Binge-Eating Trajectories
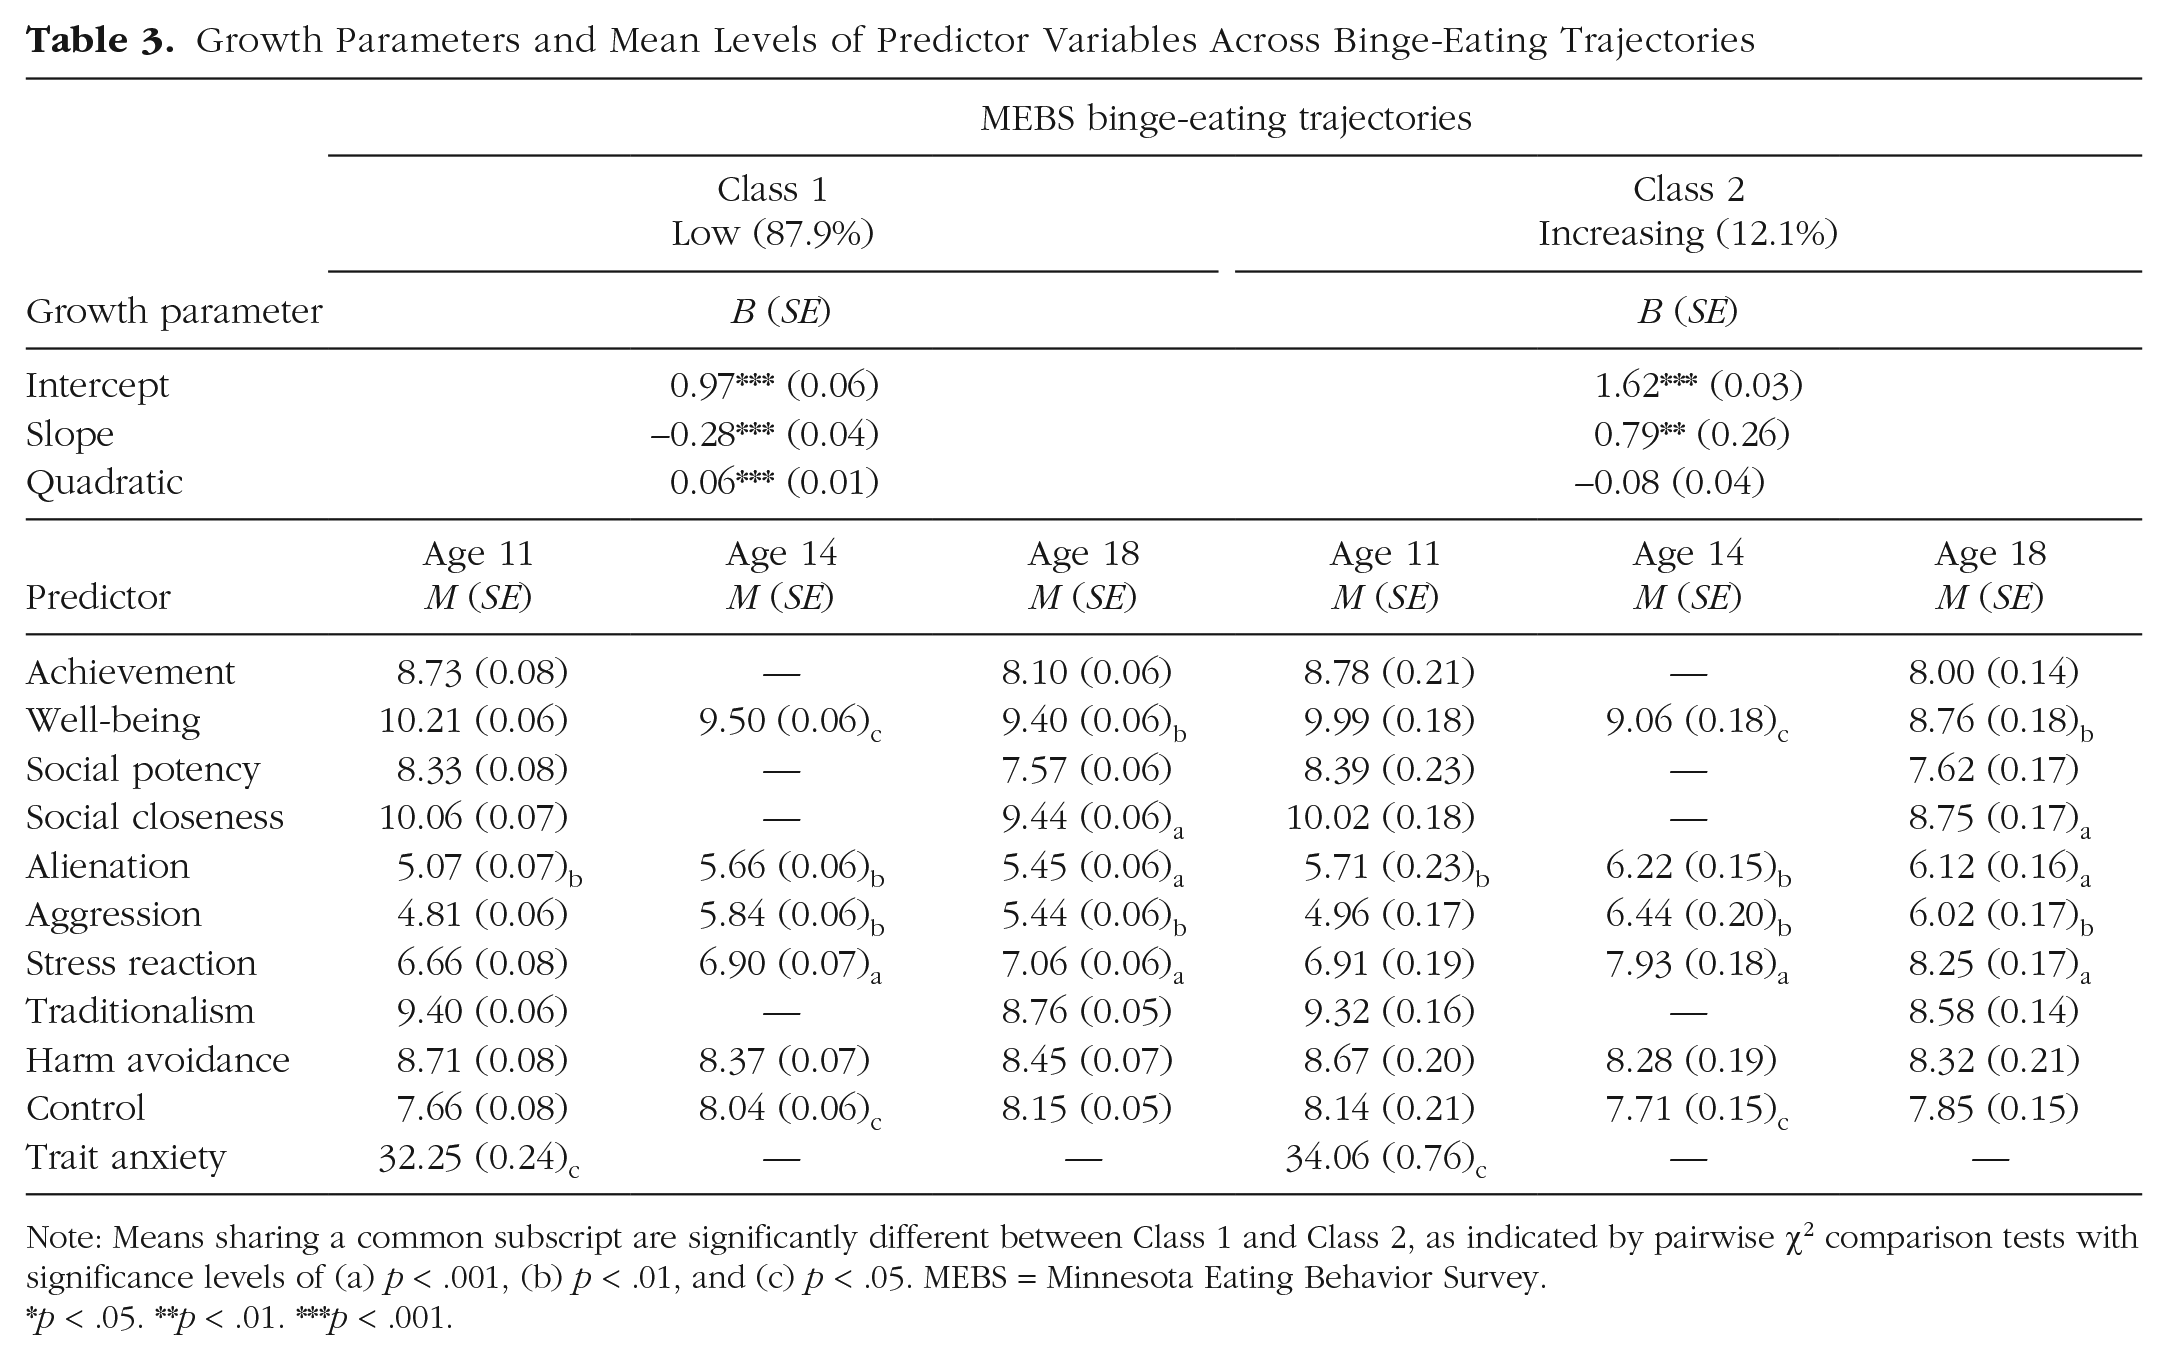
Note: Means sharing a common subscript are significantly different between Class 1 and Class 2, as indicated by pairwise χ2 comparison tests with significance levels of (a) p < .001, (b) p < .01, and (c) p < .05. MEBS = Minnesota Eating Behavior Survey.
p < .05. **p < .01. ***p < .001.
Growth Parameters and Mean Levels of Predictor Variables Across Weight-Preoccupation Trajectories
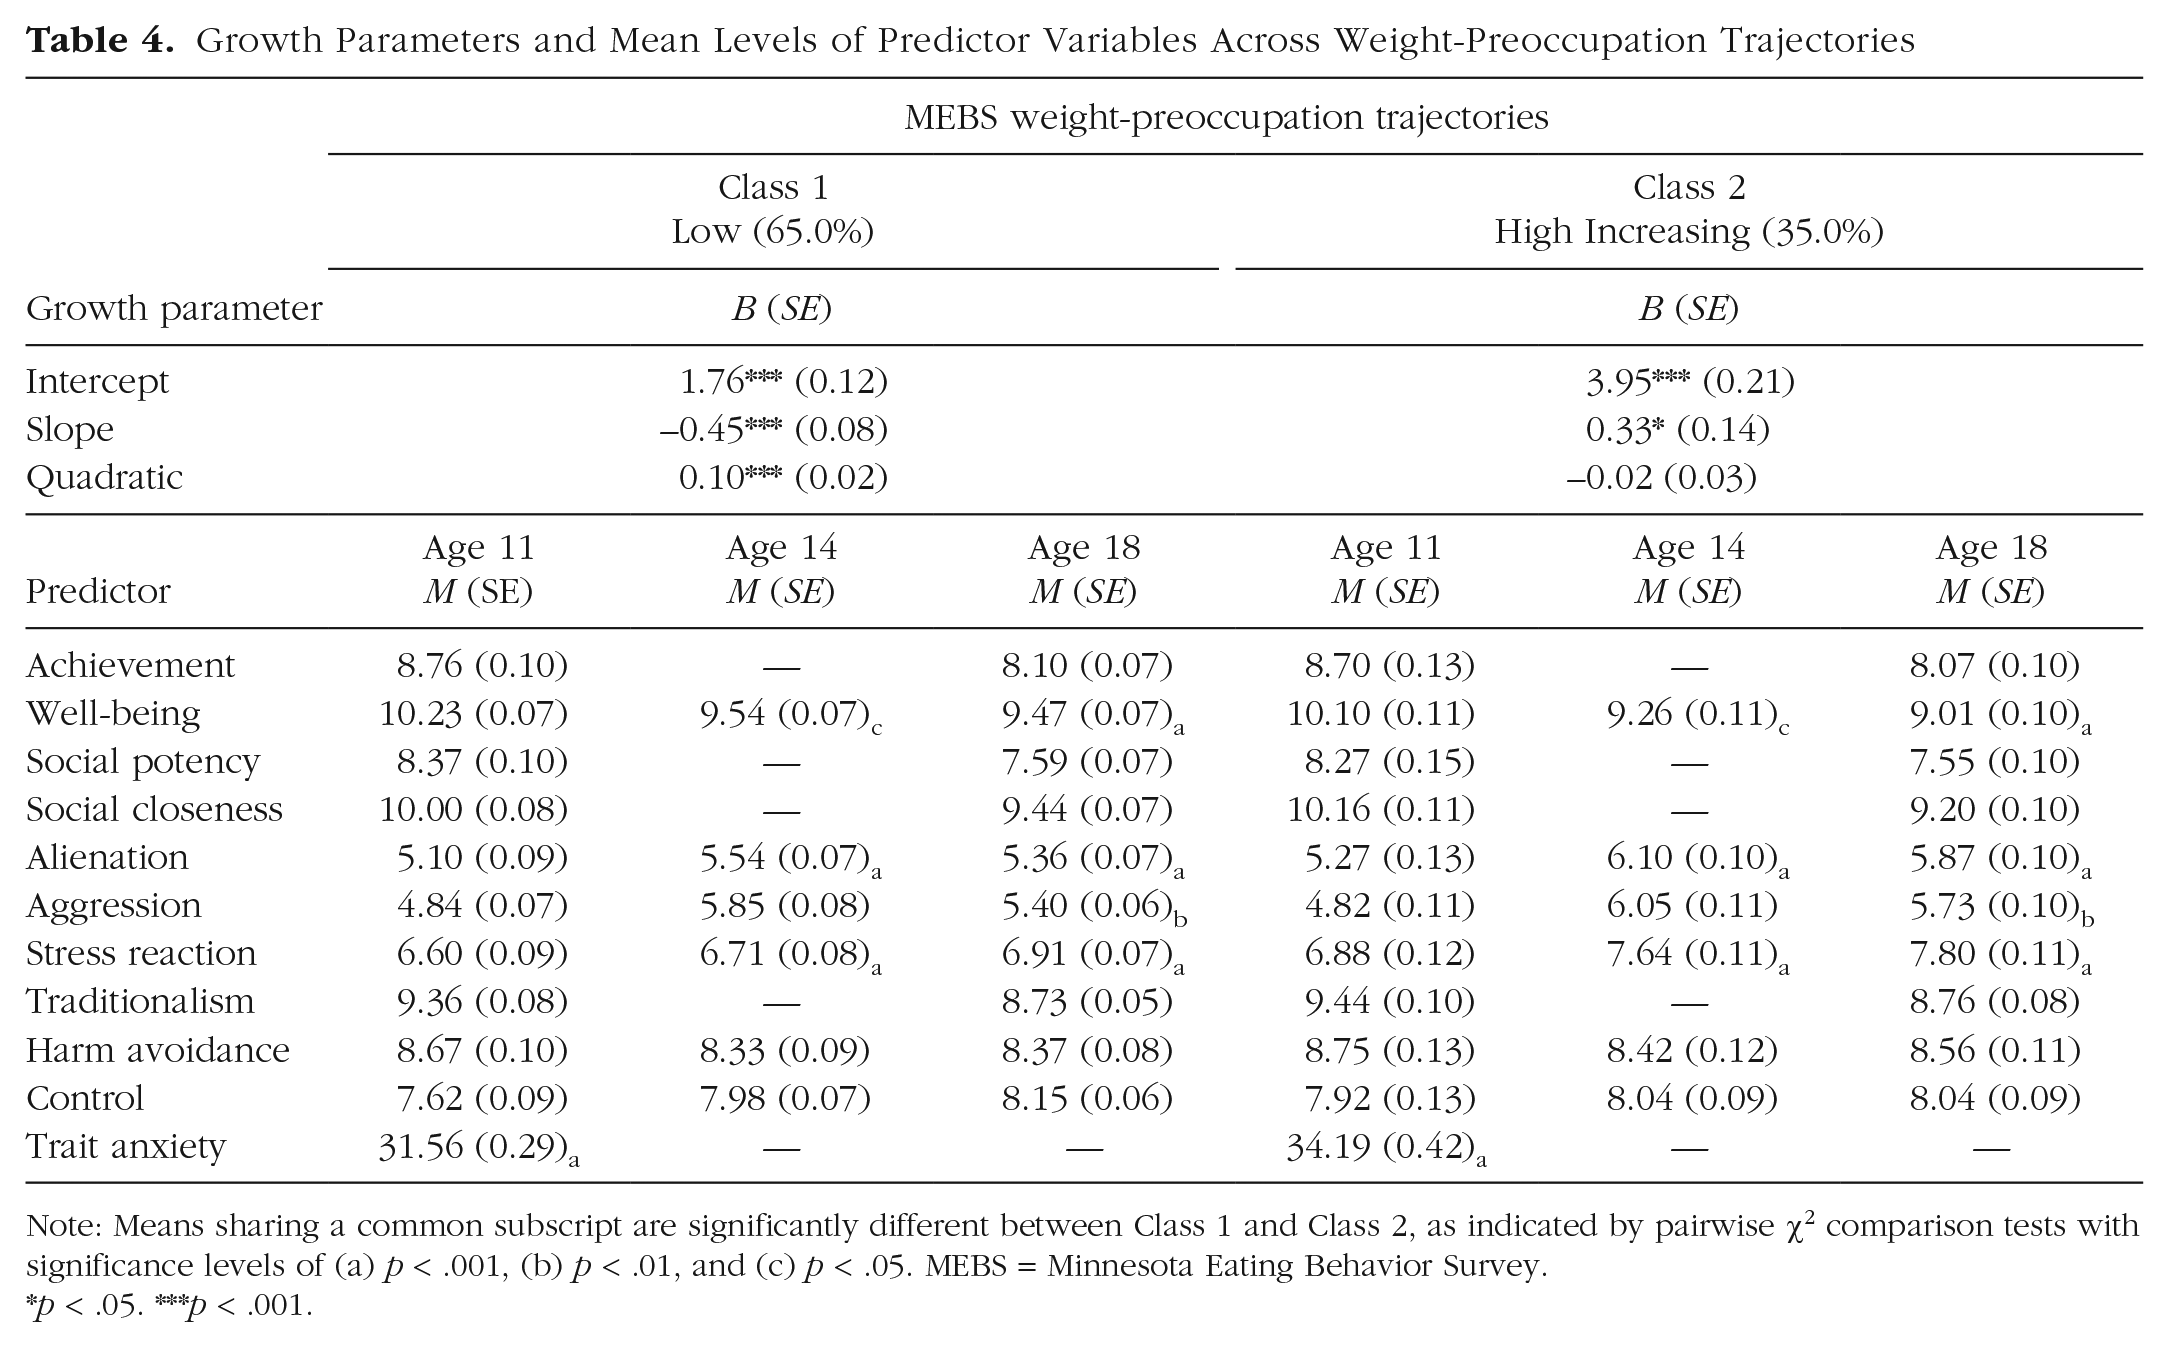
Note: Means sharing a common subscript are significantly different between Class 1 and Class 2, as indicated by pairwise χ2 comparison tests with significance levels of (a) p < .001, (b) p < .01, and (c) p < .05. MEBS = Minnesota Eating Behavior Survey.
p < .05. ***p < .001.
Total score
The first class (low; n = 600, 81.6%) was characterized by initially lower MEBS total scores (Table 1). Only the intercept term was significant. Although visual inspection of Figure 2 suggests increases in eating pathology over time, the slope, quadratic, and cubic terms were not significant. The second class (high; n = 135, 18.4%) was characterized by initially high MEBS total scores, which decreased between ages 14 and 25 and then increased by age 29—in addition to the intercept, the quadratic and cubic terms were also significant, indicating two meaningful inflections. Compared with girls in the more favorable low-trajectory class, girls in the high class had higher levels of self-reported trait anxiety at age 11; lower levels of well-being and control and higher alienation, aggression, and stress reaction at ages 14 and 18; and lower levels of social closeness at age 18.
Body dissatisfaction
The first class (low increasing; n = 537, 73.1%) was characterized by initially low body dissatisfaction (Table 2), increasing significantly over time with statistically significant inflections. The second class (moderate; n = 125, 17.0%) was characterized by moderate levels of body dissatisfaction with no significant patterns of change over time. The third class (high; n = 73, 9.9%) was characterized by initially high levels of body dissatisfaction, decreasing throughout adolescence but increasing through early adulthood—the significant slope and quadratic terms indicated a significant decline and reversal in the direction of change. Compared with participants classified in the more favorable trajectories, girls in the high-trajectory class tended to have higher levels of parent-reported stress reaction and self-reported trait anxiety at age 11, lower levels of well-being and higher levels of alienation and stress reaction at age 14, and higher levels of stress reaction at age 18.
Binge eating
The first class (low; n = 646, 87.9%) was characterized by binge-eating levels that remained low across all time points (Table 3); change over time was indicated by statistically significant slope and quadratic terms. The second class (increasing; n = 89, 12.1%) was characterized by initially low to moderate levels of binge eating and increases over time, indicated by a statistically significant slope. Compared with girls classified in the more favorable low trajectory, girls in the worsening trajectory tended to have higher levels of parent-reported alienation and self-reported trait anxiety at age 11; lower levels of well-being and control and higher alienation, aggression, and stress reaction at ages 14 and 18; and lower levels of social closeness at age 18.
Weight preoccupation
The first class (low; n = 478, 65.0%) was characterized by low levels of weight preoccupation (Table 4) with a decrease in adolescence, followed by increases between ages 21 and 29. The second class (high increasing; n = 257, 35.0%) was characterized by high levels of weight preoccupation, which increased over time, indicated by a significant slope term. Compared with girls classified in the more favorable low trajectory, girls in the high-increasing trajectory tended to have higher levels of self-reported trait anxiety at age 11, lower levels of well-being at ages 14 and 18, and higher levels of alienation and stress reaction at ages 14 and 18.
Prediction of trajectory-class membership
To determine whether trajectories of total eating pathology, body dissatisfaction, binge eating, and weight preoccupation could be predicted by personality traits reported by parents at age 11 or self-reported at ages 14 and 18, we performed multinomial logistic regressions. Table 5 presents the results of these analyses. To reduce multicollinearity and redundancies, we based our selection of predictors for each of these regression models on the results of prior analyses: for each respective type of eating pathology, the personality traits shown in the previous set of analyses to differ across classes were included as predictors of trajectory outcome. These analyses also controlled for baseline SES and BMI given that these factors were shown to have significant effects on eating-pathology trajectories.
Predictors of Eating-Pathology Trajectories
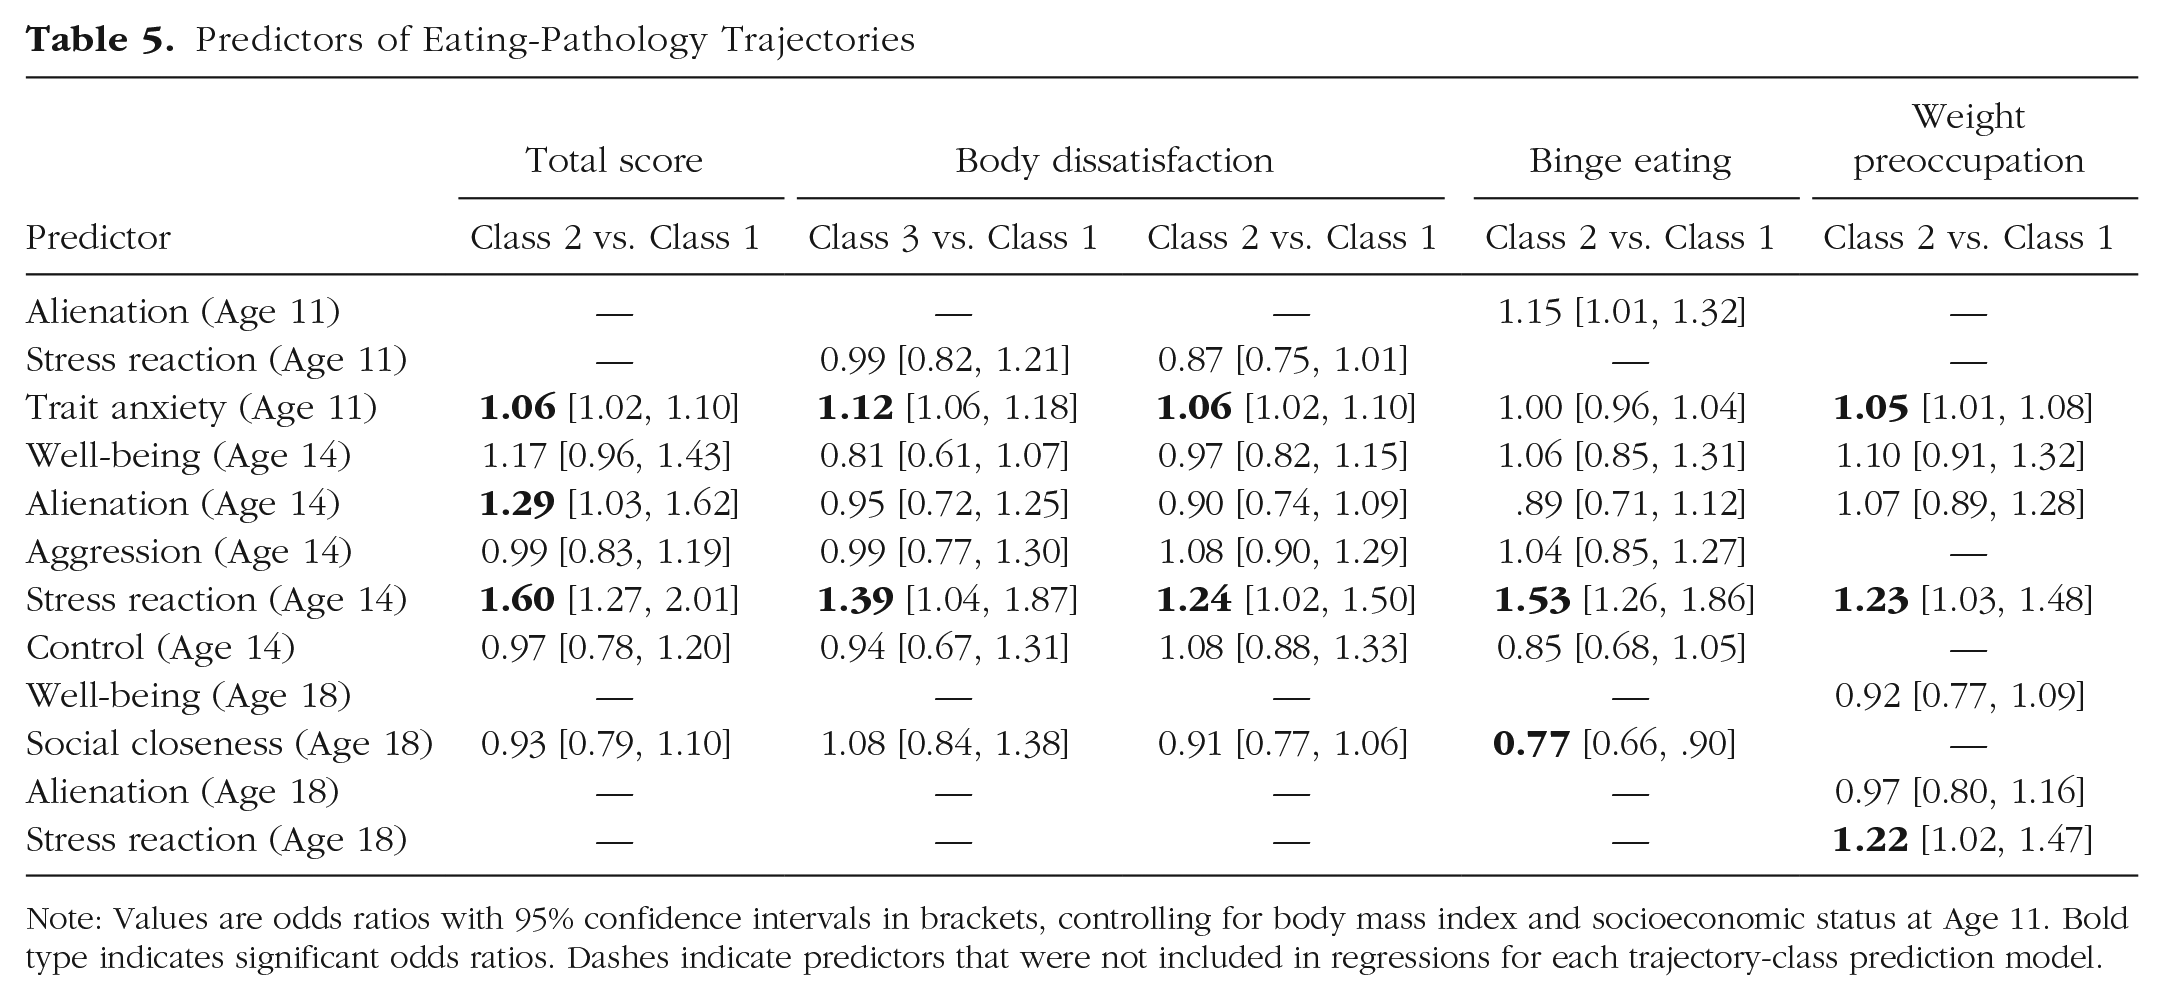
Note: Values are odds ratios with 95% confidence intervals in brackets, controlling for body mass index and socioeconomic status at Age 11. Bold type indicates significant odds ratios. Dashes indicate predictors that were not included in regressions for each trajectory-class prediction model.
For global eating-pathology development, compared with low trajectory (Class 1), girls classified in the high (Class 2) trajectory had higher levels of self-reported trait anxiety at age 11 and higher levels of alienation and stress reaction at age 14. The most meaningful predictor was self-reported stress reaction at age 14: for every 1-unit increase in stress reaction at age 14, girls were 1.60 times as likely to demonstrate the high trajectory. For every 1-unit increase in self-reported alienation scores at age 14, girls were 1.29 times as likely to demonstrate the high trajectory. For every 1-unit increase in self-reported trait anxiety at age 11, girls were 1.06 times as likely to demonstrate the high trajectory.
For body dissatisfaction, girls with higher self-reported trait anxiety at age 11 and stress reaction at age 14 were more likely to demonstrate the high (Class 3) and moderate (Class 2) trajectories rather than the low-increasing trajectory (Class 1). Specifically, for every 1-unit increase in trait anxiety at age 11, girls were 1.12 times as likely to demonstrate the high trajectory and 1.06 times as likely to demonstrate the moderate trajectory; for every 1-unit increase in stress reaction at age 14, girls were 1.39 times as likely to demonstrate the high trajectory and 1.24 times as likely to demonstrate the moderate trajectory.
For binge eating, only self-reported stress reaction at age 14 and social closeness at age 18 emerged as significant predictors of trajectory-class membership. For every 1-unit increase in stress reaction, girls were 1.53 times as likely to demonstrate the worsening trajectory (Class 2) instead of the low trajectory (Class 1). Self-reported social closeness was protective: for every 1-unit increase in social closeness at age 18, the chance of demonstrating the worsening trajectory was reduced by about one quarter.
For weight preoccupation, every 1-unit increase in self-reported trait anxiety at age 11 corresponded to 1.05 times higher odds of demonstrating the high-increasing trajectory (Class 2) rather than the low trajectory (Class 1; i.e., only marginally higher odds). A 1-unit increase in stress reaction at age 14 corresponded to 1.23 times the odds of demonstrating the high-increasing trajectory, and a 1-unit increase in stress reaction at age 18 corresponded to similarly increased odds (1.22 times as likely to demonstrate the high-increasing weight-preoccupation trajectory).
Discussion
Trajectories of eating-pathology development
Most participants showed low, increasing global-eating pathology and body dissatisfaction over time. For global eating pathology, this pattern characterized 81.6% of girls; for body dissatisfaction, this pattern characterized 73.1% of girls. Thus, a pattern of linear increases in eating pathology and body dissatisfaction specifically during the transition from late childhood to early adulthood appeared to be normative, consistent with prior work that examined average developmental patterns in this same sample (Slane et al., 2014). The most common trajectories of binge eating and weight preoccupation, demonstrated by 87.9% and 65.0% of girls, respectively, were characterized by fluctuations and small reductions in late adolescence and the early 20s and an increase by age 29. Similar patterns have emerged in previous studies in which global average developmental patterns were modeled across entire samples (e.g., Bucchianeri et al., 2013; Rohde et al., 2015; Slane et al., 2014).
Previous literature has characterized adolescence, specifically the ages of 12 to 18 years, as a sensitive period in body-image and disordered-eating development (Voelker et al., 2015). Indeed, peak incidence rates have been found at ages 14 to 15 for anorexia nervosa (Javaras et al., 2015) and ages 16 to 20 for bulimia nervosa (Stice et al., 2013). In the current study, however, girls with the most pathological trajectories of global eating pathology (18.4%), body dissatisfaction (9.9%), and weight preoccupation (35.0%) already showed elevated levels of each of these variables by age 11. Girls with the most pathological trajectories of global eating pathology and body dissatisfaction deviated from the normative pattern of linear increases in eating pathology over time: statistically significant inflections indicated that for these trajectory groups, levels of global eating pathology and body dissatisfaction decreased in adolescence before increasing again by age 29. Conversely, girls with the most pathological patterns of binge eating (12.1%) and weight preoccupation (35.0%) showed increases on these variables at every time point, most steeply between ages 14 and 18 for binge eating. The National Comorbidity Survey established age 12.6 years as the mean age of onset of binge eating disorder (Swanson et al., 2011)—our results show an increase in symptoms throughout adolescence that, in comparison, appears somewhat delayed compared with the younger average age of onset.
The apparent contrast between our results and those of prior longitudinal and epidemiological research can be reconciled by considering differences in study methodology. Specifically, epidemiological research focuses on entire samples to make inferences about the general population, whereas in the current study, we used a person-centered approach, LCGA, to provide nuanced insights into particular subgroups that are obscured when looking only at total sample means. Our results were consistent with the results of another study that employed LCGA: Wang et al. (2019) also identified a trajectory of high body dissatisfaction that decreased and then increased again between the approximate ages of 15 to 31.
Personality predictors
Results indicate that personality traits related to negative emotionality play an important role in differentiating trajectories of eating pathology, with the caveat that such traits may be captured better by self-report than parent-report methods. We obtained partial support for our hypothesis that less favorable trajectories of eating pathology would be predicted by higher levels of negative emotionality traits at ages 11, 14, and 18. Specifically, self-reported proneness to anxiety at age 11 predicted membership in the higher-risk trajectories of global eating pathology, body dissatisfaction, and weight preoccupation but not binge eating. Self-reported stress reaction (i.e., tendencies to be sensitive, irritable, and prone to worry and guilt) at age 14 predicted membership in riskier trajectories for all eating-pathology outcomes. Parent-reported levels of stress reaction at age 11, however, did not differentiate developmental trajectories for any eating-pathology outcomes. The failure of parent-reported stress reaction to predict eating-pathology trajectories may reflect measurement issues. Proneness to negative emotions such as anxiety and stress may not be directly entirely observable (Herzhoff et al., 2017; Shiner et al., 2021), even to people closest to the individual—thus, parent reports may have failed to accurately capture twins’ levels of the stress-reaction trait at age 11.
Adolescents who reported struggling with interpersonal relationships in adolescence were more likely to demonstrate riskier eating-pathology trajectories. Specifically, girls who demonstrated the high-risk global-eating-pathology trajectory showed greater self-reported tendencies to be suspicious of others’ motives, feel they are treated unfairly, and see oneself as a victim (i.e., alienation) at age 14. Conversely, girls who reported more sociable personality traits and enjoyment of others’ company were less likely to show pathological trajectories of binge eating. These findings are consistent with prior research that has shown that the interpersonal difficulties among people with eating disorders often predate the onset of illness (Cardi et al., 2018) and, conversely, that social skills may play a protective role (Uzunian & Vitalle, 2015).
Implications
Sensitive periods for disordered-eating development may occur earlier than previously believed (Liechty & Lee, 2013; Vanderkruik et al., 2020): for girls in our riskiest subgroups, eating pathology was already elevated by age 11, consistent with prior studies that have employed LCGA (Rodgers et al., 2016; Wang et al., 2019). Person-centered approaches such as LCGA are essential to study eating-pathology development because the onset and course of symptoms in high-risk subgroups may not be well captured by variable-centered statistical approaches that examine average development across entire samples. This finding has important implications for the prevention of eating disorders and body-image disturbances. According to reviews, many interventions designed to target body image among children are delivered between ages 11 and 15 (Kurz et al., 2022). The average age of youths who receive universal eating-disorders prevention programs is 13 years; selective prevention (i.e., programs that are targeted to individuals who show elevated risk factors) tends to be delivered even later, when participants are 17.6 years old on average (Watson et al., 2016). Given that we could already distinguish high-risk subgroups based on elevated self-reported disordered-eating pathology at age 11, it may be possible to identify subgroups of children with eating pathology earlier rather than waiting until later in adolescence to deliver selective prevention. The potential benefits of earlier delivery of targeted prevention programming are unclear: a review of the effectiveness of universal prevention programs delivered to children from 5 to 17 years old found no moderating effect of age on the effectiveness of such programs (Chua et al., 2020).
Although prevention programming has advanced considerably, researchers are still far from achieving the targets of effective body-image and eating-disorder prevention programming (Kusina & Exline, 2019). Personality-targeted approaches have met with great success in the prevention of substance use disorders (Edalati & Conrod, 2018), and researchers have begun to discuss applying this strategy to the prevention (Marzola et al., 2020) and treatment (Kaye et al., 2015) of eating pathology. It may be worth expanding the focus of body-image and eating-pathology prevention programming to better address negative emotionality. In our study, such traits characterized participants in the more pathological-trajectory groups, and yet, these traits are not well targeted in current body-image and eating-pathology prevention programming (Kusina & Exline, 2019). Rather than targeting specific disorders (e.g., eating disorders) and their risk factors (e.g., thin-ideal internalization), paradigms such as the Clinical High At Risk Mental State (CHARMS) have identified broad-spectrum transdiagnostic criteria and pathogenic mechanisms that place young people at elevated risk for developing a range of serious mental illnesses (Hartmann et al., 2019). The CHARMS paradigm has opened the door for trialing transdiagnostic prevention programs such as the Unified Protocol for the Transdiagnostic Prevention of Emotional Disorders (Sauer-Zavala et al., 2021). By targeting pluripotent developmental processes and risk factors in this way, transdiagnostic prevention approaches hold promise in their potential to effectively prevent or delay a broad range of psychopathological trajectories and mental illnesses, reducing the need for multiple disorder-specific prevention programs (Colizzi et al., 2020). Transdiagnostic prevention programs that target neuroticism have shown strong feasibility and acceptability in initial proof-of-concept (Bentley et al., 2018) and pilot studies (Bernstein et al., 2021), but their efficacy remains to be examined in larger-scale trials and with younger children. Given that in the current study we identified negative emotionality as a predictor of eating-pathology trajectories, it may be worth selecting participants for targeted prevention on the basis of personality risk factors in addition to eating-disorder-specific risk factors (e.g., thin-ideal internalization) and exploring whether such personality-targeted programming can be delivered earlier.
Limitations
The current study contains limitations that must be acknowledged. The sample comprised girls who were mainly White, and thus our findings may not generalize to girls of different races, ethnicities, and geographic locations. In addition, we focused on personality risk factors rather than including a wider range of predictors in our models. Future studies may attempt to include a wider range of potential predictor variables to clarify, for example, the relative importance of sociocultural factors (e.g., thin-ideal internalization) versus personality traits.
There are several limitations concerning the use of self-report and parent-report measures. Although self-report offers intimate access to low-visibility personality traits (i.e., internal tendencies that are not directly accessible to others), the validity of youths’ self-reports may be limited by their reading and insight into personal characteristics (Shiner et al., 2021). Individuals with disordered eating tend to have negatively biased self-evaluations, particularly regarding evaluations of their own social skills (Harper et al., 2023), which may have colored responses to items on certain personality subscales. Reports completed by adult informants may complement self-report data (Herzhoff et al., 2017), yet they carry the potential for informant bias. In the current study, parent-reported personality trait scores had low internal consistency values (.52–.57), which we speculate reflect the small number of items (three per trait scale) on this version of the MPQ. Regarding personality measurement, in addition, in the current study, we did not capture traits such as perfectionism (Kehayes et al., 2019) and negative urgency (Puccio et al., 2019); personality traits beyond those we measured may also warrant investigation in relation to the development of disordered eating. Finally, concerning measurement timing, except for self-reported trait anxiety at age 11, the personality traits that significantly predicted trajectory-group membership in our regression models were all measured at ages 14 or 18; we cannot describe these traits as “risk factors” because timing of our assessment meant we were unable to determine whether they preceded the development of eating pathology.
Future prospective studies may clarify the relationship of a wider range of self-reported and parent-reported personality characteristics with eating pathology and explore potential reciprocal relationships over time. To this end, we recommend the use of modern measures of eating pathology, such as the Eating Pathology Symptoms Inventory (Forbush et al., 2013), which has demonstrated measurement invariance across adolescents and adults (Richson et al., 2021) and includes scales assessing compensatory behaviors such as purging and excessive exercise. To increase the validity of personality measurement in youths, we recommend multiinformant assessment; multiple informant reports may be collected at each time point and either aggregated into single scores or combined using latent variable approaches (Shiner et al., 2021).
Conclusion
This study enhances understanding of the most common trajectories of eating-pathology development among girls during the transition from late childhood to early adulthood. Pathological trajectories of global eating pathology, body dissatisfaction, weight preoccupation, and binge-eating development deviated considerably from normative patterns both in terms of baseline levels of these outcomes and their patterns of change over time: whereas most girls tended to develop eating pathology gradually during the transition to adulthood, the pathological subgroups already showed concerningly elevated eating pathology by age 11. In early adolescence, girls in high-risk subgroups reported higher levels of negative emotionality traits, lower levels of social closeness, and in the case of binge eating, greater feelings of alienation. Results suggest it may be worth considering earlier delivery of targeted prevention programming and targeting personality traits within this programming.
Supplemental Material
sj-docx-1-cpx-10.1177_21677026231192271 – Supplemental material for Trajectories and Personality Predictors of Eating-Pathology Development in Girls From Preadolescence to Adulthood
Supplemental material, sj-docx-1-cpx-10.1177_21677026231192271 for Trajectories and Personality Predictors of Eating-Pathology Development in Girls From Preadolescence to Adulthood by Emilie Lacroix, Sylia Wilson, Matt McGue, William G. Iacono and Kristin M. von Ranson in Clinical Psychological Science
Supplemental Material
sj-docx-2-cpx-10.1177_21677026231192271 – Supplemental material for Trajectories and Personality Predictors of Eating-Pathology Development in Girls From Preadolescence to Adulthood
Supplemental material, sj-docx-2-cpx-10.1177_21677026231192271 for Trajectories and Personality Predictors of Eating-Pathology Development in Girls From Preadolescence to Adulthood by Emilie Lacroix, Sylia Wilson, Matt McGue, William G. Iacono and Kristin M. von Ranson in Clinical Psychological Science
Supplemental Material
sj-docx-3-cpx-10.1177_21677026231192271 – Supplemental material for Trajectories and Personality Predictors of Eating-Pathology Development in Girls From Preadolescence to Adulthood
Supplemental material, sj-docx-3-cpx-10.1177_21677026231192271 for Trajectories and Personality Predictors of Eating-Pathology Development in Girls From Preadolescence to Adulthood by Emilie Lacroix, Sylia Wilson, Matt McGue, William G. Iacono and Kristin M. von Ranson in Clinical Psychological Science
Supplemental Material
sj-docx-4-cpx-10.1177_21677026231192271 – Supplemental material for Trajectories and Personality Predictors of Eating-Pathology Development in Girls From Preadolescence to Adulthood
Supplemental material, sj-docx-4-cpx-10.1177_21677026231192271 for Trajectories and Personality Predictors of Eating-Pathology Development in Girls From Preadolescence to Adulthood by Emilie Lacroix, Sylia Wilson, Matt McGue, William G. Iacono and Kristin M. von Ranson in Clinical Psychological Science
Footnotes
Acknowledgements
We acknowledge the Minnesota Twin Family Study team who collected and facilitated access to this data set, and the participants and their families who returned on multiple occasions to participate in research. This article is based on the dissertation completed by ![]() , completed under the supervision of Dr. Kristin M. von Ranson.
, completed under the supervision of Dr. Kristin M. von Ranson.
Transparency
Action Editor: Kelsie T. Forbush
Editor: Jennifer L. Tackett
Author Contributions
Notes
References
Supplementary Material
Please find the following supplemental material available below.
For Open Access articles published under a Creative Commons License, all supplemental material carries the same license as the article it is associated with.
For non-Open Access articles published, all supplemental material carries a non-exclusive license, and permission requests for re-use of supplemental material or any part of supplemental material shall be sent directly to the copyright owner as specified in the copyright notice associated with the article.