
Abstract
Most health disparities originate in childhood and extend across the life span. However, studies on health disparities have predominantly focused on adults. This study evaluated the biological and psychosocial consequences of exposure to chronic adversity among 491 low-income children aged 8 to 12 years (Mage = 9.73, SD = 1.0; 52.1% male; 68.2% Black and 21.2% Latinx; 267 maltreated and 224 nonmaltreated). Latent profile analyses revealed six distinct profiles of cumulative socioeconomic risk, allostatic load, and mental health functioning. Childhood maltreatment, emotion regulation, affect, and personality characteristics were differentially associated with these latent profiles. Findings indicate differential effects of chronic adversity on adaptation, consistent with resilience theory. These findings also offer evidence that signs of physiological dysregulation emerge at earlier ages in development and suggest there may be a window of opportunity in childhood for interventions to reduce the detrimental effects of chronic adversity on health outcomes in children.
Mental and physical health disparities are a common occurrence in low-income and underrepresented communities. These disparities are even more striking with the current health crisis, in which low-income families, African Americans, Native Americans, and Latinx Americans are overrepresented among the rates of COVID-19 deaths and diagnoses (Raifman & Raifman, 2020). This susceptibility to poor mental and physical health outcomes in poverty-stricken and disadvantaged communities arose from a long history of economic inequity, racism, discrimination, inadequate access to health care, and distrust of the medical-health community that is rooted in systemic and structural inequalities (Jones et al., 2020; Kangovi et al., 2013). Unfortunately, most of the work on these health disparities, particularly those concerning physical health, are not examined until middle to late adulthood, when markers of poor health may be more salient (Juster et al., 2010). Although research on health disparities in later stages of development has illuminated the processes and mechanisms associated with different health outcomes, less is known about the antecedents and progression of these health outcomes before they reach pathological levels in adulthood. Moreover, it is clear that some children from disadvantaged backgrounds show positive outcomes marked by mental or physical health, or both, with considerable variation in developmental pathways (Brody, Yu, Chen, Kogan, et al., 2013; Masten et al., 2021). To create early intervention programs to promote positive health outcomes and prevent or delay these health disparities, it is crucial that researchers and clinicians gain a more comprehensive understanding of the antecedents and progression of health indicators during key developmental periods and transitions at earlier stages of development.
The current investigation extends the literature on health disparities by capitalizing on seminal work conducted by Brody and colleagues with young adults (Brody, Yu, Chen, Kogan, et al., 2013) to understand distinct patterns of cumulative socioeconomic risk, allostatic functioning, and mental health in childhood. Like Brody et al., this study examined adaptive function at multiple levels of analysis (biological and psychosocial). In contrast with Brody et al., however, we evaluated these patterns in younger children (8–12 years old) during a developmental period in which youth are still largely reliant on their primary caregivers for guidance and support but are also forging their own autonomy through the establishment of new peer and social networks outside the family environment (e.g., Collins et al., 1995). This sensitive period of brain development and pubertal maturation leads to improvement in cognitive functioning and emotional regulation but also increases youth’s vulnerability to social and environmental influences, leading to dramatic increases in mental health problems (Casey et al., 2019), and obesity (Ogden et al., 2014), setting the stage for future health challenges. Therefore, it is important to understand how contexts of poverty and adversity may initiate pathways toward and away from mental and physical health among this age group.
Resilience Framework
The current study was guided by a resilience framework focusing on risk, vulnerability, and promotive and protective effects across multiple levels of analysis. Resilience is a dynamic process that represents a person's capacity to adapt or recover from stressful environments or challenges that may undermine or threaten their viability or development (Masten et al., 2021). Resilience theory purports that exposure to chronic adversity can lead to different development pathways and outcomes and these outcomes reflect the interaction of multiple systems operating at the cellular, individual, family, school, community, social, and cultural levels (García Coll et al., 1996; Gottlieb, 2007; Masten et al., 2021). Therefore, functioning at one level of analysis has direct or indirect impacts on adaptation at another level. Youth who experience high cumulative risk may show positive developmental outcomes when they have strong supportive relationships with parents, teachers, and mentors; hold strong ties with their communities; and use effective emotion-regulation skills (Masten et al., 2021). However, the absence of these protective processes in disadvantaged youth exposed to adverse life experiences can result in poor mental and physical health outcomes. Therefore, resilience theory serves as a framework for understanding how different health outcomes may emerge after exposure to experiences of chronic stress and adversity and to delineate risk and protective processes that may promote or undermine positive health outcomes and adaptation. According to resilience theory, certain vulnerabilities and protective factors can lead to different patterns of adaptation (Masten et al., 2021). For example, exposure to chronic stressors or adversity may lead to a deterioration in mood and affect, which increases the risk for poor health outcomes and adaptation (Dich et al., 2015; Steptoe et al., 2009). In contrast, having a certain personality disposition and/or utilizing effective emotion-regulation skills and coping strategies may lead to better health outcomes and adaptation (Brody, Yu, Chen, Kogan, et al., 2013; Soto & Tackett, 2015).
Allostatic Functioning
Coping with cumulative socioeconomic status (SES)-related stressors is associated with multiple mental and physical health outcomes (Brennan et al., 2009; Chen et al., 2002; Evans, 2003; Heck & Parker, 2002). Empirical work has implicated physiological dysregulation as a mechanism through which experiences of stress and chronic adversity get under the skin to cause disruption to normative brain, cognitive, and socioemotional development (Brody, Yu, Chen, Miller, et al., 2013; Evans, 2003; McEwen, 1998). In normative development, allostasis serves as a dynamic regulatory process that allows individuals to maintain physiological equilibrium and stability, ensuring that organisms can mobilize the resources essential to respond to the physical and social demands of their environments (McEwen, 2020). An efficient allostatic system usually responds to stressful, external demands by initiating adaptive responses in the neuroendocrine, immune, metabolic, and cardiovascular systems and returning to baseline when the stressful event or external demand subsides (McEwen, 1998, 2020). Unfortunately, repeated or prolonged activation or deactivation of these physiological systems render them ineffective, which leads to allostatic load (AL).
AL is a cumulative, multisystem indicator of physiological dysregulation that represents the “wear and tear” on the brain and the body (Cicchetti, 2011; McEwen, 1998). Classic assessments of AL incorporate multiple biomarkers of neuroendocrine (e.g., cortisol, epinephrine, norepinephrine), immune (e.g., interleukin-6, or IL-6; C-reactive protein, or CRP), metabolic (e.g., lipoproteins, triglycerides, body mass index, or BMI), and cardiovascular (e.g., heart rate, or HR; systolic blood pressure, or SBP; and diastolic blood pressure, or DBP) functioning (Brody, Yu, Chen, Kogan, et al., 2013; Evans, 2003; Juster et al., 2010). Studies on AL in children and adults have shown that higher AL is associated with cognitive decline, higher rates of cardiovascular disease and mortality, and lower psychosocial well-being (Rogosch et al., 2011; Seeman et al., 1997).
Cumulative SES Risk, AL, and Health
Few studies have examined the association between cumulative assessments of SES risk, AL, and psychosocial adjustment. One of the first multimethod studies to examine these links showed that increases in cumulative SES risk were associated with elevated AL and socioemotional problems (Evans, 2003). Despite its significant contribution to the literature, this study did not evaluate distinct patterns of SES risk or mental and physical health outcomes in their sample of young children. Only one study has examined these patterns in a sample of emerging adults (Brody, Yu, Chen, Kogan, et al., 2013). Specifically, Brody and colleagues (2013) used latent profile analysis (LPA) to identify distinct patterns of SES risk and mental and physical health outcomes in 443 African American youth living in the rural south. Measures of SES risk were acquired between the ages of 11 and 13 years, psychological adjustment was assessed between the ages of 14 and 18 years, and AL indicators were collected at the age of 19. Findings from this study revealed five distinct profiles: low risk (low cumulative SES risk, low adjustment problems, low AL), resilience (high cumulative SES risk, low adjustment problems, low AL), physical health vulnerability (high cumulative SES risk, low adjustment problems, high AL), mental health vulnerability (moderate cumulative SES risk, high adjustment problems, low AL), and mental and physical health vulnerability (high cumulative SES risk, high adjustment problems, high AL). This landmark study showed that different stressors associated with low SES may lead to numerous mental and physical health outcomes among emerging adults.
To our knowledge, there is little or no comparable research with younger children to determine whether the patterns observed by Brody and colleagues (2013) emerge earlier in development. Although AL reflects cumulative wear and tear of the body over time, this weathering or damage to the body may begin in childhood. Empirical evidence has shown that stressful experiences are associated with physiological dysregulation in children (e.g., startle responses, blunted or elevated cortisol, inflammation; Danese & McEwen, 2012). Distinct patterns of SES risk, AL, and mental health may already be emerging in younger populations, setting the stage for poor health outcomes in adulthood. Therefore, it is important to examine whether such profiles are evident in younger children, when it may be possible to prevent or mitigate the cumulative effects of AL.
The current study used LPA to determine whether there were distinct patterns of cumulative SES risk, allostatic functioning, and mental health in a sample of low-income children. In contrast to the study by Brody et al. (2013), which used longitudinal data to examine patterns among SES risk, AL, and mental health, the current study used a cross-sectional design with a younger sample of children to examine latent profiles and their prevalence during an earlier developmental period.
Antecedents and Correlates of Mental and Physical Health Outcomes
The deleterious effect of childhood maltreatment on socioemotional development and adaptation has been noted by multiple empirical studies (Cicchetti & Toth, 2016). Similar findings have been found for physical health outcomes. For example, a comprehensive meta-analysis found that adverse childhood experiences were associated with higher levels of inflammation, as evidenced by increases in IL-6, CRP, and tumor necrosis factor alpha (Deighton et al., 2018). Other studies have produced mixed findings, with some evidence showing a strong link between childhood maltreatment and single biomarkers of AL (e.g., CRP; Cicchetti et al., 2015) but no direct association between childhood maltreatment and a multisystemic index of AL (Rogosch et al., 2011). However, these researchers found additive effects of AL and maltreatment on psychosocial functioning, such that maltreated children with high AL were more vulnerable to somatic complaints, attention problems, and thought problems (Rogosch et al., 2011). Furthermore, research suggests that different forms of childhood maltreatment (e.g., emotional abuse, physical abuse, neglect, sexual abuse) are related to different psychosocial and health outcomes (Cicchetti & Toth, 2016). Given the mixed findings on childhood maltreatment, the current study evaluated whether childhood maltreatment would be associated with distinct profiles of cumulative SES risk, allostatic functioning, and mental health.
Effective emotion regulation shows protective effects for psychosocial and physical outcomes among young people at risk because of experiences of chronic stress and adversity (Brody, Yu, Chen, Miller, et al., 2013). Emotion regulation entails an individual’s ability to inhibit, modulate, and control emotions, attention, and behaviors to achieve one’s goals (Eisenberg & Spinrad, 2004). Research has consistently shown that emotion regulation is associated with positive development; however, some work suggests that for children growing up in low-SES contexts, additional coping strategies may be essential for optimal development. For example, Chen et al. (2012) found that adults who grow up in low-SES households were more likely to have lower levels of AL when they utilized a shift-and-persist strategy, which encompasses the ability to reappraise stress and regulate negative emotions (shifting) while maintaining a focus on the future (persisting). Similar findings have been made for studies focused on the expression of positive or negative emotions (Dich et al., 2015). For example, research has shown that affect, especially positive affect, is associated with positive health behaviors and healthier biological responses (e.g., lower heart rate, blood pressure (BP), and CRP; Steptoe et al., 2009).
Personality is a set of dispositional traits that not only affects the appraisal and coping of stressful life experiences but also influences the way individuals perceive and self-report their health (Watson & Pennebaker, 1989). Therefore, the effects of low-SES environments on mental and physical health outcomes may be influenced by the individual’s personality. Empirical evidence on ego resiliency has supported this notion, showing that the ability to modify one’s control of their response to situational demands is associated with lower internalizing and externalizing problems (Juffer et al., 2004). Research with children and adolescents has shown that specific personality characteristics are associated with health and adjustment outcomes. Specifically, higher levels of neuroticism and lower levels of conscientiousness, extraversion, and agreeableness are associated with negative relationship outcomes (i.e., relationship abuse, dissatisfaction, and dissolution) and internalizing (i.e., anxiety and depression) and externalizing (i.e., antisocial behavior, impulsivity, and substance abuse) problems (Soto & Tackett, 2015). However, little is known about the association between personality characteristics and AL in children and adolescents (for exceptions, see Dich et al., 2015). Therefore, the second goal of the current study was to investigate how personality characteristics, emotion regulation, and affect were related to different profiles of cumulative SES risk, allostatic functioning, and mental health in low-income children.
Study Overview
In the current investigation, we evaluated patterns of cumulative SES risk, allostatic functioning, and mental health in a sample of low-income youth, extending the work of Brody and colleagues (2013). On the basis of their findings, we hypothesized that five profiles would emerge in the sample: low risk (low cumulative SES risk, low mental health problems, low AL), resilience (high cumulative SES risk, low mental health problems, low AL), physical health problems (high cumulative SES risk, low mental health problems, high AL), mental health problems (moderate cumulative SES risk, high mental health problems, low AL), and mental and physical health problems (high cumulative SES risk, high mental health problems, high AL).
The second aim of this study was to examine how childhood maltreatment, emotion regulation, affect, and personality characteristics were associated with these profiles. Specifically, we hypothesized that the low-risk and resilient groups would experience lower levels of childhood maltreatment, better emotion regulation, higher levels of positive affect, and lower levels of negative affect compared with the mental and physical health problems groups. We hypothesized that the low-risk and resilient profiles would exhibit higher levels of ego resiliency, conscientiousness, and openness to experience, consistent with prior work (Stephan et al., 2016). However, given the mixed findings on agreeableness, neuroticism, and extraversion, we did not have hypotheses about the association of these personality attributes with profiles.
Transparency and Openness
The study and analyses reported in this article were not preregistered. Because of the sensitive nature of the data, they are not publicly available. However, the materials, code, and other resources developed as part of the research reported for this study can be obtained through reasonable request to the corresponding author. This study involved an analysis of existing data that was approved by the University of Rochester Institutional Review Board.
Method
Participants
Participants included 491 children aged 8 to 12 years (Mage = 9.73, SD = 1.0; 52.1% male) who attended a summer research camp in an urban city in the Northeastern United States designed for school-aged, low-income, maltreated (n = 267) and nonmaltreated (n = 224) children across three consecutive years (2010–2012). The sample was racially diverse (children: 68.2% Black, 20.6% White, 10.4% multiracial, .4% Native American, and .4% other race; caregivers: 65.4% Black, 27.7% White, 2.9% multiracial, .2% Native American, .2% Asian American, and 3.7% other) and ethnically diverse (children: 21.2% Latinx; caregivers: 16.7% Latinx). Informed consent was obtained from all parents for their child’s participation in the summer-camp program and for examination of any Department of Human Services (DHS) records involving the family.
Children in the maltreated group were recruited through a DHS liaison who reviewed records to identify children who were a part of a family with a history of maltreatment. Children living in foster care were not recruited for the current investigation to differentiate the impact of child maltreatment from other stressors that may be attributed to frequent out-of-home care transitions. The DHS liaison contacted a random sample of eligible families and described the project. Parents who were interested were asked to sign a release form allowing their contact information to be shared with project staff for recruitment. These families were representative of those receiving services through the DHS.
Given that administrative reports of child maltreatment are overrepresented among low-income families (Sedlak et al., 2010), families from a larger group of individuals who were receiving Temporary Assistance for Needy Families (TANF) but did not have child-protective records were recruited to obtain a comparable group of families from low socioeconomic backgrounds in which children were not maltreated. A DHS liaison contacted a random sample of eligible families and described the project. Parents who were interested in participating signed a release allowing their contact information to be shared with project staff for recruitment. Families who received preventive DHS services because of the risk for maltreatment were not included in the nonmaltreatment group. To verify the lack of DHS involvement, trained research assistants interviewed the mothers of the children using the Maternal Child Maltreatment Interview (Cicchetti et al., 2003) and reviewed DHS records in the year following camp participation.
All sociodemographic information about the family and child (i.e., race/ethnicity) was reported by the participating caregivers. Children in the maltreated and nonmaltreated groups were comparable on a range of sociodemographic characteristics, including age, race, ethnicity, and maternal marital status (see Table 1). However, groups differed on gender, χ2(1) = 5.38, p = .02; maternal education, χ2(1) = 3.86, p = .05; income from public assistance, t(483.85) = 5.87, p < .01; and total family income, t(391.86) = 3.05, p < .01. Specifically, the maltreated group was more likely to have males, mothers with lower educational status, a higher reliance on public assistance, and a lower family income. With the exception of gender, all of these variables were included in our analyses as indicators of cumulative socioeconomic risk. Additional details about the study variables are provided in Tables S1 and S2 in the Supplemental Material.
Demographic and Descriptive Characteristics of the Sample
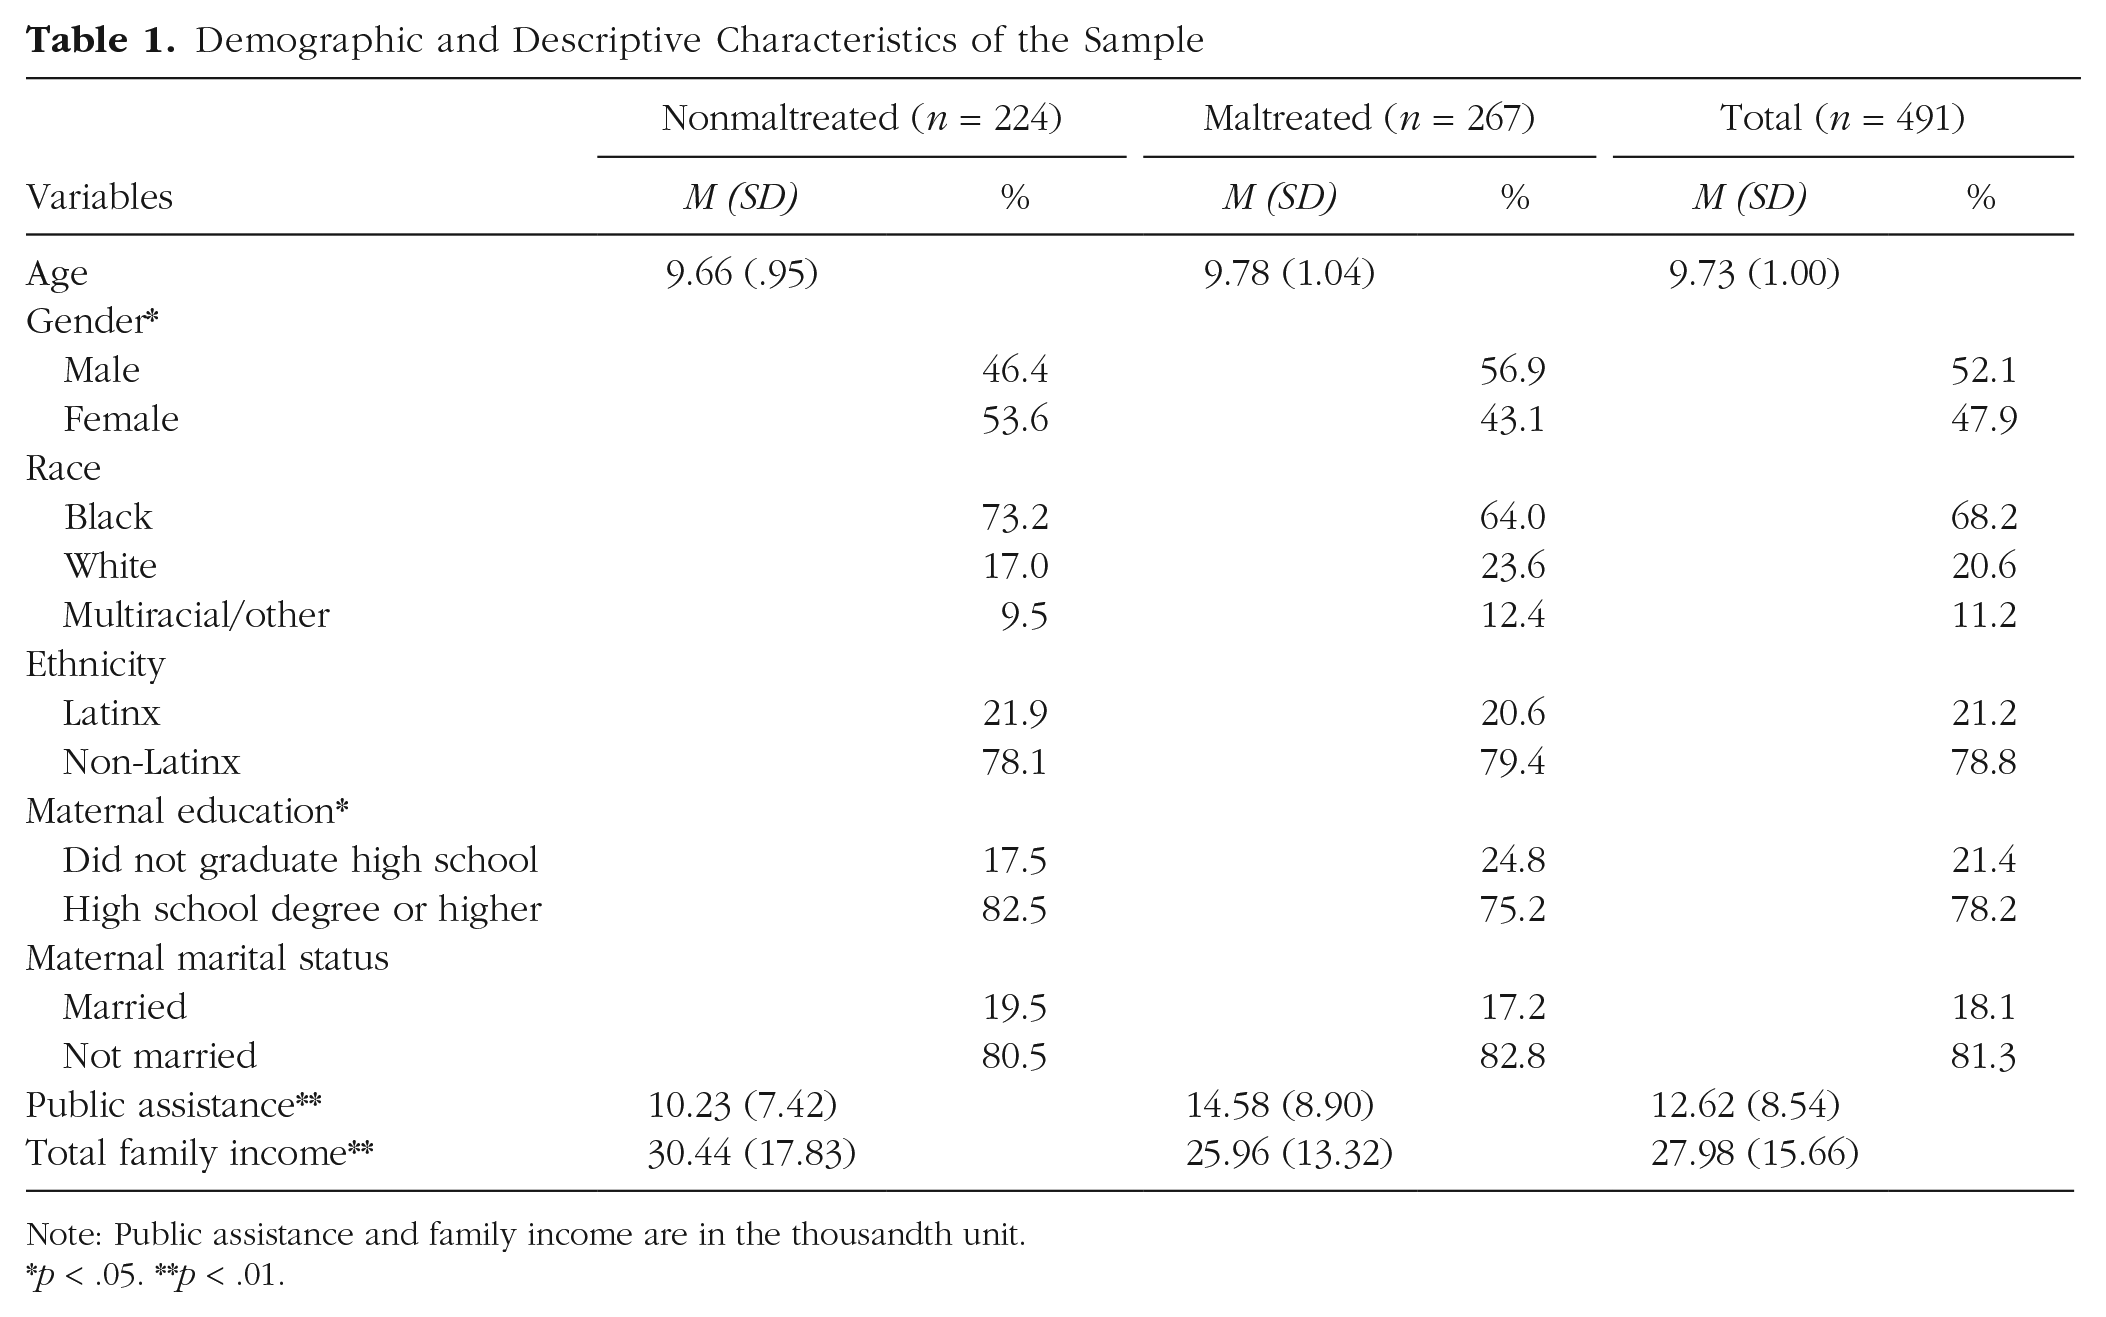
Note: Public assistance and family income are in the thousandth unit.*p < .05. **p < .01.
Procedures
Interested families and their children agreed to participate in a 5-day weeklong research summer day camp that lasted 7 hr each day (for detailed camp procedures, see Cicchetti & Manly, 1990). For approximately 45 min, children were transported by bus to the campsite each day. At the camp, children were randomly assigned to groups of 10 same-age and same-sex peers (five children were maltreated and five were nonmaltreated). Three trained camp counselors who were unaware of the children’s maltreatment status or the study’s hypotheses were assigned to each group. Following their assent, children participated in various recreational activities and research assessments, which included providing saliva samples for cortisol and CRP as well as additional indicators of AL. Throughout the week, trained research assistants also conducted individual research sessions with the youths and their caregivers, in which questionnaires and other research measures were administered. The camp counselors also completed measures on each child in their group based on their 35 hr of observations and interactions during the week. All research procedures were approved by the participating university’s institutional review board.
Measures
Cumulative socioeconomic risk
A composite measure of cumulative SES risk was computed on the basis of the risk factors associated with low SES. Eight dichotomous risk indicators (0 = absent, 1 = present) were averaged to assess cumulative risk. Consistent with prior literature (Brody, Yu, Chen, Kogan, et al., 2013; Evans, 2003), this study included five standard risk factors, including maternal age of 19 or younger at the birth of the target child (24%), single-parent family structure (81.3%), parent unemployment (45.2%), primary caregiver noncompletion of high school degree or GED (21.4%), and family poverty (42.4%). Poverty risk was assessed using the U.S. government criteria of dividing the total family income by the expected poverty level for each year. Families whose income fell below the federal poverty threshold were rated as being at risk due to poverty.
Three additional indicators were included to further differentiate socioeconomic risk among these low-income families. These indicators were closely related to constructs assessed in other studies of cumulative SES risk (e.g., Brody et al., 2013; Evans, 2003): inadequate income to meet financial needs, residential crowding, housing problems, and exposure to violence. In the current study, the three additional risk factors indexed caregiving burden, reliance on public assistance, and exposure to community violence. Caregiving burden was determined by calculating the ratio of adults to children living in the household. Families whose ratio was below the median were assigned a risk score of 1 (29.7%), indicating higher caregiving burden. To assess the families’ inability to meet their financial needs, a risk indicator assessing the families’ reliance on public assistance was calculated by dividing the proportion of income the family received in public assistance by total family income. Families who received 50% or more of their income from public assistance were given a risk score of 1 (53.8%), indicating higher reliance on public assistance to meet financial needs. Finally, community violence was assessed using 22 items (M = 8.32, SD = 6.48) from the National Institute of Mental Health community violence project (Richters & Martinez, 1993), which measured whether youth had witnessed violence (e.g., “I have seen somebody arrested”), was a victim of violence (e.g., “I have been beaten up”), or was exposed to violence in the home (e.g., “Grown ups in my home hit each other”) on a 3-point scale (0 = never, 2 = more than once). Participants with scores equal to or greater than the median of 7 (range = 0–40) were given a risk score of 1 (52.3%), indicating higher exposure to community violence.
Allostatic load
The AL composite consisted of five well-established biomarkers of physiological dysregulation representing multiple physiological systems (e.g., neuroendocrine, immune, metabolic, cardiovascular; Juster et al., 2010). These biomarkers included BMI, waist-hip ratio (WHR), BP, cortisol, and CRP. Each biomarker was coded dichotomously as 0 if the child did not meet the criteria for risk on the biomarker or 1 if the child was classified as at risk for the biomarker, consistent with prior research (Brody et al., 2013; Evans, 2003; Rogosch et al., 2011). In some cases, risk on a biomarker reflects extreme scores in one direction, whereas in other cases, dysregulation is indicated by either very high or very low scores. Scores were dichotomized on the basis of existing theoretical and empirical work (Brody et al., 2013; Evans, 2003; McEwen, 2019). For BMI and cortisol, both low and high scores were classified as meeting the criteria for risk because extant literature suggests that too little or too much of these biomarkers indicates poor allostatic functioning (Juster et al., 2010; McEwen, 2019). For WHR, BP, and CRP, AL is associated in the literature only with high scores. A total AL score was then calculated as the sum of the scores on the five dichotomous indicators, ranging from 0 to 5.
BMI
Children’s height and weight was measured on a single occasion. Height was measured with a measuring tape while the child was standing against a wall, whereas weight was measured using a digital scale. BMI was calculated by converting height into centimeters and weight into kilograms. Weight was divided by height using an Excel BMI calculator that considered differences in BMI on the basis of age and gender, consistent with guidelines proposed by Barlow (2007). The generated percentiles were used to determine the classification for BMI risk. Children were classified either as underweight (weight < 5th percentile), normal (weight 5th–85th percentile), overweight or obese (weight ≥ 95th percentile). A BMI risk score of 1 was assigned to children who were classified as underweight, overweight, or obese (45.8%).
WHR
Waist circumference was measured at the top of the youth’s hipbone, level with the naval, and hip circumference was measured around the fullest part of the youth’s hips. WHR was calculated by dividing waist by hip circumference. Children whose WHR exceeded 1 SD above the mean of the sample was given a risk-factor score of 1 (13%). Although both BMI and WHR account for adiposity, these measures have been associated with different health outcomes for men and women (Wiltink et al., 2013); therefore, both biomarkers were included in the AL composite.
Blood pressure
Resting SBP and DBP were assessed on three separate camp days by a trained research assistant using a 760 series Prosphyg aneroid sphygmomanometer and Adscope Sprague stethoscope. The three readings of SBP (M = 106.05, SD = 6.92) and DBP (M = 64.46, SD = 6.71) were averaged. These values as well as the child’s age in months and height in centimeters were uploaded to a software package (https://apps.cpeg-gcep.net/BPZ_cpeg) that calculated the percentiles for BP on the basis of the guidelines proposed by the American Academy of Pediatrics (Flynn et al., 2017). Children whose BP values were within the 90th and 99th percentile and were designated as having elevated BP, Stage 1 hypertension, and Stage 2 hypertension were given a risk score of 1 (18.7%).
Cortisol
Saliva samples were obtained three times per day across the course of the camp week. For each child, trained research assistants collected saliva samples at 9:00 a.m. on their arrival to camp, at 12:00 p.m., and 4:00 p.m. before their departure. To avoid the volatility of the dynamic cortisol awakening response (Susman et al., 2007), children’s saliva samples were obtained after their 45-min bus transportation and initial greeting with staff members. The collection of samples followed a standard protocol recommended by Schwartz et al. (1998). Children did not consume food or drink for at least 30 min prior to each saliva sample. The children were asked to chew Trident sugar-free gum to stimulate saliva production and then passively drool through a short drinking straw into a 20-ml plastic vial. The samples were immediately frozen and stored at −40 °C. Each week samples were shipped overnight on dry ice to Salimetrics (State College, PA). After thawing, each sample was processed by placing four to five 1-ml aliquots into 1.8-ml cryogenic storage vials and frozen at −80 °C. After assaying, samples were thawed at room temperature and centrifuged at 3,000 rpm for 15 min. The clear top plastic of the sample was pipetted into appropriate test tubes/wells.
Salivary cortisol (µg/dl) was assayed using an enzyme immunoassay kit (Salimetrics). This kit is commercially available and uses 25 µl of saliva. Its lower limit of sensitivity is 0.007 µl/dl, with a range up to 1.8 µg/dl and an average intra- and interassay coefficient of variation of < 5.0% and 10.0%, respectively. Cortisol values were log-transformed given high skewness and kurtosis. Log-transformed values were averaged across the days, yielding a mean morning assessment of cortisol (M = −.81, SD = .19), a mean afternoon assessment of cortisol (M = −1.00, SD = .17), and a mean evening assessment of cortisol (M = −1.10, SD = .17). Using the log-transformed averages, three indicators were created to measure both hypo- and hypercortisol levels (i.e., blunted or elevated cortisol, respectively). The creation of these three indicators was consistent with research on the diurnal pattern of cortisol reactivity (i.e., high levels in the morning at waking, dramatic increase in cortisol production after waking with a general decline across the day, and lower levels in the evening hours; Adam & Kumari, 2009; Pruessner et al., 1997). Morning cortisol risk was designated for children whose morning cortisol values were 1 SD below the sample mean. Mean diurnal change scores were calculated by subtracting the morning values from the evening values. Children were assigned to four quartiles on the basis of their morning cortisol values. Flattened diurnal cortisol risk was assigned to children whose cortisol levels changed less than −1 SD relative to the children in each quartile. A third indicator of hypercortisol production was assigned to children whose scores were 1 SD above the sample mean for both their morning and evening values. A composite variable was created to reflect hypo- and hypercortisol risk by assigning a score of 1 for children who received a risk score on one or more of the cortisol indicators (29.9%).
CRP
Saliva samples were collected through passive drools once per day for three afternoons during the camp week. All samples were assayed using a commercially available immunoassay protocol recommended by the manufacturer. The test volume was 15 µl, with a range from 93.75 to 3,000 pg/ml and an intra- and interassay coefficients of variation < 10% and 15%, respectively. To address skewness and kurtosis, CRP values were log-transformed and averaged across the 3 days, resulting in a mean CRP score (M = 3.42, SD = .61). Children whose CRP values were 1 SD above the sample mean were assigned a CRP risk score of 1 (18.5%).
Mental health
To assess psychosocial adjustment, youth reported on their anxiety, depressive symptoms, and self-esteem. Trained research assistants read and administered the self-reported measures to account for discrepancies in children’s reading or comprehension levels. Camp counselors reported on youth’s internalizing and externalizing symptoms, and peers provided ratings of youth’s prosocial competence. Measures assessing depression, internalizing symptoms, and externalizing symptoms were similar to those utilized in previous studies (Brody et al., 2013; Evans, 2003), except that more age-appropriate measures (anxiety vs. substance use, prosocial competence vs. delinquent behaviors) were used to assess mental health outcomes in this sample.
Anxiety
The Revised Children’s Manifest Anxiety Scale (Reynolds & Richmond, 1979) was used to assess youth’s anxiety (M = 8.58, SD = 6.87, range = 0–28). Twenty-eight items (e.g., “I worry about what other people think about me”) were rated on a dichotomous scale (0 = no, 1 = yes), with higher values indicating more anxiety symptoms (α = .91).
Depression
Youth’s depressive symptoms were assessed using the 27 items from the Child Depression Inventory (Kovacs, 1992). Children were asked to choose from among three options (e.g., 0 = I am sad once in a while, 1 = I am sad many times, 2 = I am sad all the time) that best described their feelings and ideas in the past 2 weeks. Scores were summed, with higher values indicating more depressive symptoms (M = 6.70, SD = 6.73, range = 0–42, α = .85). Ten percent of the youth in this study met the criteria (i.e., total score ≥ 19) for a clinical level of depressive symptoms (Kovacs, 1992).
Self-esteem
The Coppersmith Self-Esteem Inventory (Coopersmith, 1967) was used to assess youth’s self-esteem. The 50-item measure (e.g., “Most people are better liked than I am”) was rated on a dichotomous scale (0 = unlike me, 1 = like me). Items were summed and recoded so that higher values indicated lower self-esteem (M = 14.98, SD = 7.41, range = 1–40, α = .85).
Internalizing and externalizing symptoms
Youth’s internalizing and externalizing symptoms were assessed using the Child Behavior Checklist Teacher Report Form (TRF; Achenbach, 1991). After observing and interacting with children for 35 hr, camp counselors were asked to evaluate each of the children who were in their group at the end of the week. The TRF is a valid measure that is widely used to assess children’s behavioral symptomatology by teachers. Therefore, the TRF was completed by camp counselors for this study because they were able to observe children in a context that was similar to a classroom-based setting. The TRF has 118 items that assess eight symptom scales (i.e., withdrawn, somatic complaints, anxiety/depression, social problems, thought problems, attention problems, delinquent behavior, and aggressive behavior) and two broadband dimensions of child psychopathology (i.e., internalizing and externalizing) on a 3-point scale (0 = not true, 2 = very true or often true). Average interrater reliability among pairs of raters was acceptable for internalizing (κ = .67) and externalizing (κ = .83) symptoms. Raw scores ranged from 0 to 26 (M = 4.14, SD = 4.34, range = 0–72) and 0 to 55.50 (M = 9.03, SD = 11.20, range = 0–68) for internalizing and externalizing symptoms, respectively.
Prosocial competence
On the final day of camp, children evaluated the characteristics of their peers in their respective camp groups using a peer-rating method (Coie & Dodge, 1983). Counselors conducted this sociometric assessment with each child. Children were given six brief behavioral descriptors characterizing different types of social behavior that were rated on a 3-point scale (not true, sort of true, and very true). Two of the behavioral descriptors that characterized youth’s cooperative (e.g., “Child name helps out”) and leadership (e.g., “Child name is chosen as a leader”) qualities were used to create an assessment of prosocial competence. For each item, all peer ratings were averaged to obtain a mean peer rating for each child. Scores for the leader and cooperative descriptors were then reverse-coded and summed together to reflect poor prosocial competence (M = 2.73, SD = .84, range = 1–5).
Childhood maltreatment
Children’s experiences of childhood maltreatment were assessed using the Maltreatment Classification System (MCS; Barnett et al., 1993). The MCS utilizes DHS records, which provided detailed information regarding the investigations and findings associated with each maltreatment case. Coding is based on all available information and does not rely on DHS determinations (for coding details, see Barnett et al., 1993). Trained research staff and a clinical psychologist independently coded the subtypes of maltreatment individual children have experienced (i.e., emotional maltreatment, physical abuse, sexual abuse, and neglect), the severity of each subtype of maltreatment, the frequency of the occurrence, the developmental periods in which the maltreatment occurred, and the perpetrator of the maltreatment. The reliabilities of the coders were good, with κs ranging from .90 to 1.00.
Emotional regulation
The Emotion Regulation Checklist (Shields & Cicchetti, 1997) was used to assess emotionality and regulation in children. Camp counselors completed the 24-item measure on a 4-point scale (1 = never, 4 = almost always). On the basis of previous psychometric work (Shields & Cicchetti, 1998), 13 selected items were used to create the subscales for lability/negativity (e.g., is easily frustrated), inappropriate affect (e.g., is overly exuberant when attempting to engage in play), and emotional regulation (e.g., can say when she/he is feeling sad, angry or mad, fearful or afraid). Lability/negativity (M = 2.03, SD = .67, range = 1–3.75, α = .91) and inappropriate affect (M = 1.48, SD = .42, range = 1–3.50, α = .70) were assessed using four items each, and emotional regulation (M = 3.01, SD = .51, range = 1.50–4, α = .81) was assessed using five items. Higher scores on lability/negativity and inappropriate affect indicate greater emotional dysregulation, whereas higher scores on the emotional-regulation subscale indicate a child’s capacity to manage and modulate their emotions more effectively in response to external events. The average intraclass correlation (ICC) among pairs of raters for the three subscales ranged from .64 to .79.
Positive and negative affect
The child version of the Positive and Negative Affect Schedule (Laurent et al., 1999) was used to assess youth’s positive and negative affect. The 27-item measure is rated on a 5-point Likert scale (1 = very slightly or not at all, 5 = extremely), with 12 items assessing positive affect (e.g., cheerful) and 15 items assessing negative affect (e.g., afraid). Reliabilities for positive (M = 4.06, SD = .73, range = 1.08–5, α = .82) and negative (M = 1.80, SD = .74, range = 1.0–4.60, α = .88) affect were acceptable.
Ego resiliency
Youth’s ego resiliency was assessed using the California Child Q-Set (CCQ; Block & Block, 1969). The CCQ consists of 100 items that are given on a fixed distribution to evaluate children’s personality, cognitive, and social characteristics. Camp counselors independently completed the CCQ for a subset of children at the end of the camp week after 35 hr of interactions and observations. Raters sorted individual items (e.g., has insights into own motives and behaviors, is self-defeating) into nine categories, ranging from the most to least characteristics of the individual child. Scores were correlated to generate a profile for each child. Higher values on the ego resiliency subscale (M = .31, SD = .30, range = −.53–.73, ICCraters = .83) indicate a child’s ability to modify their level of control in response to external demands.
Personality
Youth’s personality characteristics were assessed using the Five-Factor Model Rating Scale (Hagekull & Bohlin, 1998). The 46-item measure comprises five subscales: openness to experience (e.g., tries new activities), conscientiousness (e.g., dependable), extraversion (e.g., bold), agreeableness (e.g., cooperative), and neuroticism (e.g., worries about things). Campus counselors rated items on a 5-point Likert scale (1 = not at all true, 5 = very true), indicating the extent to which each item is characteristic of the child. The reliabilities for openness to experience (M = 3.18, SD = .69, range = 1–4.75, α = .79), conscientiousness (M = 3.58, SD = .66, range = 1.6–4.8, α = .92), extraversion (M = 3.50, SD = .71, range = 1.61–4.72, α = .90), agreeableness (M = 3.46, SD = .81, range = 1.23–4.81, α = .95), and neuroticism (M = 2.10, SD = .52, range = 1.10–4.25, α = .69) were acceptable. The average ICC among pairs of raters for the five subscales ranged from .63 to .87.
Data-analysis strategy
For the first set of analyses, LPA was conducted in Mplus Version 8.4 (Muthén & Muthén, 2017) to identify different patterns of cumulative risk, AL, and mental health. LPA is a person-centered approach that involves the evaluation of several models, starting from a one-class solution until a final class solution is obtained. The final class solution was determined by several fit indices, including the Akaike information criterion (AIC; Akaike, 1987); Bayesian information criterion (BIC; Schwarz, 1978); sample-size-adjusted (SSA) BIC (Sclove, 1987), in which the lowest values indicate the best-fitting model; and the Lo-Mendell-Rubin (LMR) likelihood-ratio test (Lo et al., 2001), in which a significant p value indicates the rejection of the k-1 class model in favor of the k class solution (Nylund et al., 2007). The entropy index was used as an assessment for the quality of classes, with higher values (> .80; Muthén, 2007) indicating more accuracy and discrimination in the classification. In addition to the model-fit indices, decisions about the final solution were based on the posterior probabilities, size of classes, class distinction, and meaningful interpretation. Finally, full information maximum likelihood was used to account for missing data on the observed variables.
The LPAs were performed in three different stages. In the first stage, two LPAs were estimated. The first LPA included the variables of cumulative SES risk and AL, and the second LPA included only the mental health variables. Given that the mental health variables were reported by different informants and assess various metrics of psychological functioning, these variables were included separately in the LPA models. The second stage included a combined model with all the variables. For the third stage, the final solution from the first two models was entered together to evaluate a confirmatory LPA.
For the second set of analyses, χ2 tests and one-way analyses of variance (ANOVAs) were computed in IBM SPSS Version 25 to evaluate differences in the variables of cumulative SES risk, AL, and mental health across latent profiles. Latent class differences in sociodemographic characteristics, childhood maltreatment, emotion regulation, affect, and personality were also evaluated. A z-test was used to evaluate comparisons for the χ2 analyses. For ANOVAs with a significant F value, a Tukey honest significant difference post hoc test was used to evaluate comparisons across two groups. Bonferroni correction was applied to the post hoc analyses to account for Type 1 error (α = .05/number of comparisons = 10). Therefore, all comparisons had to be equal to or lower than .005 to be considered significant. Phi and eta-squared effect sizes were provided with the corresponding tests. Because there were significant gender differences between children who were in the maltreated and nonmaltreated groups, we also evaluated comparisons using analysis of covariance tests to control for the effects of child gender. These results were consistent with the ANOVA results that did not control for child gender.
Results
LPA models
The first LPA model was estimated using cumulative SES risk and AL (for model-fit statistics, see Table 2). Although the AIC value was lower for the four-class model, both the BIC and SSA BIC values supported a three-class solution. Similarly, the LMR likelihood-ratio test indicated that a three-class solution was more favorable than a two-class model (p < .05) but was not substantially different from the four-class model (p = .46). Moreover, a five-class model did not differ significantly from a four-class solution (p = .42; see Fig. 1a).
Fit Indices for Latent Class Models
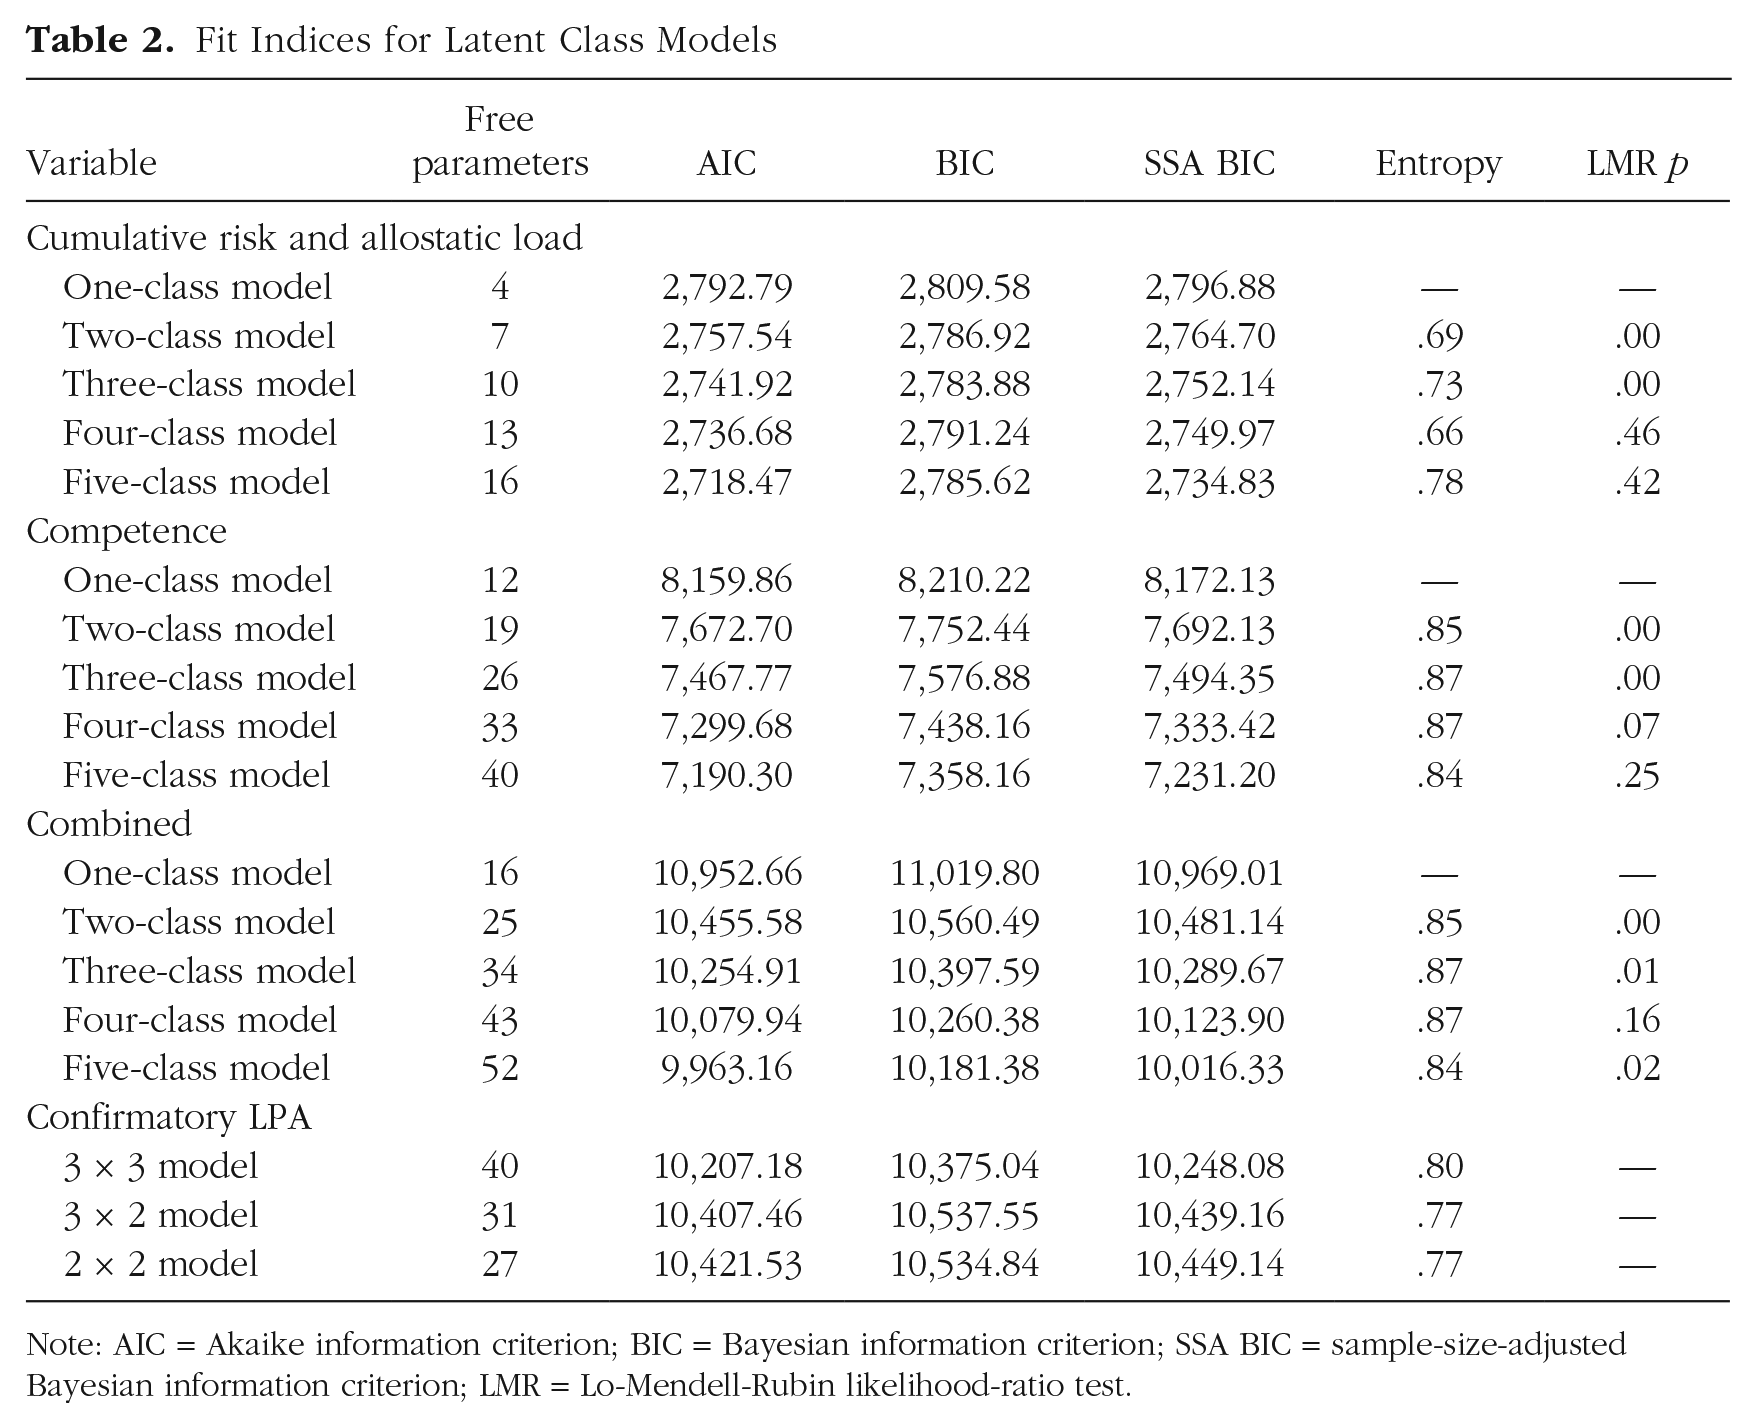
Note: AIC = Akaike information criterion; BIC = Bayesian information criterion; SSA BIC = sample-size-adjusted Bayesian information criterion; LMR = Lo-Mendell-Rubin likelihood-ratio test.
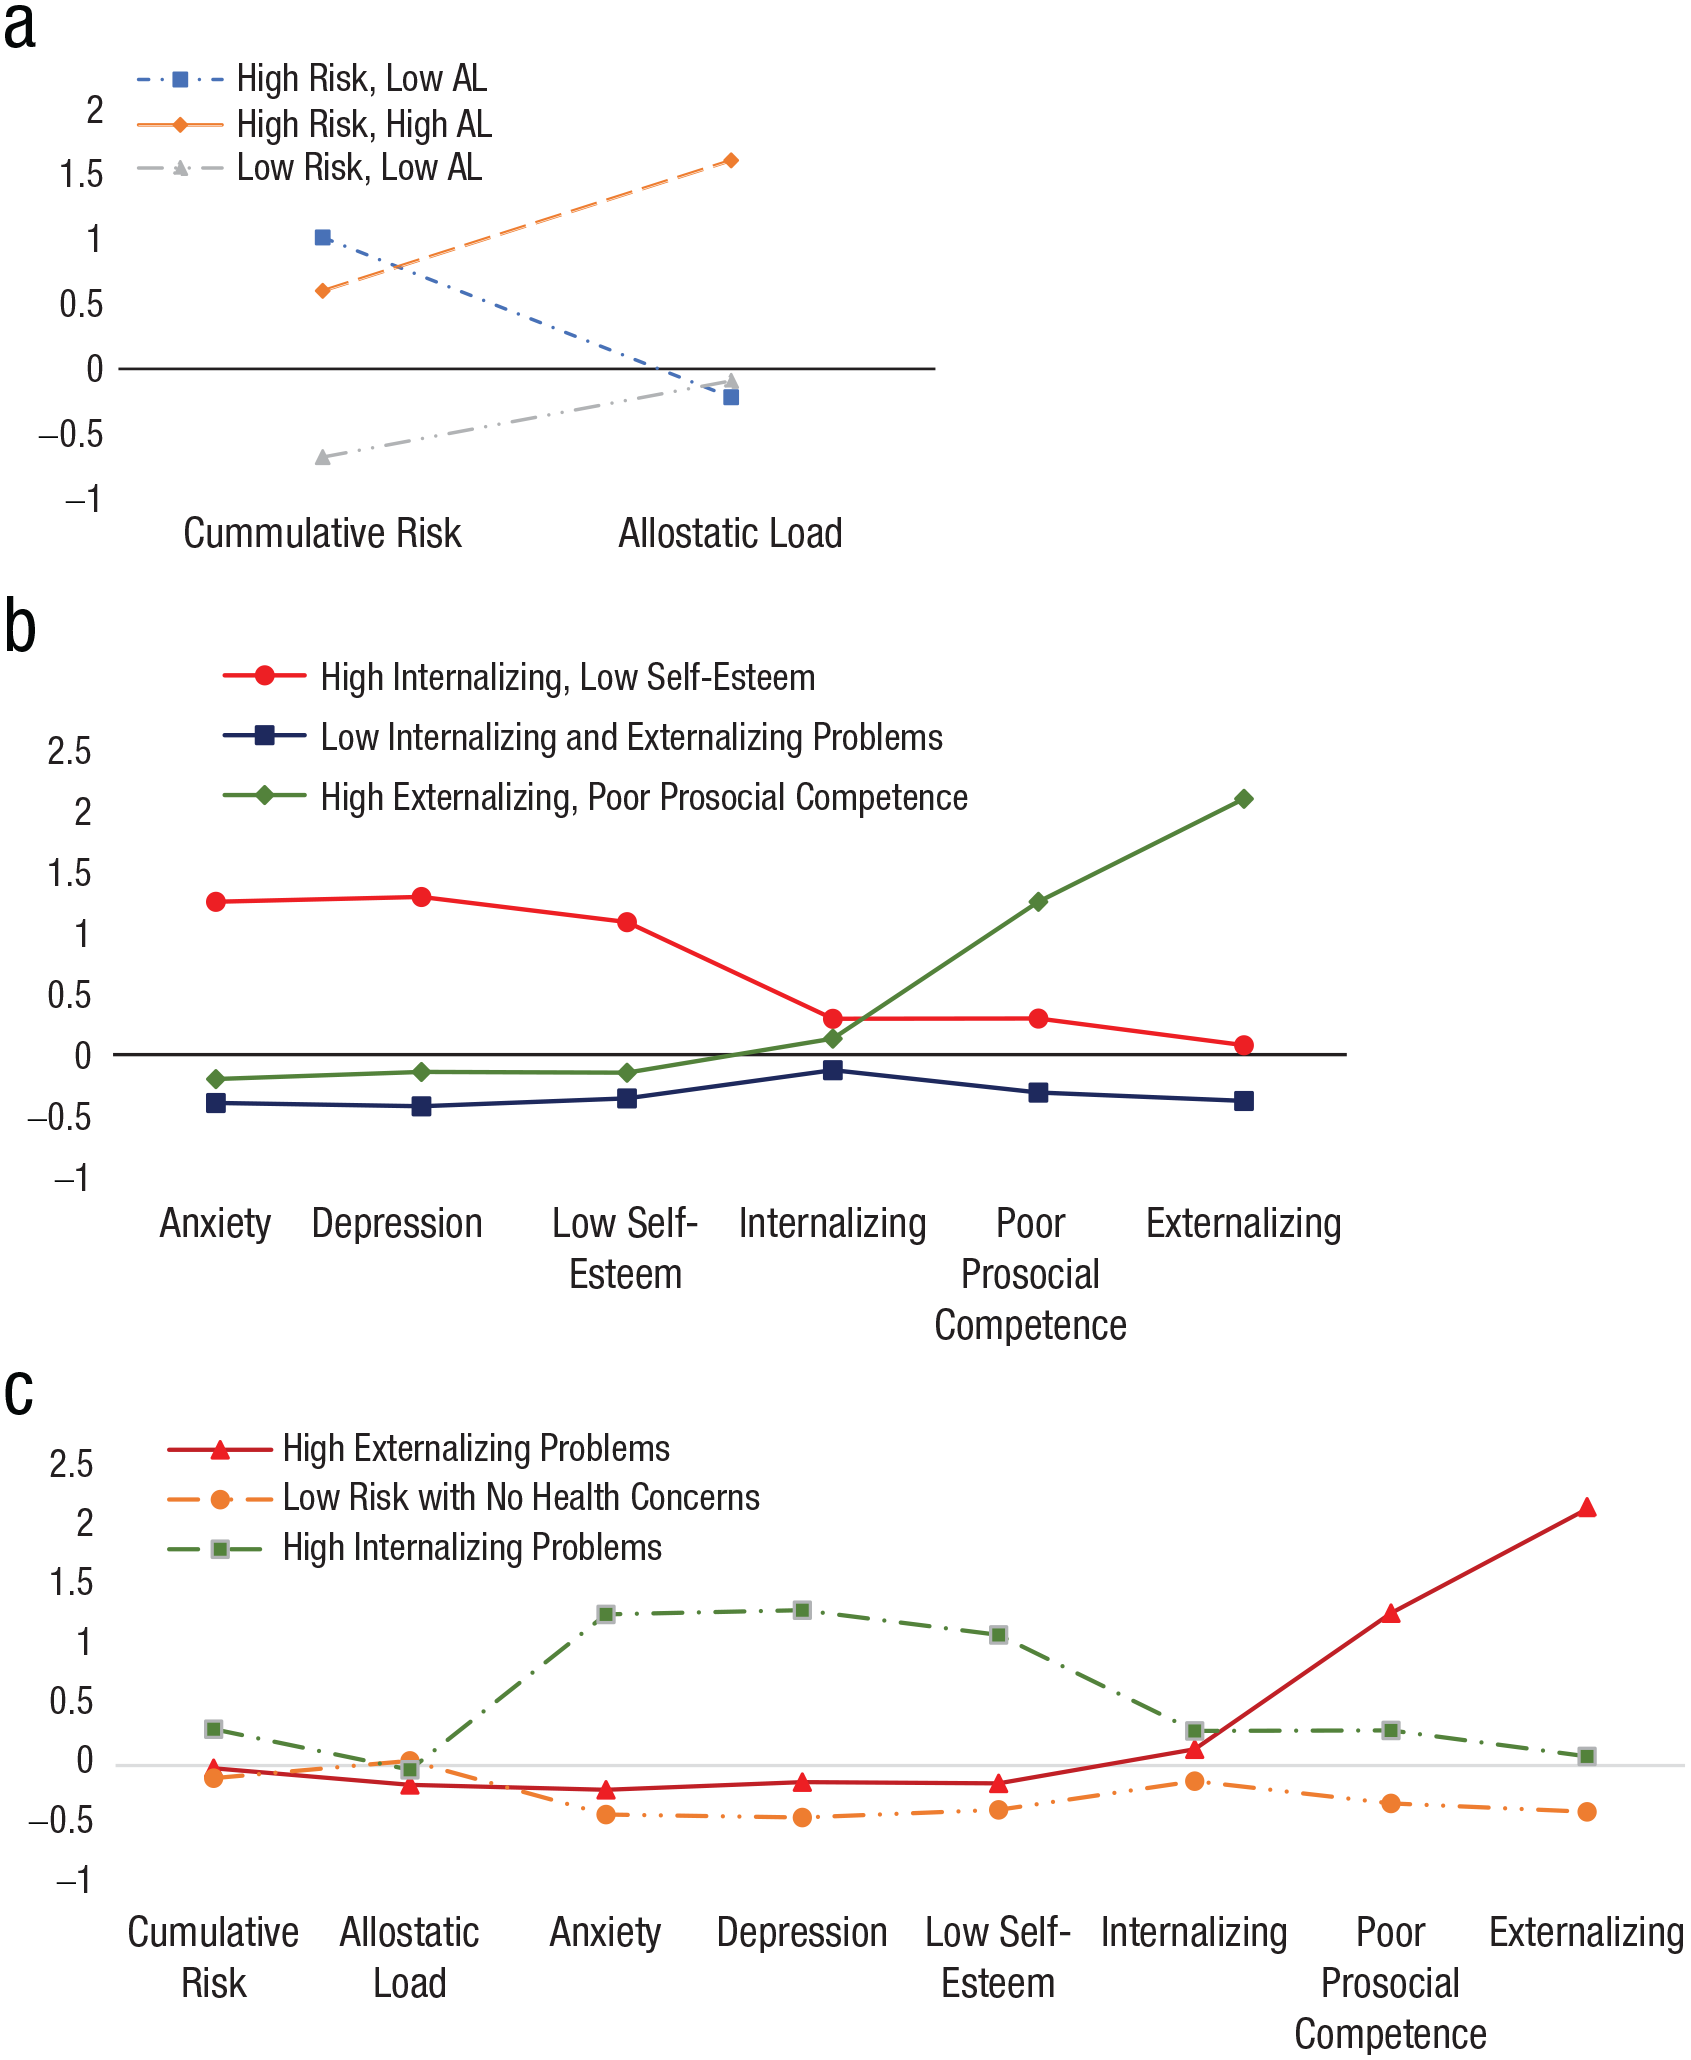
Latent profiles of cumulative risk, allostatic load, and psychosocial adjustment. The graphs show cumulative socioeconomic status risk and allostatic load (a), psychosocial adjustment variables (b), and a combined model with all variables (c).
The second LPA model evaluated the patterns of mental health using measures of anxiety, depression, self-esteem, prosocial competence, and internalizing and externalizing symptoms. The AIC, BIC, and SSA BIC provided support for the four-class model solution. However, the LMR likelihood-ratio test suggested that a three-class model was more favorable than the two-class model (p < .05) and less distinguishable from the four-class model (p = .07). The five-class model did not differ significantly from the four-class model (p = .25). Therefore, the three-class model was chosen as the most favorable model (see Fig. 1b).
Before evaluating the confirmatory LPA, we estimated a model that combined all the variables to determine whether the profiles would be consistent with the results from the previous models. The AIC, BIC, and SSA BIC values supported a four-class solution. However, whereas the LMR likelihood-ratio test indicated that the three-class model was more favorable than the two-class model (p < .05), there was less distinction found for the four-class model (p = .16). Although the five-class model significantly differed from the four-class model (p = .02), the entropy dropped, and the profiles were less distinct. More notably, there was little variation seen in cumulative SES risk and AL (see Fig. 1c).
The final models from the first two solutions were estimated in one overall model. Two categorical latent variables were entered into the model, and the final solution was determined by adequate sample size, distinction of the classes, and logical patterns of the data. The confirmatory LPA 3 × 3 model had the lowest AIC, BIC, and SSA BIC values as well as a higher entropy; however, this model identified three classes that captured less than 5% of the data. As a result, a 3 × 2 confirmatory LPA was evaluated. Although the entropy fell below .80 and one of the classes was less than 5%, this class solution produced meaningful interpretation and distinction across the six classes and was consistent with prior work (Brody et al., 2013). Moreover, a 2 × 2 confirmatory LPA did not capture the variation in AL. Therefore, the 3 × 2 confirmatory LPA was chosen as the final class solution.
Latent class profiles: cumulative SES risk, AL, and mental health
The standardized means for the six latent class profiles are depicted in Figure 2. Table 3 presents the mean scores on the variables of cumulative risk, AL, and mental health for all six classes. One-way ANOVAs were also evaluated to determine what observed measures varied significantly across the six classes. Profile A (low risk with no mental or physical health concerns) displayed low levels of cumulative SES risk, AL, and mental health problems and made up the largest number of youth (n = 253). Profile B (low risk with mental health concerns) included 46 youths who experienced lower levels of cumulative SES risk and AL but higher rates of mental health problems. Profile C (high risk with no mental or physical health concerns, otherwise referred to as the resilient group) comprised 97 youths who despite exposure to high levels of cumulative SES risk displayed lower levels of AL and mental health problems. Profile D (high risk with mental health concerns) comprised 65 youths who experienced higher levels of cumulative SES risk and mental health problems but lower levels of AL. Profile E (high risk with physical health concerns) included 22 youths who displayed higher levels of cumulative SES risk and AL but lower levels of mental health problems. Finally, Profile F (high risk with mental and physical health concerns) comprised less than 2% of the sample; however, this small subset of individuals (n = 8) was relatively distinct from their peers. They displayed substantially higher levels of cumulative SES risk, AL, and mental health problems compared with other youths. Although the profile of high risk with mental and physical health concerns were meaningfully distinct from the other five profiles, the size of this group was not sufficient to capture true mean differences between groups; therefore, the sixth profile was excluded from further analyses.
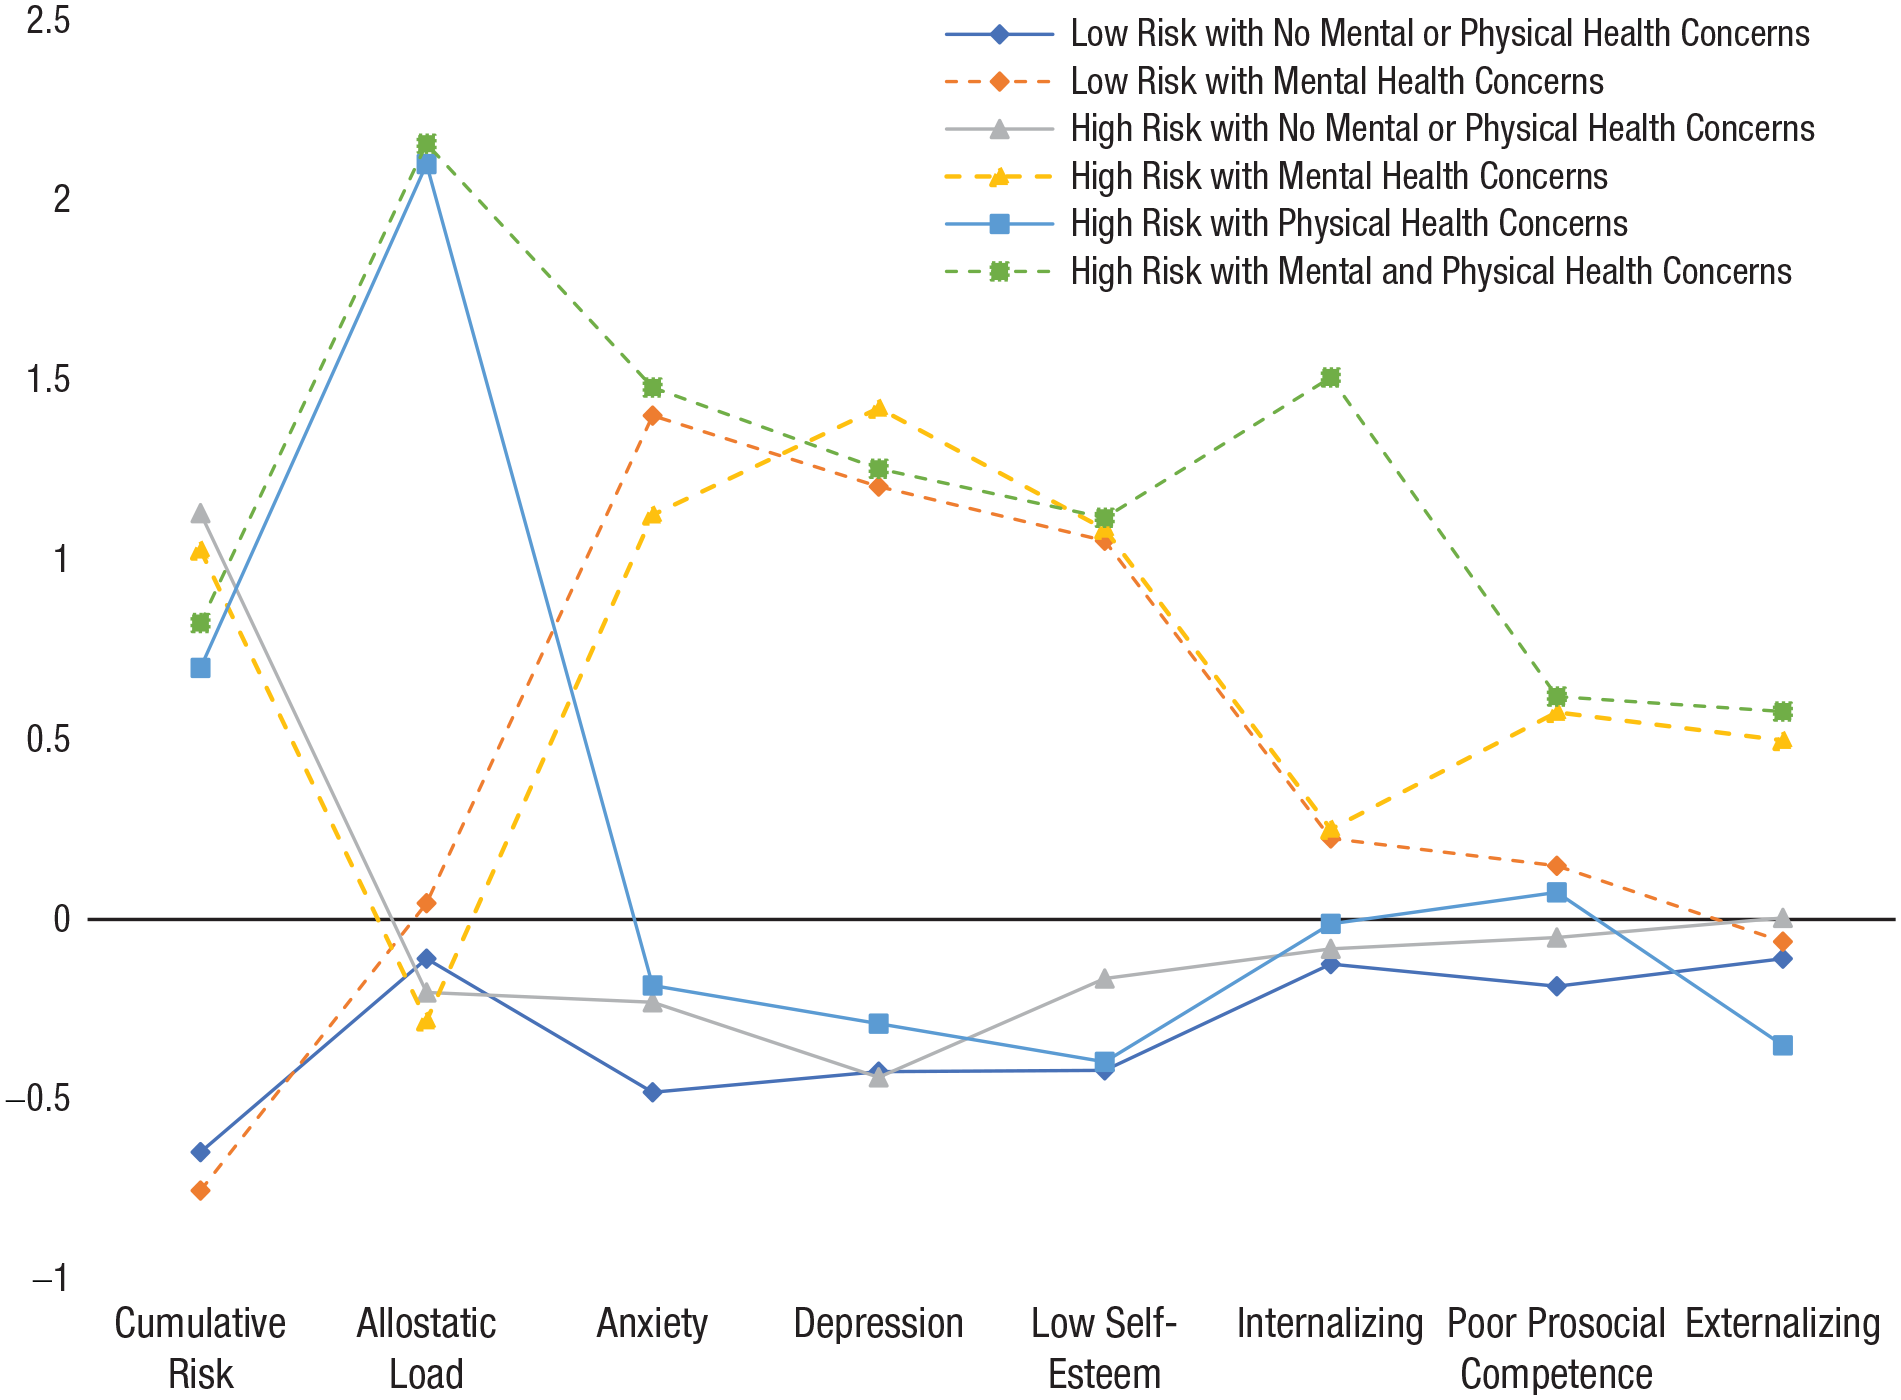
Latent profiles based on the 3 × 2 confirmatory latent profile analysis. Standardized scores are depicted in the graph.
Descriptive Statistics and Analysis of Variance of Cumulative Risk, Allostatic Load, and Psychosocial Adjustment for the Latent Profile Classes
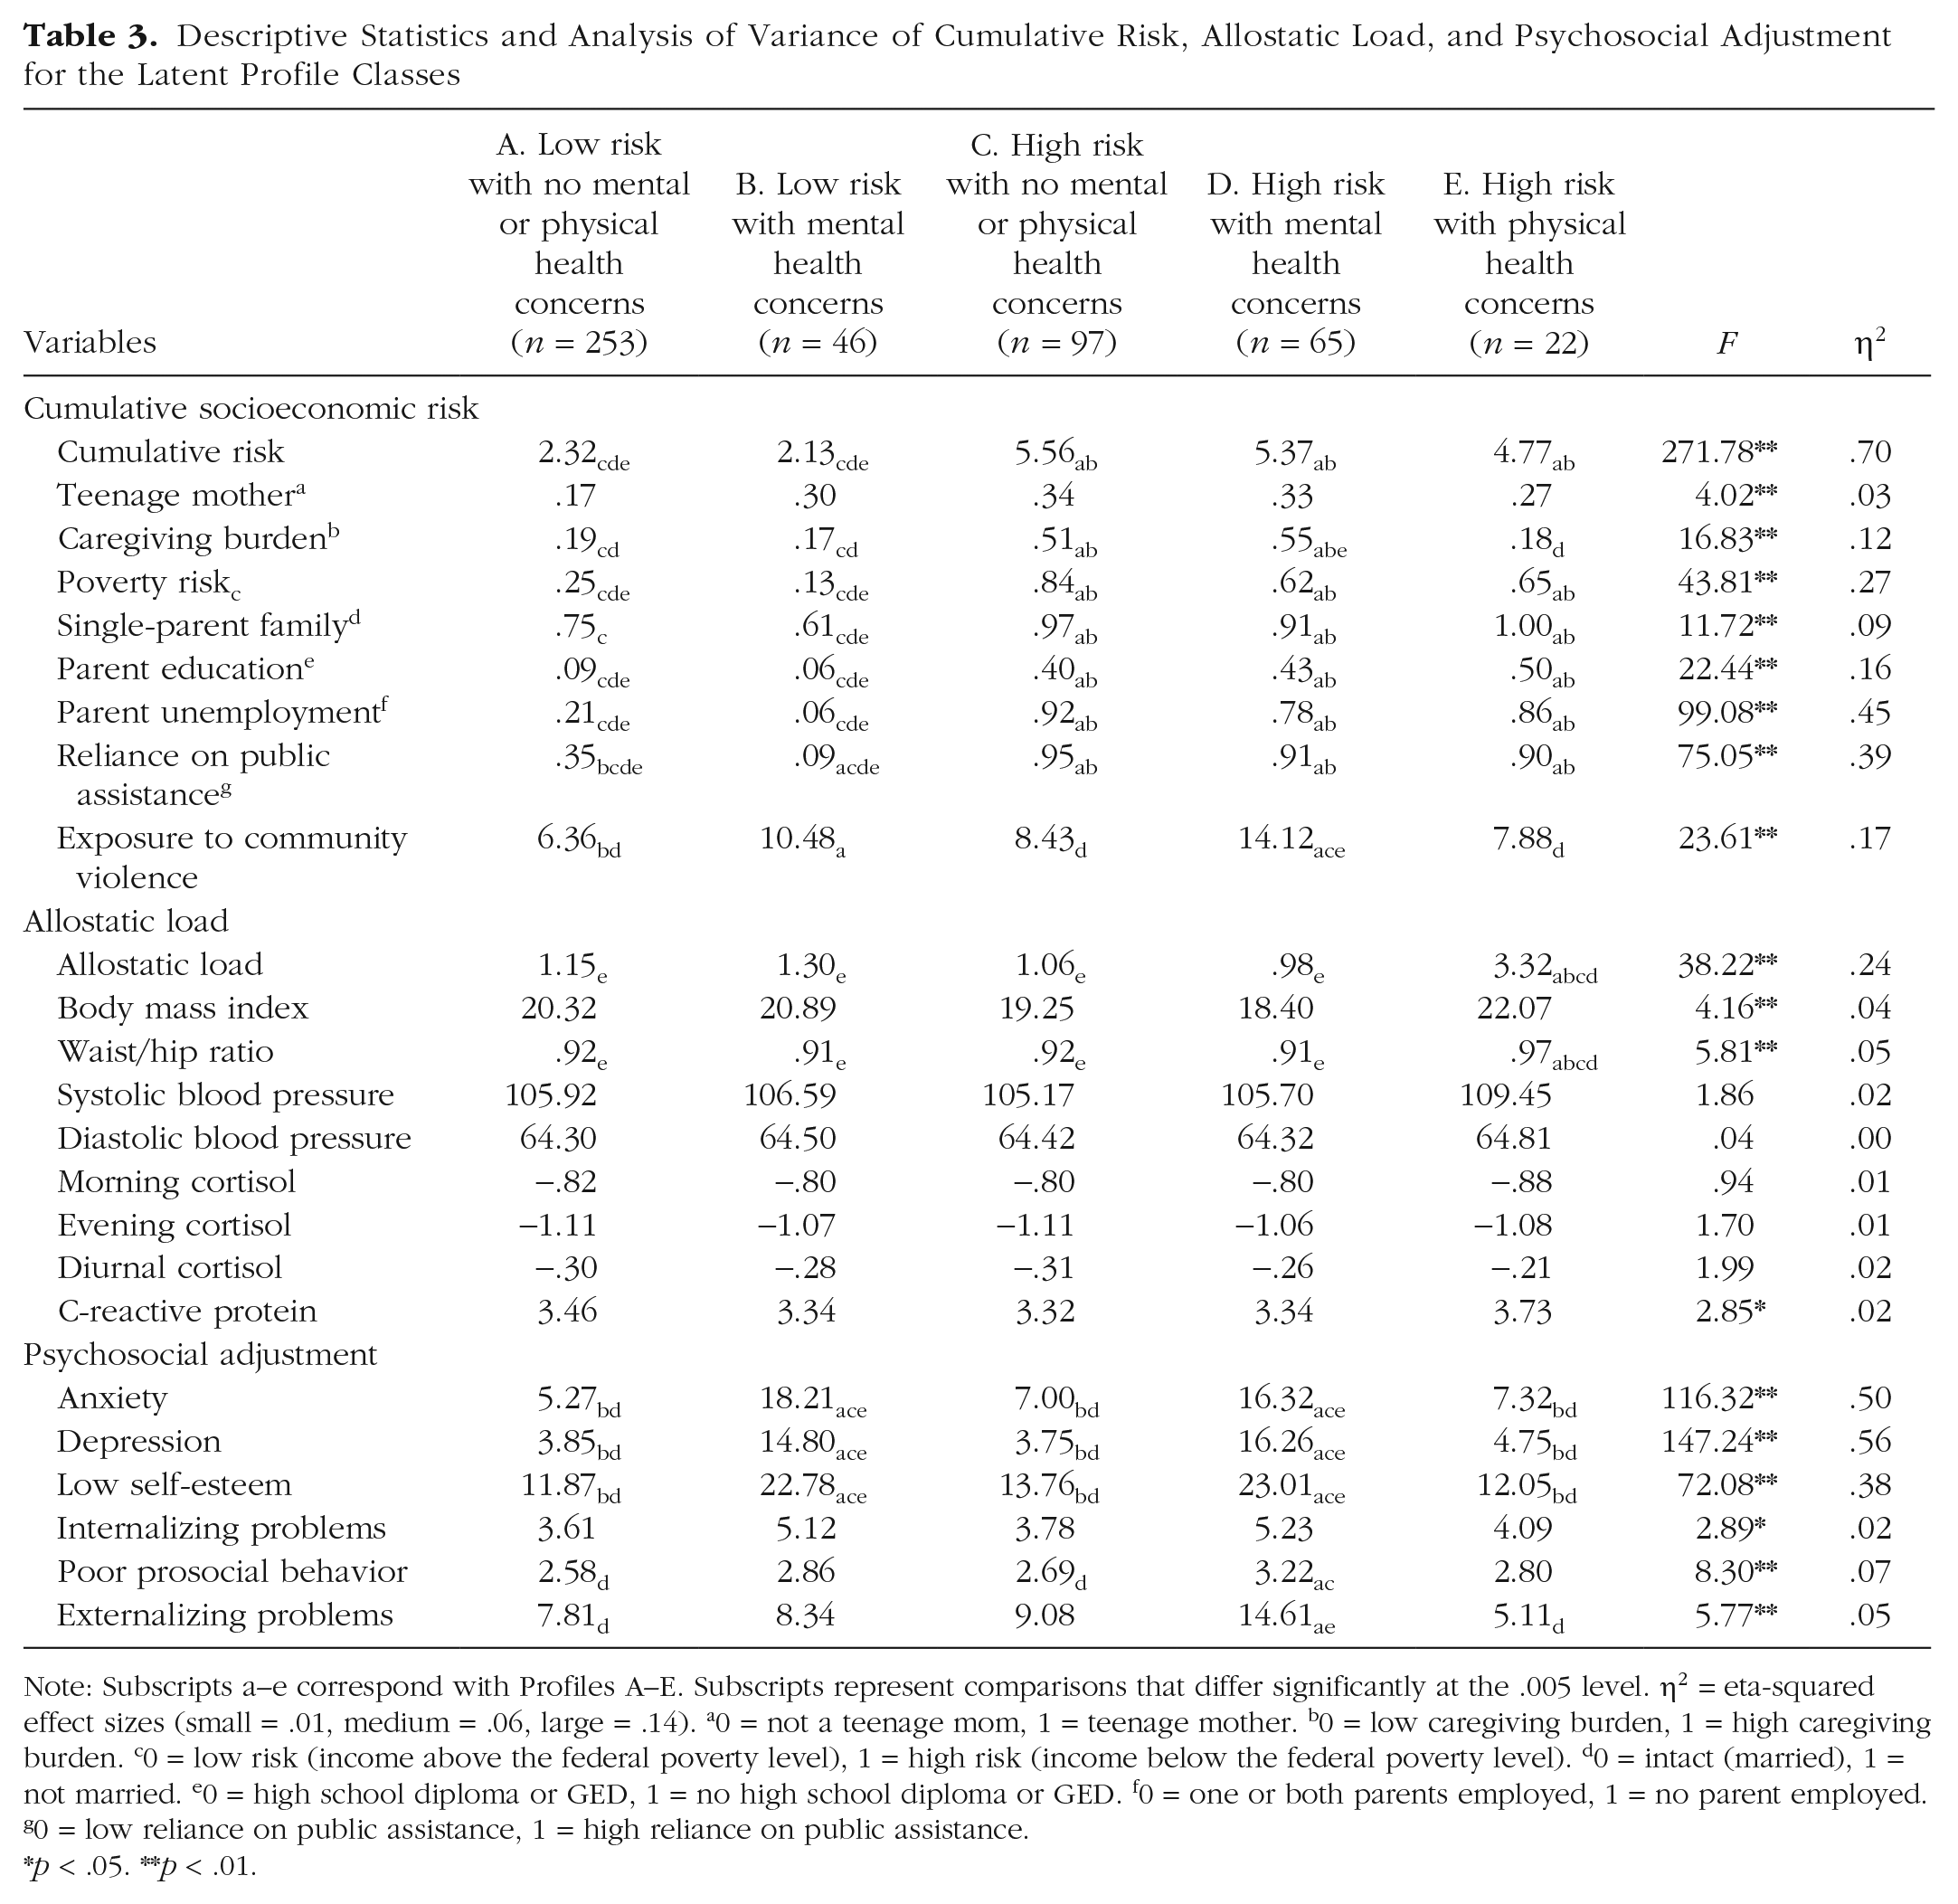
Note: Subscripts a–e correspond with Profiles A–E. Subscripts represent comparisons that differ significantly at the .005 level. η2 = eta-squared effect sizes (small = .01, medium = .06, large = .14). a0 = not a teenage mom, 1 = teenage mother. b0 = low caregiving burden, 1 = high caregiving burden. c0 = low risk (income above the federal poverty level), 1 = high risk (income below the federal poverty level). d0 = intact (married), 1 = not married. e0 = high school diploma or GED, 1 = no high school diploma or GED. f0 = one or both parents employed, 1 = no parent employed. g0 = low reliance on public assistance, 1 = high reliance on public assistance.*p < .05. **p < .01.
Sociodemographic characteristics
A series of χ analyses were computed for several demographic variables to determine whether there were differences in gender, race, and ethnicity across the latent profiles. There were no significant differences found for ethnicity, χ2(df = 4, N = 483) = 8.91, p =.06, ϕ = .14. However, there were significant differences found for gender, χ2(df = 4, N = 483) = 10.24, p = .04, ϕ = .15, and race, χ2(df = 4, N = 482) = 9.82, p = .04, ϕ = .14. Females were more likely to be in the low-risk with no mental or physical health concerns group, whereas males were more likely to be in the high-risk with mental health concerns group. Black children were less likely to be in the low-risk with mental health concerns profile compared with non-Black children. Finally, a one-way ANOVA for child’s age was significant, F(5, 478) = 2.45, p = .05, η2 = .02; however, post hoc analyses revealed no significant comparisons across the latent profiles.
Childhood maltreatment
Childhood maltreatment differed across profiles, F(5, 478) = 12.42, p <.001, η2 = .09. Youth in the high-risk with no mental or physical health concerns (M = 1.34, SD = 1.06) and high-risk with mental health concerns (M = 1.48, SD = 1.08) groups had higher exposure to childhood maltreatment compared with youth in the low-risk with no mental or physical health concerns (M = .72, SD = .92) and low-risk with mental health concerns (M = .76, SD = .95) profiles. Chi-square analyses with maltreatment subtypes confirmed these results. Specifically, with the exception of childhood sexual abuse, χ2(df = 4, N = 483) = 2.40, p = .66, ϕ = .07, youth who were exposed to childhood emotional abuse, χ2(df = 4, N = 483) = 26.52, p < .001, ϕ = .23, neglect, χ2(df = 4, N = 483) = 29.49, p <.001, ϕ = .25, and physical abuse, χ2(df = 4, N = 483) = 18.77, p <.001, ϕ = .20, were overrepresented in the high-risk with no mental or physical health concerns and high-risk with mental health concerns groups.
Emotion regulation and affect
One-way ANOVAs were used to evaluate latent class differences in youth’s emotion regulation and affect (see Table 4). There were significant differences found for lability/negativity, inappropriate affect, emotion regulation, positive affect, and negative affect. Follow-up post hoc analyses revealed that individuals in the high-risk with mental health concerns group exhibited higher levels of lability/negativity than individuals in the low-risk with no mental or physical health concerns and the high-risk with no mental or physical health concerns subgroups, ps < .001. Similarly, youth in the high-risk with mental health concerns group displayed higher levels of inappropriate affect than youth in the low-risk with no mental or physical health concerns groups, ps < .001. In addition, youth in the low-risk with no mental or physical health concerns and high-risk with no mental or physical health concerns profiles had higher emotion-regulation scores than youth in the high-risk with mental health concerns profile, ps < .05. Youth in the low-risk with no mental or physical health concerns, high-risk with no mental or physical health concerns, and high-risk with physical health concerns profiles exhibited higher levels of positive affect than youth in the high-risk with mental health concerns profile, ps < .005. Finally, youth in the low-risk with no mental or physical health concerns, high-risk with no mental or physical health concerns, and high-risk with physical health concerns profiles reported lower levels of negative affect compared with youth in the two mental health concerns subgroups (i.e., low and high risk), ps < .001.
Descriptive Statistics and Analysis of Variance of Emotion Regulation, Affect, and Personality Characteristics for the Latent Profile Classes
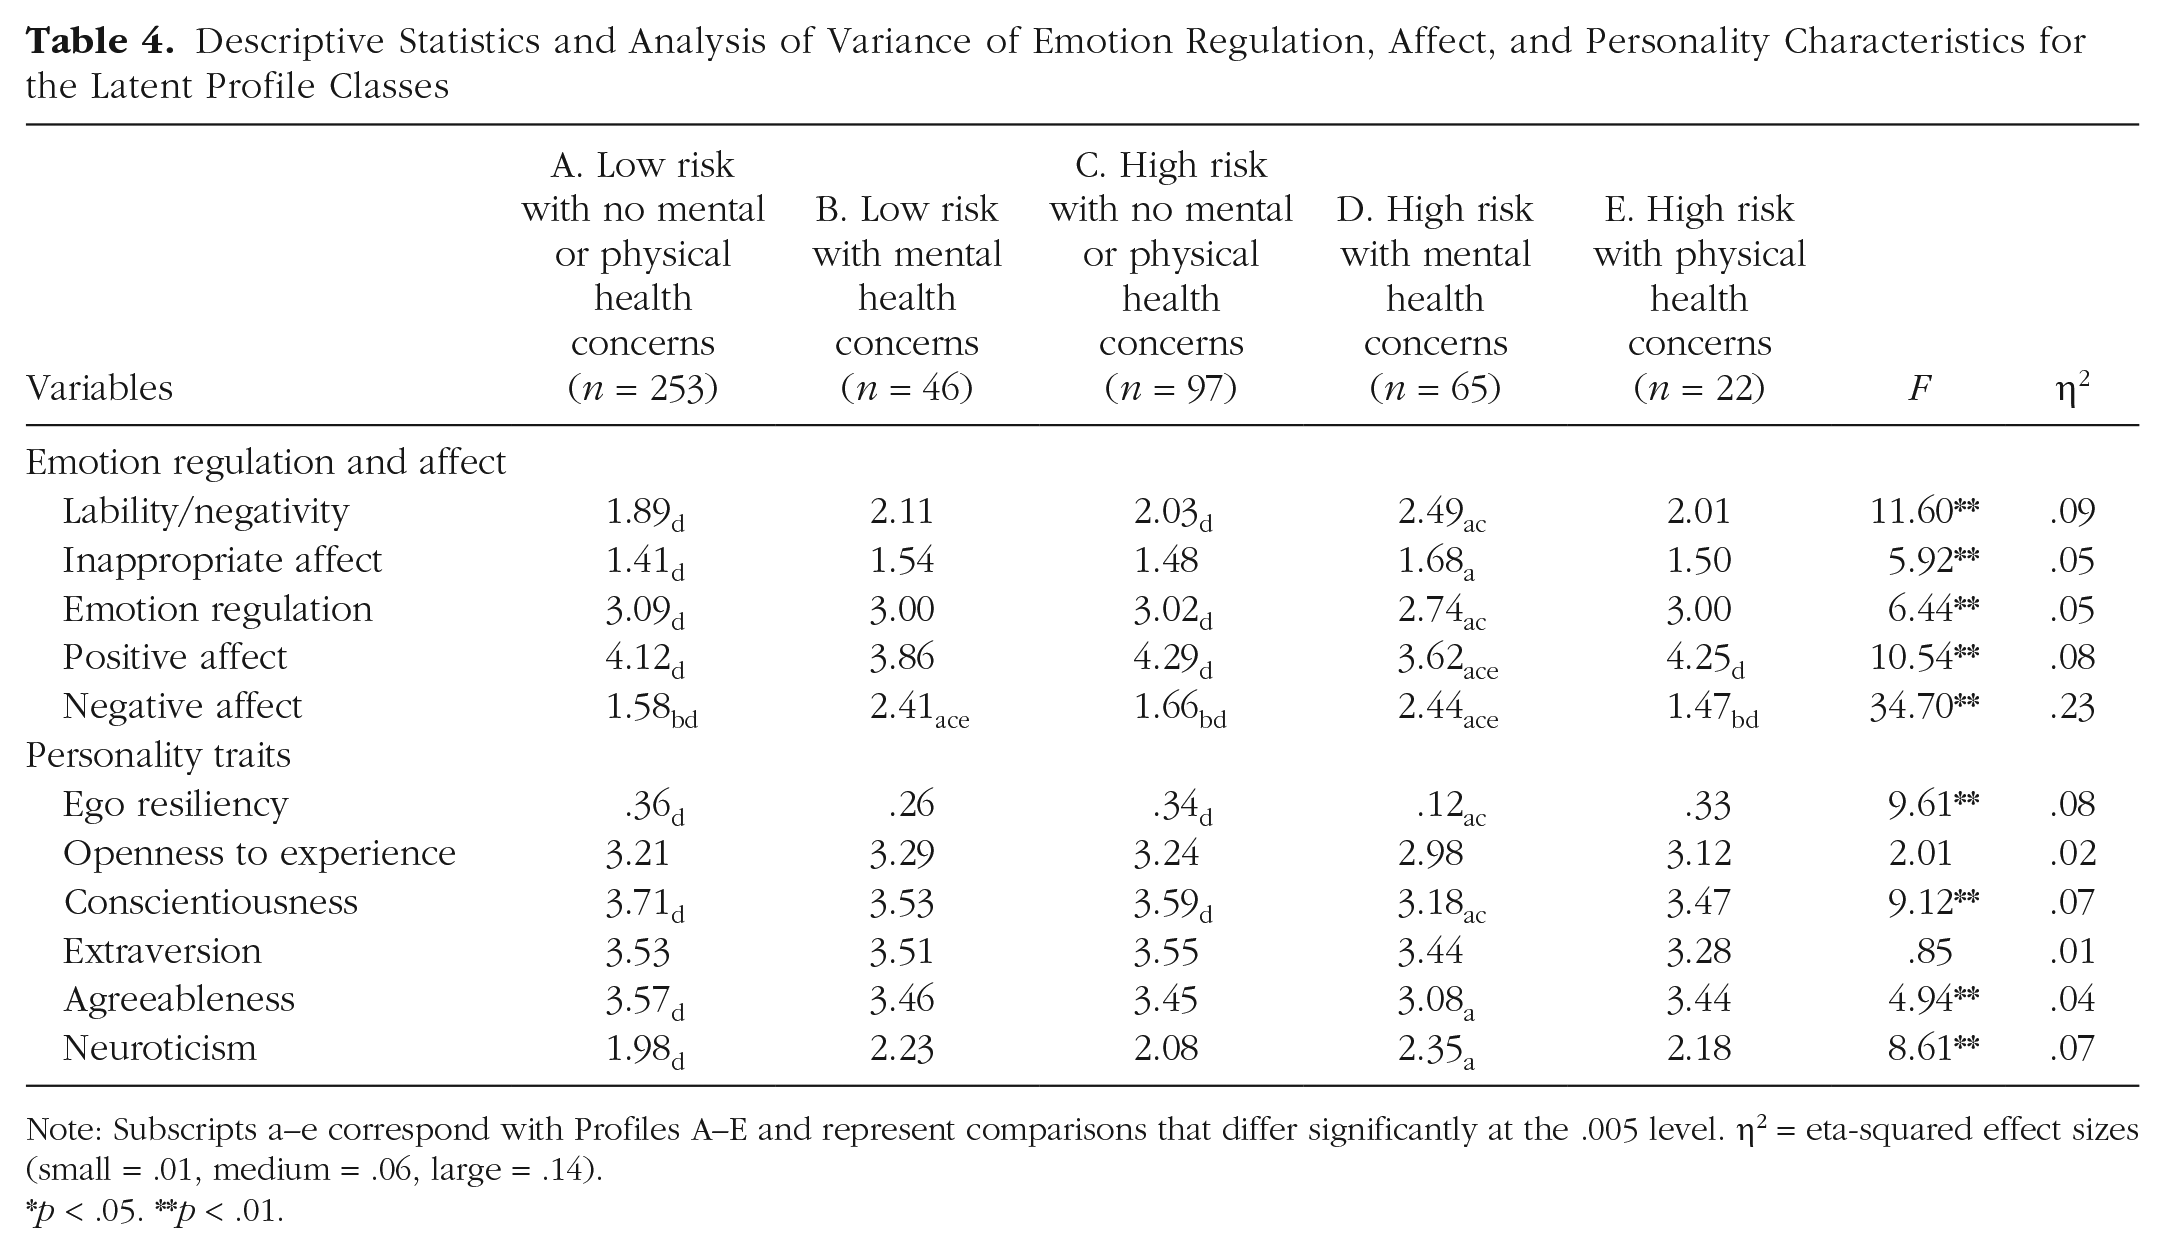
Note: Subscripts a–e correspond with Profiles A–E and represent comparisons that differ significantly at the .005 level. η2 = eta-squared effect sizes (small = .01, medium = .06, large = .14).*p < .05. **p < .01.
Personality characteristics
One-way ANOVAs evaluating latent class differences in youth’s personality revealed significant differences for ego resiliency, conscientiousness, agreeableness, and neuroticism. Youth in the low-risk with no mental or physical health concerns and high-risk with no mental or physical health concerns groups reported higher levels of ego resiliency and conscientiousness than youth in the high-risk with mental health concerns group, ps < .001. In addition, youth in the low-risk with no mental or physical health concerns profile reported higher levels of agreeableness and lower levels of neuroticism compared with youth in the high-risk with mental health concerns profile, ps < .001. Youth in the high-risk with no mental or physical health concerns group also had lower neuroticism scores than the high-risk with mental health concerns group, but the significance was slightly above the Bonferroni threshold, p = .006. There were no significant differences found for extraversion and openness to experience.
Discussion
Extending the work of Brody and colleagues (2013), this investigation evaluated patterns of cumulative SES risk, allostatic functioning, and mental health in a younger sample of low-income youth. Although several studies have examined the associations between SES, biomarkers of AL, and psychosocial well-being, no study to date has replicated Brody et al.’s (2013) findings in children at earlier periods of development. Moreover, there is limited research on the antecedents and correlates of profiles focused on SES risk, allostatic functioning, and mental health. Therefore, the current investigation examined how experiences of childhood maltreatment, emotion regulation, affect, and personality characteristics are associated with these profiles. Overall, findings were consistent with Brody et al.’s (2013) work, providing support for five different profiles of cumulative SES risk, allostatic load, and mental health. However, a sixth profile that fit a small number of children did emerge in our data. These six profiles showed significant differences in childhood maltreatment, emotion regulation, affect, and personality.
Profiles of cumulative SES risk, AL, and mental health
LPAs evaluated whether patterns of cumulative SES risk, allostatic functioning, and mental health would emerge in a sample of low-income youth. We predicted that all five profiles (i.e., low risk with no mental or physical health concerns, resilient, high risk with physical health concerns, high risk with mental health concerns, and high risk with both mental and physical health concerns) would emerge in the data, consistent with Brody, Yu, Chen, Kogan, et al. (2013). We also speculated that patterns indicative of poor mental and physical health (i.e., high risk with physical health concerns, high risk with mental and physical health concerns) would be less common given the participants’ developmental age. Findings supported this hypothesis. However, in addition to the five previous patterns found in Brody’s work, we identified a sixth pattern characterized by low cumulative SES risk, low AL, and high mental health problems (i.e., low risk with mental health concerns). As expected, the low-risk with no mental or physical health concerns group (i.e., low cumulative SES risk, low AL, and low mental health problems) represented a substantial portion (51%) of the youth in this sample. Resilient youth who were exposed to high cumulative SES risk yet displayed lower AL and mental health problems accounted for 20% of the sample. In addition to the low-risk with mental health concerns profile, a profile characterized by low AL, high mental health problems, but high cumulative SES risk was observed in 13% of the youth (i.e., high risk with mental health concerns). A fifth profile characterized by high cumulative SES risk, more positive mental health (low mental health symptoms), and high AL was found in a small subset (4.5%) of youth. This pattern was classified as the high-risk with physical health concerns group and is consistent with the John Henryism theory (James, 1994) that juxtaposes the physical cost of striving (or achieving) success in the face of chronic adversity. Finally, eight youths (1.6%) displayed a high-risk pattern evident by high cumulative SES risk, high AL, and high mental health problems. Overall, these findings are consistent with resilience theory purporting variations in the developmental outcomes of youth who are exposed to similar high-risk contexts (Masten et al., 2021).
Antecedents and correlates of cumulative SES risk, AL, and mental health
The second aim of this study was to determine how experiences of childhood maltreatment, emotion regulation, affect, and personality differ across profiles. Findings partially supported the study’s hypotheses. Notably, children who were exposed to higher levels of childhood maltreatment were more likely to be overrepresented in two profiles: resilient and high risk with mental health concerns. However, childhood maltreatment was not associated with profiles having physical health concerns. These findings are consistent with prior work on child maltreatment (Cicchetti et al., 2015; Rogosch et al., 2011) suggesting that although maltreatment may lead to negative mental health outcomes in young children, the effects of these adverse experiences on physical indicators of health might not become apparent until later stages of development and may be moderated by socioemotional competence. Furthermore, there is evidence to suggest that although a direct association between child maltreatment and AL may not be pronounced at earlier stages of development, the additive effect of AL with maltreatment can lead to deleterious mental health outcomes in childhood (Rogosch et al., 2011).
Consistent with the study’s hypotheses, there were significant differences in emotion regulation and affect across groups. Specifically, youth in the low-risk with no mental or physical health concerns and resilient groups experienced higher levels of emotion regulation and positive affect and lower levels of lability/negativity, inappropriate affect, and negative affect compared with youth in the high-risk with mental health concerns group. These findings add to the extensive literature indicating that effective emotion regulation and expression are associated with better health and psychosocial outcomes (Brody, Yu, Chen, Miller, et al., 2013; Chen et al., 2012). In contrast, there were minimal differences found in emotion regulation and affect among youth in the low-risk with no mental health concerns, resilient, and high-risk with physical health concerns groups. However, it is important to note that across all indicators of positive adaptation, the high-risk with physical health concerns group (i.e., the John Henryrism profile) had lower mean scores on negative affect compared with the other groups, suggesting that the suppression of negative emotions among these youth may set the stage for vulnerability to poor physiological dysregulation and physical health.
Research has shown that the suppression of negative emotions in high-risk populations may lead to poor physical health and psychological adjustment (Dunbar et al., 2022). For example, in a recent study with Black and multiracial children, Dunbar et al. (2022) found that the suppression of negative emotions in young children contributes to increases in internalizing and externalizing symptoms among children who are biologically sensitive to their environment (e.g., have higher baseline respiratory sinus arrhythmia). Findings from the current study suggest that the John Henryism profile characterized by physical health concerns may be attributed to the suppression of negative emotions in the context of chronic psychosocial stress. It appears that some children from low-SES backgrounds may learn to suppress their negative emotions at an earlier age (i.e., persisting in the face of chronic stressors), which then set them on a pathway to this John Henryism profile. Moreover, the findings from this study suggest that although the John Henryism profile may not be as salient in this age group, there are signs that these patterns of physical vulnerability are emerging in some children and may become more evident later in development among youth in other profiles (i.e., low risk with no mental health concerns, resilient).
Higher levels of ego resiliency and conscientiousness differentiate the low-risk with no mental or physical health concerns and resilient groups from the high-risk with mental health concerns group. The low-risk with no mental or physical health concerns and resilient groups also reported higher levels of agreeableness and lower levels of neuroticism compared with the mental and physical health concerns group. These findings partially supported our hypotheses that profiles with good mental and physical health would be associated with higher levels of ego resiliency and conscientiousness. The findings are consistent with empirical evidence suggesting that higher levels of ego resiliency and conscientiousness are associated with better developmental outcomes (Chen et al., 2020), but they contradict previous work showing that Black youth from disadvantaged backgrounds with higher levels of conscientious are more susceptible to poor physical health outcomes (e.g., upper respiratory infections; Miller et al., 2016). We found no empirical support for openness to experience, contrary to our hypothesis. However, the low-risk and no mental or physical health concerns profile had higher levels of agreeableness and lower levels of neuroticism, which has been noted in previous work (Stephan et al., 2016).
Limitations and future directions
This investigation utilized a multimethod, multi-informant cross-sectional study of a large and diverse sample of low-income youth to identify profiles of SES risk, allostatic functioning, and mental health. In addition to these strengths, this study is one of the first to examine how childhood maltreatment, emotion regulation, affect, and personality are associated with distinct profiles based on these indicators of risk and adaptive function. Notwithstanding the unique contribution of this study, findings should be interpreted in the context of several limitations.
First, the entropy for the final confirmatory LPA model was below .80. Although the entropy index is an assessment of the quality of classes and not model fit, scholars have recommended values that are .80 and higher (Muthén, 2008). However, it is important to note that the 3 × 3 confirmatory LPA supported by the initial LPA models had an entropy of .80, but the classes were too small for meaningful interpretation.
Second, the composition of the sample may have affected the results. Compared with the families from Brody et al. (2013), the families in our sample experienced higher rates of poverty, with all participating families receiving TANF as a major source of income, and at least 82% of the youth in this sample lived in a single-parent household. Brody et al.’s sample also comprised African American youth living in rural communities in the southern United States, whereas the current sample consisted of a group of ethnically and racially diverse young children living in urban communities in the Northeast. There was some evidence to support differences in profiles as a function of race. Specifically, non-Black youth were overrepresented in the low-risk with mental health concerns group compared with Black children. This finding is consistent with research on low-risk children from affluent backgrounds, in which prolonged isolation from parents, achievement, and family pressures have been shown to exacerbate mental health problems (Luthar & Latendresse, 2005).
In addition, differences in measurement could have affected the results. For example, we were able to identify an additional sixth profile that was defined by low-SES risk and mental health problems. This distinct profile was not found in Brody et al. (2013), which could reflect the number as well as the type of measures that were used to assess psychosocial adjustment. Although Brody et al.’s analyses examined substance use and delinquent behavior as indicators of psychosocial adjustment, we used other age-appropriate measures such as prosocial competence, self-esteem, and anxiety to assess mental health outcomes in younger children.
The current sample also differed from previous work given the inclusion of children who experienced childhood maltreatment. Brody et al. (2013) did not assess youth’s exposure to childhood maltreatment. However, half the children in our sample were identified by official records as maltreated given the prevalence of childhood maltreatment among low-income families that seek social services. Finally, all data on cumulative SES risk, AL, and mental health were collected at one time point, whereas the data by Brody and colleagues were collected at multiple time points spanning several years. As a result, the timing of the assessment, in particular the time (i.e., age 19 vs. ages 8–12) at which the biomarkers of AL were collected, could have affected the size and distribution of each profile. Perhaps the new profile that emerged (Profile B, i.e., low-SES risk with mental health problems) in our cross-sectional data would disappear if these processes were studied longitudinally, paving the way for other emergent profiles such as Profiles E (high risk with physical health problems) and F (high risk with mental and physical health problems) to become more salient.
Third, although we dichotomized some of the study variables to be consistent with prior research, the dichotomization of scaled measures (e.g., community-violence index) could lead to lower variability in scores, reduced effect sizes, and loss of measurement reliability (MacCallum et al., 2002). Therefore, future research is needed to validate strategies of dichotomization as well as to replicate these analyses with continuous measures. In particular, research on AL has been inconsistent with the measurement and operationalizations of this construct. These inconsistencies could lead to divergent outcomes that may affect the generalizability or interpretability of research findings. Therefore, future research should consider following uniform, national guidelines to make decisions about dichotomization and use more reliable measures of AL indicators (i.e., using dual-energy X-ray absorptiometry to measure adiposity as opposed to BMI). In addition, the community-violence measure was based on caregiver’s self-reported experiences. Although self-reported measures of stressful experiences have predictive validity and clinical utility (McAdams & de St. Aubin, 1992), empirical evidence suggests that they are fallible and should be used in combination with other objective measures (e.g., interviewers’ assessment and/or administrative data; Harkness & Monroe, 2016).
Fourth, there was little variation in emotion regulation, affect, and personality among the low-risk, resilient, and physical health concerns groups. These findings suggest that other factors may be important in explaining differences among these profiles. For example, future research should investigate whether sleep quality, supportive relationships with parents, and peers and other contextual factors could contribute to these differences. Moreover, given that recent work has shown that a combination of strategies (Chen et al., 2012; Dich et al., 2015; Doan et al., 2016) as opposed to individual ones are better at distinguishing different profiles of physiological dysregulation, future work should focus on how the interrelations between specific processes such as emotion regulation and negative affect can influence distinct profiles of mental and physical health outcomes.
Implications and conclusions
The current study advances our understanding about the antecedents and progression of mental and physiological health in children at early periods of development. Although patterns of poor mental and physiological health were not as pronounced as those in adulthood, this study suggests that there may be early signs of profiles associated with later mental and physiological-health problems. Given that only a small subset of these children currently displayed patterns of poor mental and physiological health, this period of development may provide a window of opportunity for intervention efforts to mitigate risk and promote health. As evidenced in the higher rates of COVID deaths and diagnoses in low-income and disadvantaged communities (Raifman & Raifman, 2020), it would be important for intervention efforts to focus not only on the individual and family unit but also on policy and programs aimed at improving health outcomes in these communities at both the local and national levels. Notably, intervention programs focused on individual coping and family dynamics such as EMBRace, Bridges to High School, Strong African American Families program, and the Multidimensional Treatment Foster Care program could be implemented at a much broader scale to help historically marginalized groups navigate stressors that affect their mental and physical health. Finally, future research should also determine whether resources and support centered on the utilization of effective coping and emotion-regulation strategies may lead to better psychosocial and physiological health outcomes in low-income children and their families.
Supplemental Material
sj-docx-1-cpx-10.1177_21677026231183012 – Supplemental material for Profiles of Risk, Allostatic Load, and Mental Health in Low-Income Children
Supplemental material, sj-docx-1-cpx-10.1177_21677026231183012 for Profiles of Risk, Allostatic Load, and Mental Health in Low-Income Children by Fanita A. Tyrell, Fred A. Rogosch and Dante Cicchetti in Clinical Psychological Science
Footnotes
Acknowledgements
We are grateful to all the families that participated in this study. F. A. Tyrell and D. Cicchetti also express their deep appreciation for the contributions of F. A. Rogosch to this study prior to his untimely death.
Transparency
Action Editor: Jennifer L. Tackett
Editor: Jennifer L. Tackett
Author Contribution(s)
F.A. Tyrell played a primary role in conceptualization, formal analysis, investigation, methodology, writing- original draft, and writing-review and editing. F.A. Rogosch and D. Cicchetti were responsible for funding acquisition, project administration, supervision, data curation, and played a secondary role in conceptualization, investigation, and writing-review and editing. All of the authors approved the final manuscript for submission.
Correction (April 2024):
The second and third sentences under the “Resilience Framework” section have been revised for clarity.
References
Supplementary Material
Please find the following supplemental material available below.
For Open Access articles published under a Creative Commons License, all supplemental material carries the same license as the article it is associated with.
For non-Open Access articles published, all supplemental material carries a non-exclusive license, and permission requests for re-use of supplemental material or any part of supplemental material shall be sent directly to the copyright owner as specified in the copyright notice associated with the article.