
Abstract
Drawing on dynamical systems theory, we investigated whether within-persons-detected early-warning signals in momentary affect preceded critical transitions toward lower levels of depressive symptoms during therapy. Participants were 41 depressed individuals who were starting psychological treatment. Positive and negative affect (high and low arousal) were measured 5 times a day using ecological momentary assessments over 4 months (M = 522 observations per individual). Depressive symptoms were assessed weekly over 6 months. Within-persons rising autocorrelation was found for 89% of individuals with transitions in at least one variable (vs. 62.5% for individuals without transitions) and in a consistently higher proportion of the separate variables (~44% across affect measures) than for individuals without transitions (~27%). Rising variance was found for few individuals, both preceding transitions (~11%) and for individuals without transitions (~12%). Part of our sample showed critical slowing down, but early-warning signals may have limited value as a personalized prediction method.
Keywords
Researchers have started drawing on dynamical systems theory for methods to improve their understanding of the processes of change in psychopathology (Cramer et al., 2016; Gelo & Salvatore, 2016; Hayes & Andrews, 2020). In part, this renewed interest in dynamical systems is due to the rise in studies revealing that changes in psychopathology are often nonlinear (Delignières et al., 2004; Fisher et al., 2011; Hamaker & Wichers, 2017; Hayes et al., 2007; Helmich et al., 2020; Hosenfeld et al., 2015; Molenaar & Campbell, 2009). In the dynamical systems framework, people are viewed as complex systems of interacting components (e.g., behaviors, cognitions, and emotions) in which the dynamics of those components can be studied to anticipate impending changes (Boker et al., 2016; Fried & Robinaugh, 2020; Jeronimus, 2019). Particularly, the phenomenon of “critical slowing down” may lead to early-warning signals in the temporal dynamics of the system variables before a critical transition from one dynamically stable state to another (e.g., from a depressed to nondepressed state). When a system critically slows, it destabilizes and gradually becomes less resilient to external shocks (e.g., daily events), which results in more extreme fluctuations (rising variance) and a longer delay in returning to the equilibrium position (rising autocorrelation). Early-warning signals have been described as generic indicators that a system may be losing resilience and nearing a tipping point where the likelihood of a critical transition is higher (Dakos et al., 2014; Scheffer, 2009; Scheffer et al., 2012; Zeeman, 1976). Early-warning signals are generic in the sense that they are expected to occur in a wide range of complex dynamical systems (Drake & Griffen, 2010; Scheffer et al., 2012) and are beginning to be explored in the field of psychiatry (Bos et al., 2022; Dablander et al., 2022; Gijzel et al., 2020; Helmich, Olthof, et al., 2021; Kunkels et al., 2021; Olthof, Hasselman, Strunk, van Rooij, et al., 2020; Schreuder et al., 2020, 2022, in press; Smit et al., 2022; van de Leemput et al., 2014; Wichers et al., 2016, 2020).
An important reason that early-warning signals have attracted such attention from psychopathology researchers is the promise that they may serve as a clinical tool to detect symptom shifts ahead of time. Descriptively, they fit with clinical observations: The process of change during psychotherapy is frequently characterized by destabilization and nonlinear patterns (Hayes et al., 2015; Hayes & Strauss, 1998; Heinzel et al., 2014; Olthof, Hasselman, Strunk, Aas, et al., 2020; Schiepek et al., 2016; Strunk & Lichtwarck-Aschoff, 2019), such as symptom shifts between therapy sessions known as sudden gains and sudden losses (Aderka et al., 2012; Helmich et al., 2020; Lutz et al., 2013; Olthof, Hasselman, Strunk, van Rooij, et al., 2020; Shalom & Aderka, 2020; Tang & DeRubeis, 1999), or rapid early response curves over the first few weeks of treatment (Husen et al., 2016; Kelley et al., 2018; Nordberg et al., 2014; Stulz et al., 2007; Vittengl et al., 2016). These nonlinear patterns are often linked to better outcomes (e.g., Haas et al., 2002; Heinzel et al., 2014; Helmich et al., 2020; Olthof, Hasselman, Strunk, Aas, et al., 2020; Shalom & Aderka, 2020; Stulz et al., 2007; Vittengl et al., 2016), so using early-warning signals to improve early detection of destabilization and potential shifts could provide therapists with clues about their patients’ response potential and allow them to personalize the treatment and timing of interventions accordingly. In fact, based on the synergetics view of psychotherapy, the therapeutic alliance and the safe environment created in the context of therapy may serve as boundary conditions for instability to occur that is more likely to result in positive changes (Schiepek, 2009; Schiepek et al., 2014). Thus, examining the promise of early-warning signals is clinically important, as it may give patient and therapist valuable insight into whether the system is destabilizing and therefore more sensitive to therapeutic input, and significant improvement could be imminent (Hayes & Andrews, 2020; Schiepek et al., 2017; Strunk & Lichtwarck-Aschoff, 2019; Wright & Woods, 2020).
Moreover, studying the occurrence of early-warning signals during therapy is theoretically relevant, as it takes the next step from describing the process of symptom remission from a complex systems angle to actually testing whether dynamical systems phenomena such as critical slowing down apply to transitions in psychological systems (Bos & De Jonge, 2014). Early-warning-signals-like dynamics have shown promise in anticipating shifts in depressive symptoms in a few (group-level) studies (Curtiss et al., 2021; Gijzel et al., 2017, 2020; Kuranova et al., 2020; Olthof, Hasselman, Strunk, Aas, et al., 2020; Schiepek, 2009; Schreuder et al., 2020; van de Leemput et al., 2014), which correlated individuals’ average autocorrelation or variance in mental states to their average symptom severity. However, to truly test the idea that early-warning signals precede symptom transitions in psychopathology, it is imperative to investigate within-persons rises in autocorrelation or variance prior to transitions (Bos & De Jonge, 2014). To that end, Wichers et al. (2016) first showed that early-warning signals could be used as a personalized predictor of depressive relapse in a single patient, a result they recently replicated in another patient (Wichers et al., 2020). In the context of therapy, Olthof, Hasselman, Strunk, van Rooij, et al. (2020) identified transitions in time series of daily self-ratings of problem intensity for a large sample of mood-disorder patients during treatment. They found that early-warning signals in the form of increased dynamic complexity predicted an increased probability of having a transition in symptom severity in the next 4 days. These results are very promising because they show that individually calculated destabilization and within-persons-defined transitions were positively associated. However, the study by Olthof, Hasselman, Strunk, van Rooij, et al. (2020) used a multilevel model, which means this association holds for the average estimated effect of destabilization on the likelihood of having a transition, but their findings do not translate to individualized predictions of imminent change. For that, one needs to test whether a significant within-persons rise precedes a transition for each individual separately. Therefore, in this study, we aimed to take this next step forward and test whether transitions toward lower levels of depressive symptoms are consistently preceded by within-persons rises in early-warning signals.
Theoretically, we would expect early-warning signals to occur in variables that are central to the system under consideration. A state of depression can be said to be composed of a persistent collection of individual depressive symptoms (e.g., anhedonia, sad mood, lack of energy), which in turn are expressed in shorter-lived feelings (Wichers, 2014; Wichers et al., 2015). In the current study, we therefore looked for early-warning signals in the smallest building blocks that contribute to the overall course of a depressive disorder (Eronen, 2021; Riese & Wichers, 2021; Wichers, 2014; Wichers et al., 2015): the moment-to-moment fluctuations in affect measured by ecological momentary assessments (EMAs). Notably, the presence and strength of early-warning signals may differ between variables (Boerlijst et al., 2013; Dakos, 2018; Lever et al., 2020; Patterson et al., 2021). Therefore, an important secondary goal in the investigation of early-warning signals in the context of psychiatry is to examine which affective states most reliably anticipate transitions toward reduced symptoms of depression.
Gathering appropriate data is challenging, and only two single-subject studies of early-warning signals prior to depressive relapse have been published (Wichers et al., 2016, 2020). To be able to capture and calculate early-warning signals in affect observations before shifts in depressive symptoms, we need frequent momentary assessments over a period in which clinical change is likely. High-resolution time-series data (Cabrieto et al., 2018; Dablander et al., 2022; Dakos, Carpenter, et al., 2012; Liu et al., 2015) that capture moment-to-moment variations at a time scale that is short enough to cover the full range of fluctuations in the state of the system (Hamaker et al., 2015; Haslbeck & Ryan, 2022; Jeronimus, 2019; Kuppens et al., 2010; van Der Bolt et al., 2021), and over a long-enough period to capture the entire state change, is required to detect change in the system dynamics. Therefore, we collected intensive longitudinal data from 41 individuals who were starting treatment for depressive complaints as they entered the study and were thus likely to show symptom improvement. For 4 months, participants completed EMA affect observations 5 times daily to be able to detect early-warning signals, and we collected 6 months of weekly depressive-symptom assessments for the identification of symptom shifts. Because early-warning signals are studied within systems (i.e., within each individual), these 41 individuals each represent a single-subject study and replicated test of our hypothesis.
The current study was uniquely designed to test whether critical-slowing-down-based early-warning signals consistently occur prior to transitions toward depressive-symptom improvement and is the first to test this hypothesis empirically at the within-persons level for multiple individuals. We aimed to establish whether destabilization in the form of early-warning signals such as increasing trends in Lag 1 autocorrelation and variance can be detected in momentary-measured affect before transitions toward improvement in depressive symptoms. We hypothesized that early-warning signals would be most prevalent in variables congruent with the direction of the transition, that is, positive affect variables would be most likely to show changing dynamics leading up to a clinical improvement (van de Leemput et al., 2014; Wichers et al., 2016, 2019, 2020). To provide the clearest picture of how well early-warning signals work as personalized indicators of imminent change, we also examined the rates of early-warning signals in individuals without transitions. We hypothesized that individuals with clear symptom shifts would have relatively more and stronger early-warning signals than individuals without transitions.
Method
Sample description
Individuals with current depressive symptoms who were about to start psychological treatment were recruited for this study. This population was chosen with the expectation that these patients would be likely to show symptom improvements during the study period. To be eligible for participation, individuals needed to be 18 years or older, have current depressive symptoms (a score ≥ 14 on the Inventory of Depressive Symptomatology Self Report; Rush et al., 2000), and be bound for psychological treatment for depression within 1 month of the (intended) participation start date. Participants also needed to be capable of following the study procedures and operating a smartphone, have sufficient command of the Dutch language, and be willing and able to give informed consent. Exclusion criteria were chronicity of depressive complaints (persistence ≥ 2 years), current manic or psychotic symptoms, and a primary diagnosis for personality disorder. Written informed consent was obtained from all participants.
All procedures were approved on December 12, 2016, by the Medical Ethical Committee of the University Medical Center Groningen (Registration No. NL58848.04.16). Detailed procedures for this research project are described by Helmich, Snippe, et al. (2021). We report how we determined our sample size, all data exclusions, all manipulations, and all measures in the study. The data sets analyzed in the current study are not publicly available because of the sensitive nature of the data (a small sample of patient data with many observations within patients that cannot be fully anonymized) but are available from the corresponding author on reasonable request.
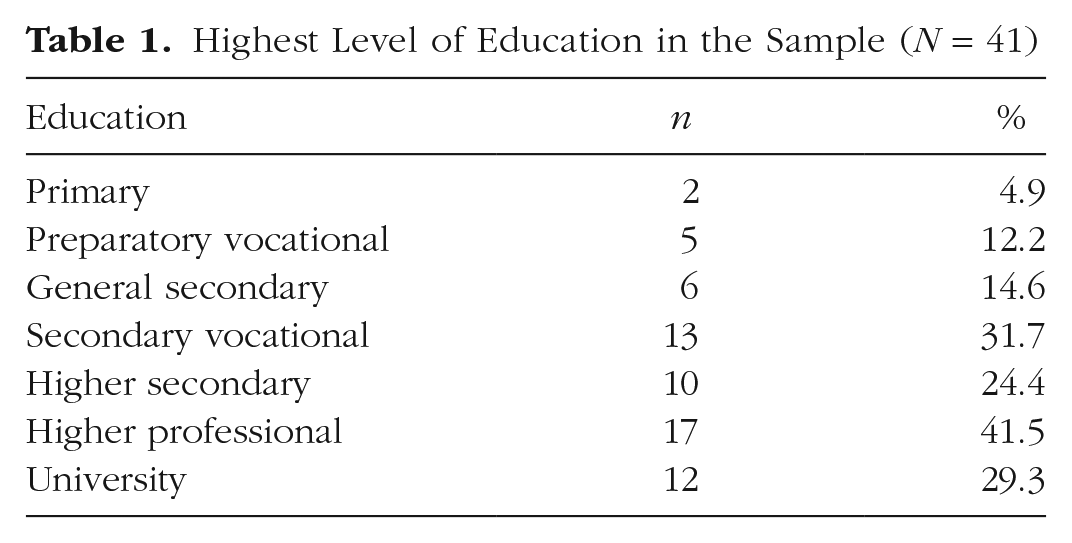
Data collection took place between June 2017 and May 2020. The intended sample size was 45 to 50 participants to arrive at a sufficient number of patients with a depressive-symptom transition who could serve as replications of one another. The final sample consisted of 41 participants who completed the 6-month study period (for an overview, see Fig. 1). The participants were mostly female (n = 35, 85%) and had a mean age of 40.1 years (SD = 14.4, minimum = 19, maximum = 70) at the time of starting the study. Participants’ highest level of completed education is reported in Table 1. We did not collect data on the ethnic and cultural backgrounds of our participants and thus cannot be sure that our sample is representative of demographic groups in The Netherlands.
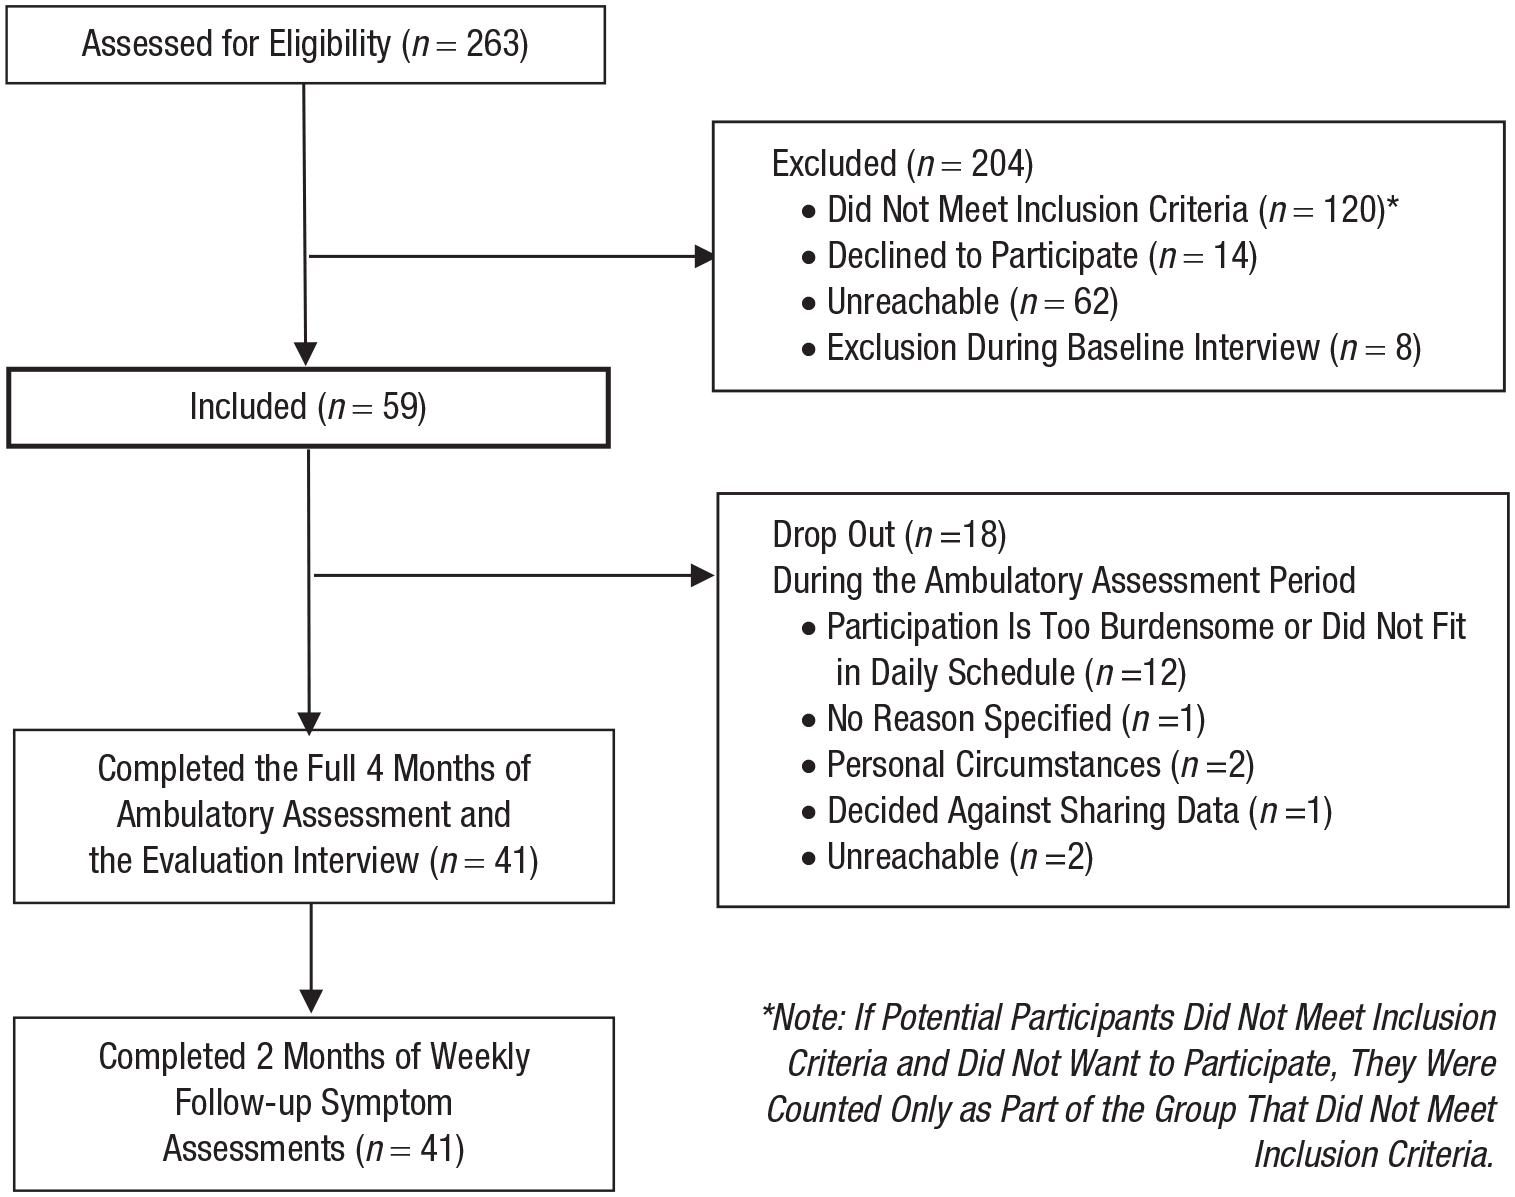
Flowchart of the Transitions in Depression (TRANS-ID) Recovery participant inclusion steps.
Highest Level of Education in the Sample (N = 41)
Materials
EMA: momentary mood
Over a period of 4 months, participants filled in a 27-item EMA questionnaire (available online, see https://osf.io/a8572/) 5 times a day about their current feelings, activities, and surroundings at set times, with fixed intervals of 3 hr. Affect was measured with items such as “I feel cheerful,” and “I feel down,” which were answered on a visual analogue scale ranging from not at all to very much (the underlying scale ranged from 0 to 100).
With a compliance of 85%, this resulted in a mean of 522 (SD = 42, minimum = 423, maximum = 591) momentary mood measurements per individual, on which the early-warning signals could be calculated (25,197 EMA observations in total). To that end, individual items were standardized, person-mean centered, and averaged to create four variables based on the affect circumplex (Posner et al., 2005; Yik et al., 1999): positive affect high arousal (“cheerful,” “energetic”), positive affect low arousal (“content,” “at ease”), negative affect high arousal (“restless,” “stressed,” “irritated”), and negative affect low arousal (“down,” “listless,” “tired”). A post hoc confirmatory factor analysis showed adequate fit of the chosen factor structure (see Section 3 and Table S4 in the Supplemental Material available online).
Depressive symptoms
Depressive symptoms were measured weekly with 14 items of the Symptom Checklist-90 (SCL-90) Depression subscale (Arrindell & Ettema, 1981, 2003; Derogatis, 1977). Every weekend, over a period of 6 months, participants were asked to rate how much in the past week they were bothered by depressive symptoms on a 5-point scale from not at all to extremely. With a compliance of 98%, this gave a mean of 29 symptom observations per person (SD = 1.4, minimum = 23, maximum = 30) and 1,211 assessments in total. The full 16-item (Dutch) subscale has shown high internal consistency (α = .91) and reliability (ω k = .93), as well as a strong relationship to the general factor psychological distress (Arrindell & Ettema, 2003; Smits et al., 2015). For this study, two questions on self-esteem and suicidal ideation were removed from the questionnaire to reduce mental burden for participants. 1 The repeated measurements of the SCL-90 Depression subscale were used to identify depressive-symptom transitions (see below).
Psychological treatment
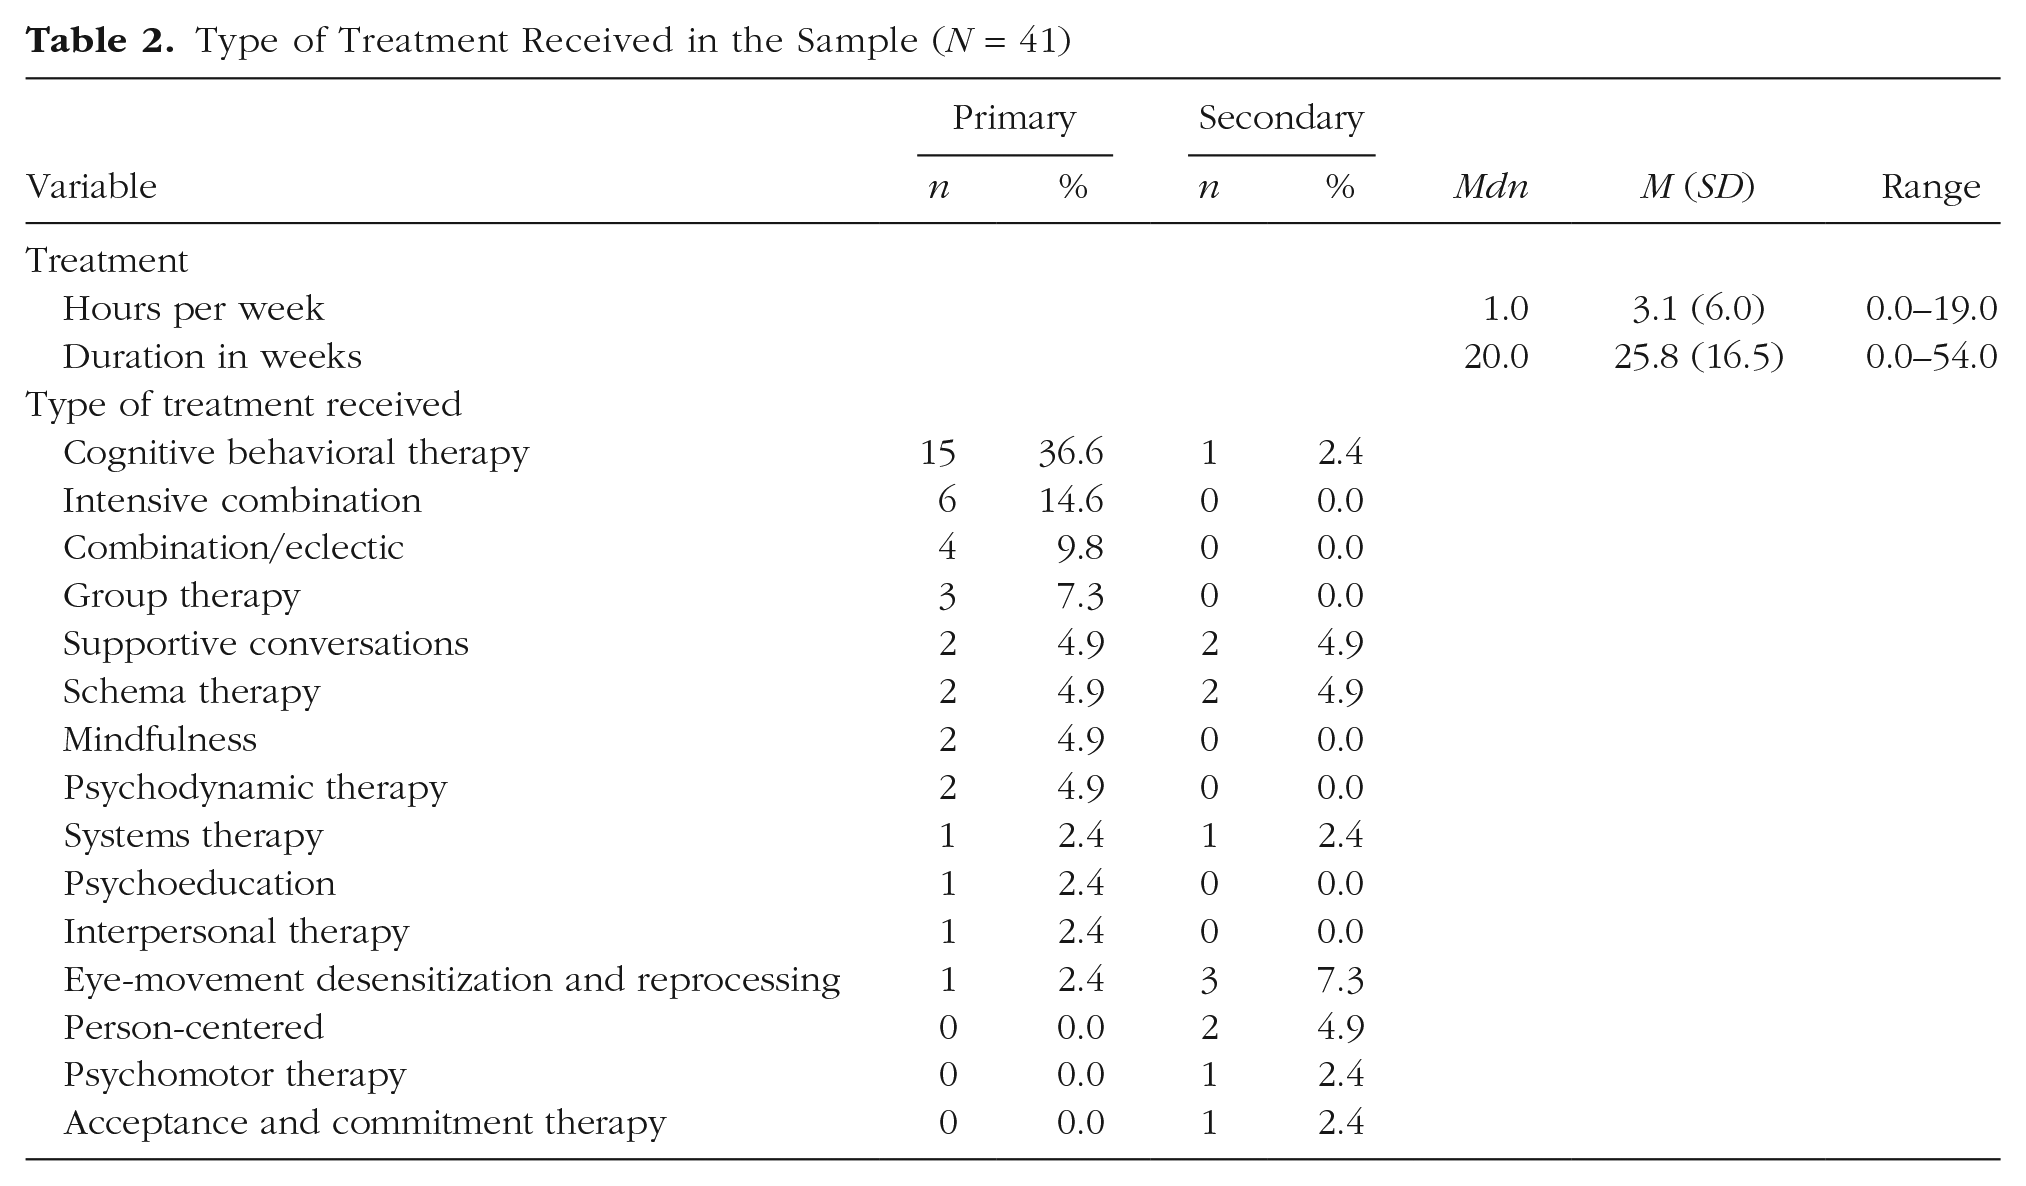
To optimize the chance of capturing transitions in symptoms during the study period, we began participation approximately 3 weeks before the start of a psychological treatment aimed at reducing depressive symptoms. Participants self-enrolled into a psychological treatment as part of care as usual, completely independent of the study. Information on treatment type, duration, and intensity is summarized in Table 2.
Type of Treatment Received in the Sample (N = 41)
Analysis
We preregistered our analysis plan (https://osf.io/xftuq/), meaning that choices regarding the analysis steps (not the study design) were made before we explored the data. Briefly, we first identified transitions in depressive symptoms (on the basis of weekly symptom data) and then tested (a) whether early-warning signals (on the basis of momentary affect assessments) preceded those transitions and (b) how often early-warning signals occurred in individuals without transitions. Early-warning signals were analyzed for each individual and each affective variable (positive affect high arousal, positive affect low arousal, negative affect high arousal, and negative affect low arousal) separately using two different methods, namely a moving-window approach (rises in autocorrelation and variance) and time-varying autoregressive generalized additive modeling (TV-AR GAM; rises in autocorrelation). Missing data were left unaltered, and the calculation of overnight lags was handled by not regressing morning scores on the scores obtained the evening before. We elaborate on each analytical step below.
Transition identification
In line with descriptions of critical transitions, we aimed to identify symptom reductions that appeared relatively abrupt, were reliable, and remained stable for 2 weeks (Scheffer, 2009; Wichers et al., 2016; Zeeman, 1976). We did not know the time period over which a critical transition toward improvement would take place, but symptom reductions occurring over time periods of a week to a month have been described as “rapid” in the clinical literature (Ilardi & Craighead, 1994; Rubel et al., 2015). Therefore, we used an adapted version of the Reliable Change Index (RCI; Jacobson & Truax, 1991), the Duration-Adjusted RCI (DARCI; Helmich, 2021), to examine whether symptoms improved reliably over 1 to 4 weeks (4 being the maximum).
The RCI determines the threshold at which the difference between two points is larger than can be expected from measurement error (Jacobson & Truax, 1991) and is defined as follows:
Next, to calculate the thresholds for reliable change over 2, 3, and 4 weeks, we used the DARCI. Essentially, this method calculates the critical threshold of change from a starting point (tstart) to the last observation in that period (tn) while accounting for the longer period between observations. This is done by reducing the RCI to a confidence range around 1 point, which is then proportionally extended over n points:
To ensure that the identified transitions were not just temporary fluctuations in scores, we added a stability criterion based on the 95% RCI that ensured that the mean of the 2 weeks prior to the first point of a transition (tstart−1, tstart−2) and the 2 weeks after a transition (tn+1, tn+2) was at least different by 8.6 points. This threshold accounts for the additional power gained from applying it to a change between two means rather than two single assessments by dividing it by the square root of n:
Finally, as this method for identifying transitions has not been tested previously, we examined the RCI and DARCI at different confidence levels. We took 95% confidence as a default and additionally explored transitions identified at 90% and 99% confidence.
Moving-window method
Following the two studies that examined critical-slowing-down-based early-warning signals within persons prior to recurrence of depressive symptoms (Wichers et al., 2016, 2020), we used a metric-based moving-window approach to examine rises in autocorrelation and variance in the momentary affect measures (cf. Dakos, Carpenter, et al., 2012). Inside a linearly detrended window of 70 observations (2 weeks), with outliers Winsorized (i.e., extreme values set to the 5th and 95th percentiles), we calculated the values of the Lag 1 autocorrelation and the standard deviation of the affect variables within that window. The window was then moved forward one observation at a time, and the calculation of the autocorrelation and variance was repeated until the end of the time series (no-transition group) or until the transition was reached. The Mann-Kendall test (coefficient τ) was used to test for a monotonic trend in the entire early-warning signals time series of window estimates of autocorrelation and the variance. To improve the specificity of our test, we maintained a minimally relevant effect size of the trend in the early-warning signals time series of τ ≥ 0.1. Specifically, we hypothesized that early-warning signals would be stronger for participants with transitions compared with participants without transitions and, therefore, that the τ coefficients for participants with transitions would be distributed above zero and would more often have a significant positive trend of τ ≥ 0.1 in the early-warning signals time series. In participants without transitions, we would expect the τ coefficient to be distributed around 0 and therefore to show a lower percentage of significant positive trends.
To check sensitivity, we explored the effect of the chosen model settings on our findings by rerunning the analysis with the following parameters altered: window sizes of 35, 105, and 140 observations (instead of 70), global detrending (instead of within window), not removing outliers (instead of Winsorizing). We also checked the effect of using only the Mann-Kendall significance test at α < .05 to detect positive trends in early-warning signals, and we explored the results when the dependency between window estimates (because of overlapping data) was corrected for, using the modified Mann-Kendall test α < .05, as proposed by Hamed and Rao (1998). In accordance with our preregistration, the single items “I feel cheerful” and “I feel down” were also analyzed. The results for those variables and the sensitivity checks are reported in the Supplemental Material.
Time-varying autoregressive generalized additive modeling
To examine whether the autocorrelation coefficient rises before a transition, we explored a recently developed method: TV-AR GAM (Bringmann et al., 2017). This method accounts for nonstationarity in the data by simultaneously modeling the trend (rather than removing it in preprocessing), allowing both the intercept and autoregressive coefficient to vary over time. The TV-AR GAM uses thin-plate splines to fit smooth curves to the time series, provides p values for the intercept and autocorrelation parameter, and provides estimated 95% credible intervals for the fitted curve. A time-varying trend in the autocorrelation was indicated (a) for curves with a significant autocorrelation parameter and (b) where a horizontal line could not be fitted within the credible intervals (i.e., the maximum value of the lower limit was greater than the minimum value of the upper limit). To determine whether there was truly an overall rise in the trend, three raters (authors M. A. Helmich, L. F. Bringmann, and E. Snippe) then visually inspected the diagnostic plots and the modeled smooth curves and decided by consensus on the direction of change—an increase, a decrease, or a nonlinear trajectory (e.g., quadratic, cubic, or more complex nonlinear trajectories, apart from those that were very convincingly rising or declining).
Because the time series for the no-transition group had a higher maximum number of observations (M = 616) than the time series for the transition group, we performed a sensitivity analysis for the no-transition group with the time series shortened to the average length of time series in the transition group: 334, 441, and 458 observations for transitions identified at 90%, 95%, and 99% confidence levels, respectively.
Results
Identified transitions
For nine out of 41 participants (22%), we identified reliable symptom reductions with the DARCI at 95% confidence. The duration of these symptom transitions varied, with five transitions occurring over 1 week, three transitions over 2 weeks, and one transition over 3 weeks. On average, transitions took place after 82 days (SD = 29, range = 51–165). With the DARCI set to 90% confidence, 14 individuals (34%) showed transitions, and at 99% confidence, six cases (15%) remained (for the results for the transition groups at 90% and 99% confidence, see Tables S2 and S3 in the Supplemental Material).
Early-warning signals with the moving-window method
Autocorrelation
The results of the moving-window method indicated that of the nine individuals with a transition, eight (88.9%) showed early-warning signals in the autocorrelation of at least one affective state (M = 1.78 early-warning signals per individual, SD = 1.2). By comparison, of the 32 individuals without transitions, 20 (62.5%) showed at least one early-warning signal in autocorrelation (M = 1.09 early-warning signals per individual, SD = 1.17).
When investigating early-warning signals in the four variables separately (positive affect high and low arousal, negative affect high and low arousal), we found that increases in autocorrelation over time occurred in a higher percentage of individuals with a transition than in individuals without a transition (see Table 3). For individuals with a transition, early-warning signals occurred most often in negative affect high arousal (55.6%) and least often in positive affect low arousal (33.3%). For individuals without a transition, early-warning signals were most often indicated in negative affect high and low arousal (31.2% in both) and least often in positive affect high arousal (18.8%). Unexpectedly, positive affect high arousal did not show a higher number of true-positive early-warning signals than the other variables, instead showing the lowest sensitivity.
Results of the Moving-Window and Time-Varying Autoregressive Generalized Additive Model (TV-AR GAM) Analyses: Average τ Values and Percentage of Early-Warning Signals (EWSs) in Autocorrelation and Variance for Individuals With and Without Transitions
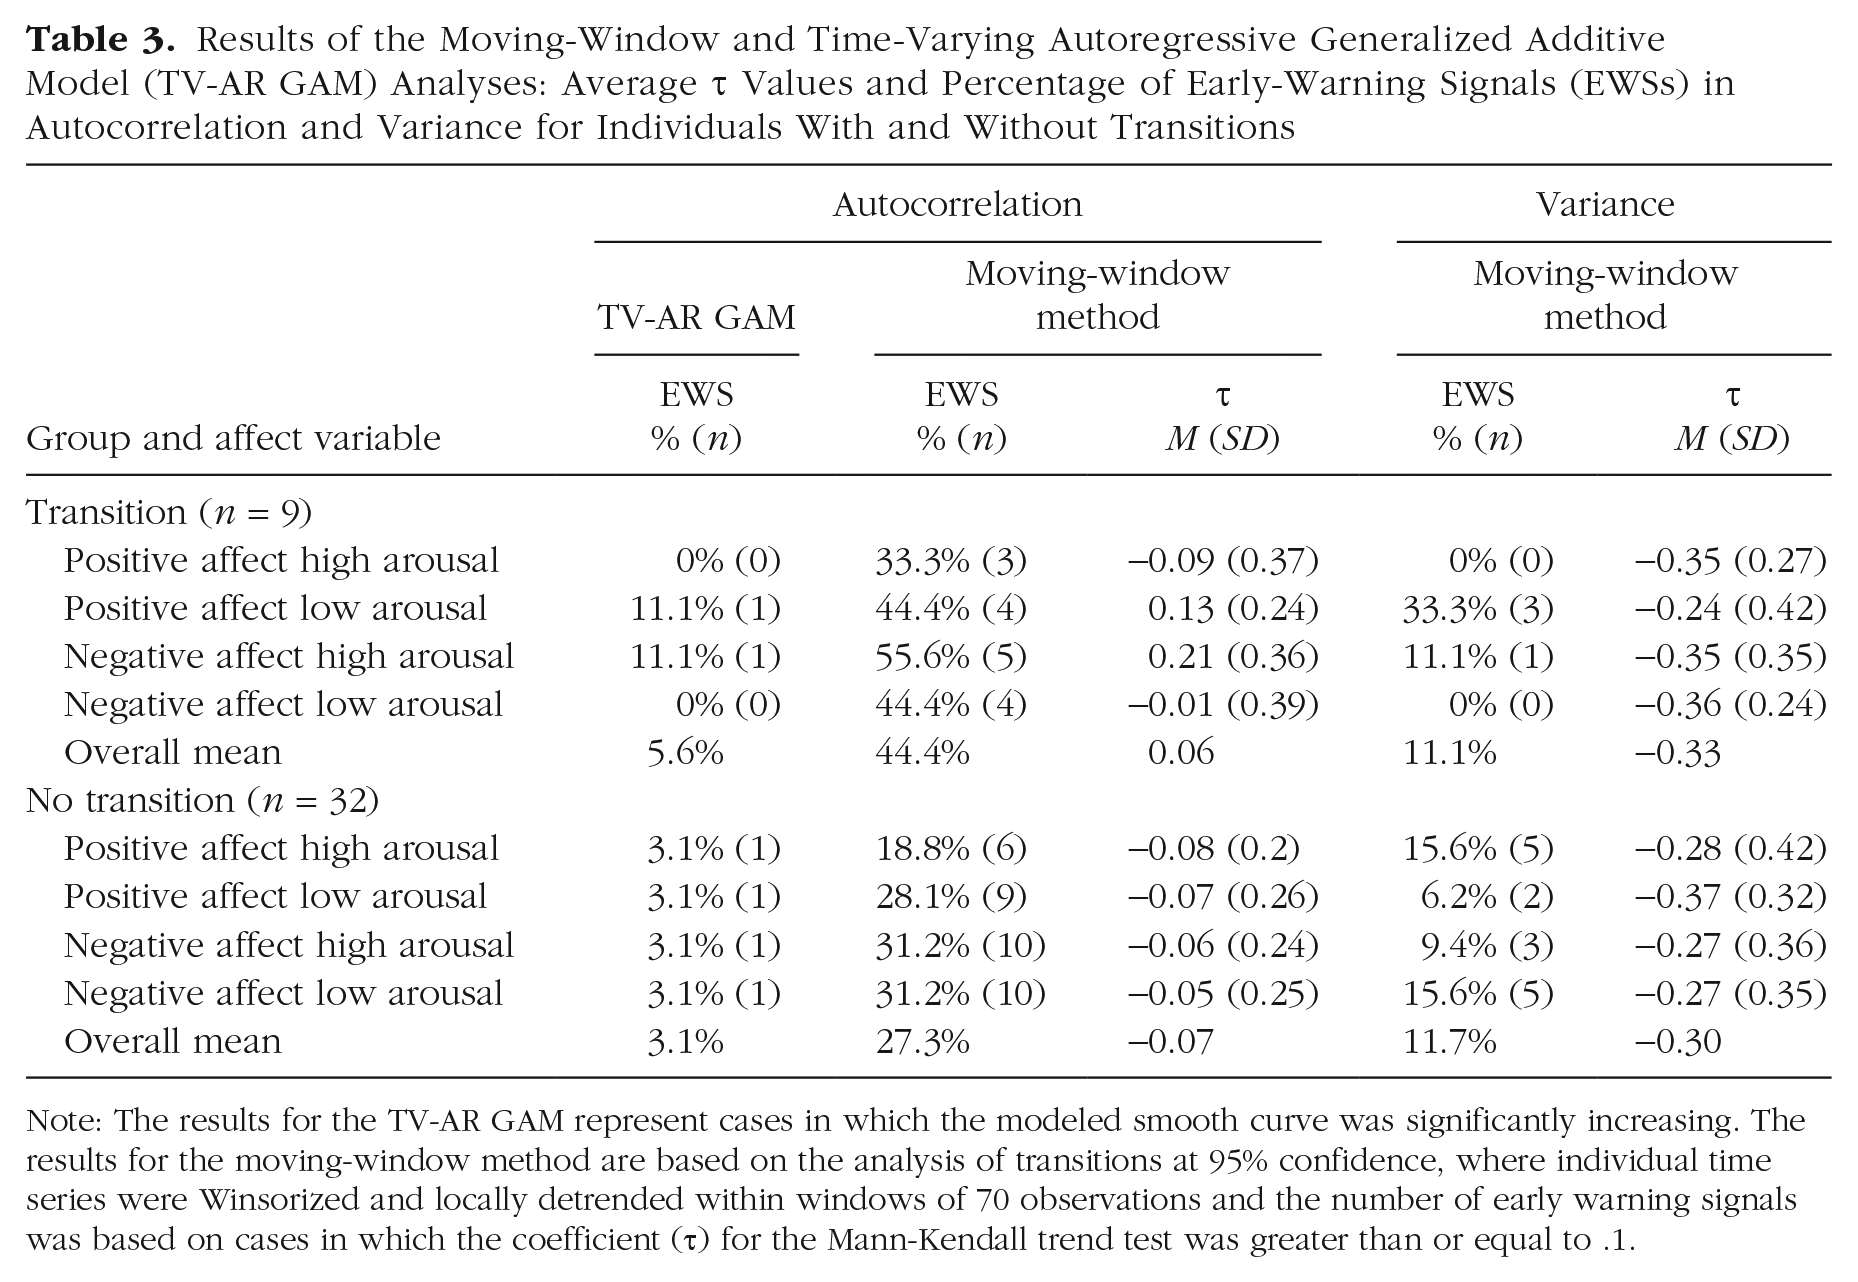
Note: The results for the TV-AR GAM represent cases in which the modeled smooth curve was significantly increasing. The results for the moving-window method are based on the analysis of transitions at 95% confidence, where individual time series were Winsorized and locally detrended within windows of 70 observations and the number of early warning signals was based on cases in which the coefficient (τ) for the Mann-Kendall trend test was greater than or equal to .1.
Variance
Of all nine individuals with a transition, four (44.4%) showed early-warning signals in the variance of at least one affective state (M = 0.44 early-warning signals per individual, SD = 0.53), as did eight (25%) of the 32 individuals without transitions (M = 0.47 early-warning signals per individual, SD = 0.95).
The moving-window analysis showed lower proportions of early-warning signals in the variance of the affect measures than in the autocorrelation (see Table 3). For some variables, the percentage of early-warning signals appeared to be higher in the transition group than in the no-transition group (e.g., for positive affect low arousal, there were three [33.3%] early-warning signals in the transition group and two [6.2%] in the no-transition group). However, averaging the four variables revealed no discernible difference between the groups, with 11.1% true-positive early-warning signals in the transition group and 11.7% false-positive early-warning signals in the no-transition group. Again, positive affect high was not the best-performing measure, showing 0% true-positive early-warning signals and 15.6% false positives in the variance.
Distribution of the τ coefficients
We expected the Mann-Kendall τ coefficients to be distributed above zero for individuals with transitions and around zero for individuals without transitions. However, the average τ coefficients were lower than expected. As can be seen in Table 3, the average τ coefficients for the autocorrelation of the different affect measures appeared to be distributed only marginally above zero in the transition group and below zero for the no-transition group. Only the τ coefficients of the autocorrelations of positive affect low arousal and negative affect high arousal had average values above the τ ≥ 0.1 threshold and showed mostly slightly negative values in the group without transitions. For the variance, the τ coefficients of all affect measures seemed to be more strongly negative on average, with similar values in both groups (for the distributions of the τ values, see Figs. S1a and S1b in the Supplemental Material).
Sensitivity checks
For the autocorrelation, the finding of proportionally more early-warning signals in the transition group was robust across all the altered model settings for the moving-window analysis. The changes in the number of early-warning signals for the autocorrelation found with these altered model settings were similar for individuals with transitions (difference in number of early-warning signals compared with the main analysis: Mdn = 0, first quartile [Q1] = −1, third quartile [Q3] = 0.75) and for individuals without transitions (Mdn = 0, Q1 = −1, Q3 = 1). Increasing the window size to 105 or 140 observations yielded an improvement of the accuracy for this sample (105 observations: 50% true positives, 33% false positives; 140 observations: 58% true positives, 31% false positives).
For the variance, the lack of a proportional difference in early-warning signals between the transition and no-transition groups was consistent across the sensitivity checks. For the altered analysis settings, similar changes in the number of indicated early-warning signals were found for the transition group (difference in number of early-warning signals compared with the main analysis: Mdn = 0, Q1 = −0.75, Q3 = 0), and no-transition group (Mdn = 0, Q1 = 0, Q3 = 1; see also Tables S1a and S1b in the Supplemental Material). None of the altered model settings for the variance yielded notably improved accuracy.
As a post hoc sensitivity check, we inverted our transition criteria to identify participants with transitions toward higher levels of symptoms. The DARCI thresholds over 1 to 4 weeks at 95% confidence were used to identify reliable, sudden symptom increases. The inverted stability criterion tested whether the mean of the 2 weeks prior to the shift was at least 8.6 points lower than the mean of the 2 weeks after the identified transition. This revealed that four individuals from the no-transition group experienced a transition to higher symptom levels, and one individual with a transition toward lower symptom levels also had a reliable worsening of symptoms that occurred earlier than their reliable improvement. Removing these individuals from the summary findings and recalculating the early-warning signals per affect measure over the remaining individuals did not lead to strongly different results (for more details, see Presence and Effect of Transitions to Higher Symptom Levels and Table S1a and S1b in the Supplemental Material).
Early-warning signals with the TV-AR GAM
The trajectories fitted by the TV-AR GAM indicated that, across the four affect variables, the proportion of significant increases in the autocorrelation was comparable between the transition group (M = 5.6%) and the no-transition group (M = 3.1%; see Table 3). Significant decreases and nonlinear trajectories were indicated more often than increases in both groups, with means of 8.3% and 27.8%, respectively, in the transition group and 9.4% and 25.8%, respectively, in the no-transition group.
In our sensitivity checks, reducing the time-series length for individuals in the no-transition group resulted in fewer cases with a significantly time-varying smooth curve (~30% compared with 40% at full length), although the percentage of significant increases in autocorrelation remained similar (2.3% compared with 3.1% at full length). With transitions identified at 90% or 99% confidence, the number of true-positive significant rises in autocorrelation was comparable with the results at 95% confidence (although at 99% confidence, no early-warning signals remained in the transition group) as was the number of false-positive early-warning signals (see Table S3 in the Supplemental Material).
Exploratory findings
In addition to answering the main research question, we also investigated ways to potentially improve the balance of true and false positives of our results. We explored whether we could improve the sensitivity of the moving-window analysis by separating participants according to a minimum cumulative number of early-warning signals. Combining the results of the variance and autocorrelation for positive affect high arousal, positive affect low arousal, negative affect high arousal, and negative affect low arousal showed that selecting individuals with a minimum of two early-warning signals (out of a possible eight) improved the sensitivity, with 77.8% true positives compared with 44.4% in the main analysis, but also resulted in an increase in false positives from 27.3% in the main results to 40.6% (for more details, see Figs. S2 and S3 in the Supplemental Material).
Moreover, we explored different minimally relevant effect sizes by varying the threshold τ value for the moving-window analysis between 0 and 0.5. Our results did not reveal a clear cutoff value that improved the accuracy for all variables (see Fig. S4 in the Supplemental Material). Overall, lowering or raising the τ threshold led to a change in the number of true positives that was approximately matched by the change in false positives.
Discussion
This is the first empirical investigation of whether critical-slowing-down-based early-warning signals in the form of increasing trends in Lag 1 autocorrelation and variance could be detected in individual affect time series in the period before a transition toward depressive-symptom improvement. We examined the prevalence of early-warning signals prior to the symptom transitions identified for nine individuals, as well as the rate of false-positive early-warning signals in the time series of 32 individuals without transitions. We found that rising autocorrelation was present in at least one of the affect measures for eight of the nine (88.9%) individuals with transitions and for 20 of the 32 (62.5%) individuals without transitions. When examining the affect measures separately in the moving-window analysis, we found that early-warning signals in the form of rising autocorrelation were present in proportionally more individuals with transitions (~44%) than without transitions (~27%). A rise in the variance was found in at least one variable for four of the nine (44%) individuals with transitions and for eight of the 32 (25%) individuals without transitions. The percentage of early-warning signals in the variance for the separate affect measures showed similar rates for individuals with transitions (~11%) and without transitions (~12%) and thus did not show the same differentiation between the groups. Furthermore, the TV-AR GAM analysis indicated at most one individual with a significant increase in autocorrelation for each of the four affect measures, in both the transition group (~5.6%) and the no-transition group (~3.1%). In our extensive sensitivity checks, the findings for our analyses were robust. This strengthens our conclusion that the moving-window-detected autocorrelation results were in the hypothesized direction, and the process of remission from depression showed signs of critical slowing down in part of the individuals in our sample.
Looking at the broad pattern of our results, we see that our findings correspond reasonably well with those of earlier studies of early-warning signals in depression (Curtiss et al., 2021; Olthof, Hasselman, Strunk, van Rooij, et al., 2020; Wichers et al., 2016, 2020). Like the single-subject studies by Wichers et al. (2016, 2020), our results showed that within-persons rises in autocorrelation occurred for some of the participants before a transitions in depressive symptoms—in our sample, this also occurred relatively more often for participants with a transition than for participants with no transition. Unlike in those studies by Wichers et al. (2016, 2020), however, we did not find rising variance as an early-warning signal. Furthermore, our finding that early-warning signals occurred before symptom transitions during therapy is in line with the results of Olthof, Hasselman, Strunk, van Rooij, et al. (2020), who found that critical fluctuations had a higher probability of occurring in the 4 days before a sudden gain or loss. However, critical fluctuations are a measure of the spread of scores, such as the variance, which did not function as an early-warning signal in our study. The difference in findings may be explained by the fact that we looked at a different population than did Wichers et al. (2016, 2020; individuals showing depressive-symptom remission rather than recurrence) and a much longer time period than Olthof, Hasselman, Strunk, van Rooij, et al. (2020) for the rising fluctuations (over weeks or months as opposed to days). Yet taking in the broader evidence of all these studies, including the current study, significant destabilization in the form of rising autocorrelation could be identified prior to transitions in symptoms in the affect measures of depressed patients. In our sample, we found signs of critical slowing down (i.e., a rise in autocorrelation in at least one of the affect measures) for eight of the nine individual systems, which was in line with our hypothesis. This suggests that for those individuals, the process of depressive remission showed the nonlinearity one would expect from a dynamic system, particularly in the context of therapy (Hayes & Andrews, 2020; Hayes & Strauss, 1998; Heinzel et al., 2014; Schiepek, 2009; Shapiro, 2015; Strunk & Lichtwarck-Aschoff, 2019).
Although almost all individuals with transitions showed early-warning signals in at least one affect measure, looking at the separate affect measures presents a less consistent picture of critical slowing down in our study. Each variable showed early-warning signals for only a few people in the transition group, and, contrary to what we hypothesized, positive affect high arousal did not turn out to be the most sensitive affect measure to predict symptom improvements. No single affect variable showed early-warning signals for more than five people with transitions. Thus, early-warning signals were not generic indicators of impending symptom change when we considered the variables separately. Theoretical works in ecology have found that variables can be silent and lack early-warning signals when they do not change in the same direction as the destabilization of the main system (Boerlijst et al., 2013; Dakos, 2018; Lever et al., 2020; Patterson et al., 2021). That is, perhaps the heterogeneity of which variables showed early-warning signals was due to the destabilization having occurred in different depressive symptoms for different people. By that reasoning, positive affect high arousal may have shown fewer early-warning signals if destabilization occurred more strongly in depressive symptoms that do not correlate highly with positive experiences (cheerfulness, feeling energetic; cf. Barrett & Russell, 1998; Schreuder et al., 2020, 2022; Wichers et al., 2019).
False negatives may also have occurred because of the nature of transitions in our study. Based on theory, critical slowing down and its corresponding early-warning signals would be expected to occur primarily before critical transitions or shifts between states in systems that are dynamically stable around a single point and are slowly losing resilience (Scheffer, 2009; Zeeman, 1976). It is possible that the transitions we detected did not follow this pattern, for example, because the states prior to and after the transition were not sufficiently stable or because the transition was not preceded by a gradual accumulation of instability (Boettiger et al., 2013). The latter may happen if a transition was triggered by a large push (e.g., a psychologically impactful event) rather than gradual destabilization of the system (Hastings & Wysham, 2010; Nazarimehr et al., 2020; van Der Bolt et al., 2021; van Nes et al., 2016). Thus, it could be that only a subset of individuals in our sample met the theoretical requirements for detecting early-warning signals or that only some of the affect measurements picked up on the changing dynamics, which may have contributed to a lower sensitivity of early-warning signals.
Furthermore, per affect measure, there were six to 10 individuals without transitions who showed false-positive early-warning signals in our study. A potential explanation is that individuals without transitions still experienced a destabilizing influence from entering therapy and thus also showed changes in the temporal dynamics of their affect during the observation period, even if this did not precede a clear discontinuous symptom transition (or end in a change at all). This interpretation is supported by the fact that when we lowered our DARCI confidence level to 90%, the number of true-positive early-warning signals increased (from between three and five early-warning signals to between five and seven early-warning signals per affect measure), whereas the false positives decreased (from between six and 10 early-warning signals to between five and nine early-warning signals per affect measure; see Table S2 in the Supplemental Material). This suggests that some false-positive early-warning signals in the main analysis were likely due to individuals who did experience a relevant symptom improvement but for whom the transition criteria at the 95% confidence level were not met or the shift was not maintained. Our transition criteria were conservative and selected only the most convincing transitions to rule out symptom changes caused by situational factors (which would not be preceded by accumulating instability). Smaller shifts and unmaintained transitions (e.g., flickering) may have been categorized as belonging to the no-transition group, thereby potentially inflating the rate of false positives and underestimating the number of true positives. Further explanations are derived from other fields, in which critical slowing down has also been shown to occur before gradual transitions (Drake & Griffen, 2010; Kéfi et al., 2013), as well as in periods with no significant system change (Kéfi et al., 2013; Nazarimehr et al., 2020). However, most of these early-warning-signals studies have been conducted in an ecological context with very different data, and it is hard to tell which of the processes that influence the finding of early-warning signals in other fields translate to our ability to detect early-warning signals in psychological processes.
The accuracy of our moving-window-detected autocorrelation analyses was not high enough to warrant any claims about clinical utility at this stage. Our exploratory analyses indicated that there was room to improve the method’s performance, as we found improved accuracy for larger window sizes and when looking at the cumulative number of early-warning signals within individuals (a minimum number of early-warning-signals threshold also worked well in two studies of early-warning signals before depressive-symptom recurrence; see Smit et al., 2022; Wichers et al., 2020). Moreover, single predictors are rarely 100% accurate in isolation, and early-warning signals may provide complementary information to early-response indicators, such as severity of depression (Allen et al., 2019; de Vries et al., 2019; Geschwind et al., 2011). Gaining a better understanding of which participants are likely to show detectable early-warning signals could also help improve the sensitivity of this method, for instance by examining the effect of boundary conditions, such as a good therapeutic alliance, on the absence or presence of transitions and early-warning signals during therapy (Schiepek et al., 2014).
The results for the variance indicated a similar prevalence of early-warning signals in individuals with and without transitions. In fact, most people in our study (with and without transitions) showed a negative trend in the variance over time. A clinical explanation for these downward trends in variance relates to our study population: Given that our participants were entering treatment for depressive symptoms, they may have shown higher instability at the start of the observation period because of the destabilizing influence of entering therapy (and because high levels of variability are associated with higher levels of depression; Bos et al., 2018; Peeters et al., 2006; Thompson et al., 2012). As they improved under the influence of therapy, their emotional responses may have become less volatile, and thus an overall downward trend in variance may have emerged in their time series. Another, practical reason for the declines in the variance is that participants may have gotten more habituated to filling out the EMA questionnaires and thus used less and less of the available scale. Finally, previous studies on early-warning signals have also indicated that the variance may show decreases when less data are available and is less robust as an indicator of impending change compared with autocorrelation (Curtiss et al., 2021; Dakos, Van Nes, et al., 2012; van de Leemput et al., 2014; Wichers et al., 2020).
Even though the autocorrelation worked reasonably well as an early-warning signal with the moving-window method, the more conservative TV-AR GAM did not show the same results (cf. Schreuder et al., in press). Possibly, this approach was not optimally suited for the purposes of testing for an overall rise in autocorrelation. Instead, the TV-AR GAM results highlighted the high degree of nonlinearity in the autocorrelation of affect time series in both groups. Although the Mann-Kendall test may detect an overall significant trend over time even if the rise in autocorrelation or variance starts later in the time series, the GAM method is aimed at testing the overall shape of the data and may instead identify similarly late rises as a curving, nonlinear pattern. We do not know over what time period a rise in early-warning signals would be expected in our sample, but a method that allows significant rises to be detected over shorter periods (e.g., a few weeks prior to a transition) may provide an improved rate of early-warning signals detection.
Another reason the TV-AR GAM may have resulted in lower numbers of early-warning signals is that this method required a large amount of data to fit credible intervals that were narrow enough to meet our strict change criterion (the maximum value of the lower bound being larger than the lowest value of the upper bound). Furthermore, the TV-AR GAM is generally conservative and biased to detect zero change if little data are available (cf. Bringmann et al., 2017; Haslbeck et al., 2021; Wood, 2017). While determining the direction of change through visual inspection, we noted that many individuals who showed linear change had confidence bounds that were too wide to identify an increase with certainty. The effect of sufficient (or insufficient) data on the TV-AR GAM findings was evident from the sensitivity check in the no-transition group: When the time series were shortened (e.g., from, on average, 616 to 411 observations in the main analysis), fewer significant smooth curves were found and, particularly, the number of decreases was reduced. It thus seems that the available time-series length may have played a limiting role in our ability to detect early-warning signals with this method.
It is difficult to determine to what extent our findings generalize beyond our sample. There were too few individuals with a transition to reliably test whether the proportional differences between the group with a transition and the group without a transition were significant. Future studies should aim for larger between-persons sample sizes to allow for statistical comparison of the groups. Additionally, we based our early-warning signals on critical slowing down, but the within-persons predictive value of other types of early-warning signals, such as flickering (Dakos et al., 2013), or the synergetics-based dynamic complexity and permutation entropy (Olthof, Hasselman, Strunk, van Rooij, et al., 2020; Schiepek et al., 2020) would be worth exploring in future research.
This study was foremost a proof of principle to see whether critical-slowing-down-based early-warning signals could be found in individual time series of people receiving treatment for depressive symptoms. Our study was designed with the specific intent of detecting rising autocorrelation and variance in individual time series, with several months intensive longitudinal within-persons affect and symptom measurements (totaling 26,408 observations) gathered during a period in which symptom improvement was likely. The compliance of 85% was rather good for an EMA study of this length and intensity, though we cannot be sure of whether and how missingness affected the results. Given that our population differed from the samples used in previous studies of within-persons early-warning signals that looked at relapse in depression (Wichers et al., 2016, 2020), and taking into account the new insights from recent studies (Dablander et al., 2022; Helmich, Olthof, et al., 2021; Schreuder et al., 2020), we preregistered and conducted a very thorough analysis with a range of sensitivity checks. Because of this, we were able to discern the broad pattern of how early-warning signals occurred in our data set and can more confidently state that our findings were robust.
Conclusions
Early-warning signals in the form of a rise in the autocorrelation in negative affect high arousal, negative affect low arousal, positive affect high arousal, and positive affect low arousal preceded symptom transitions toward depressive-symptom improvement in part of the participants and occurred more often for individuals with transitions than for individuals without transitions. Almost all individuals (89%) with a transition had early-warning signals in autocorrelation for at least one of the affect measures, compared with about two thirds of the participants without transitions. Early-warning signals based on the variance of affect did not systematically precede symptom transitions. It is too early to claim any clinical utility of early-warning signals in the context of psychotherapy. However, this study goes beyond a post hoc explanation of nonlinear patterns in psychopathology to provide much-anticipated empirical evidence that the process of symptom remission can follow dynamical systems principles.
Supplemental Material
sj-pdf-1-cpx-10.1177_21677026221137006 – Supplemental material for Detecting Impending Symptom Transitions Using Early-Warning Signals in Individuals Receiving Treatment for Depression
Supplemental material, sj-pdf-1-cpx-10.1177_21677026221137006 for Detecting Impending Symptom Transitions Using Early-Warning Signals in Individuals Receiving Treatment for Depression by Marieke A. Helmich, Arnout C. Smit, Laura F. Bringmann, Marieke J. Schreuder, Albertine J. Oldehinkel, Marieke Wichers and Evelien Snippe in Clinical Psychological Science
Footnotes
Acknowledgements
We thank Elly Sol, Margriet Brandsma, Abel Busz, René de Vries, and Anneke Hol-Steegstra for their invaluable help with the data collection and all the mental health professionals and clinics for their assistance with participant recruitment. We also acknowledge the insightful input from members of the larger Transitions in Depression (TRANS-ID) team, including Yoram K. Kunkels, Robin N. Groen, Harriette Riese, Sandip V. George, and Fionneke M. Bos. Finally, we are especially thankful to all individuals who participated in the study and contributed their data.
Transparency
Action Editor: Aidan G. C. Wright
Editor: Jennifer L. Tackett
Author Contributions
Correction (March 2023):
Article updated to include the Preregistration badge and the Open Practices statement.
Notes
References
Supplementary Material
Please find the following supplemental material available below.
For Open Access articles published under a Creative Commons License, all supplemental material carries the same license as the article it is associated with.
For non-Open Access articles published, all supplemental material carries a non-exclusive license, and permission requests for re-use of supplemental material or any part of supplemental material shall be sent directly to the copyright owner as specified in the copyright notice associated with the article.