
Abstract
Previous studies found that misleading feedback may increase self-reported symptoms. Does this reflect social demand or internalized misinformation? We investigated whether suggestive misinformation may escalate symptoms when it is provided in a context that minimizes social demand. Eighty participants completed the Checklist for Symptoms in Daily Life twice. Between test and retest, participants were given standardized symptom feedback through a bogus computer program that allegedly produced an analysis of their symptom ratings. The feedback pertained to randomly selected symptom ratings of participants: accurate feedback on four ratings (controls) and manipulated feedback (i.e., misinformation) on two other ratings (i.e., targets), which we increased by two full-scale points. Forty-nine (66%) participants accepted both target manipulations, of whom 35 (71%) confabulated explanations for the inflated ratings. Critically, at retest, participants who accepted the misinformation increased their ratings for target symptoms dramatically, whereas ratings for control symptoms and relevant ratings by participants who rejected the misinformation increased moderately. Our findings may help to understand iatrogenic effects of psychotherapy.
Keywords
Although understudied, negative effects from psychotherapy do occur on a nontrivial scale: An estimated 3% to 15% of patients report unwanted side effects of therapy, often reporting worsening symptoms (Linden, 2013; Moritz et al., 2018). Some authors have suggested that symptoms may escalate as a result of extensive symptom exploration, history taking, and diagnostic investigations (e.g., Page & Wessely, 2003). Based on the memory literature on misinformation effects (e.g., see Loftus, 2003), self-reports of vague sensations should be susceptible to misinformation because of the difficulty of detecting the discrepancy between ambiguous symptoms (e.g., feeling tired) and inflated symptom feedback (e.g., “You suffer from severe fatigue”).
Tentative evidence that misinformation may escalate symptoms comes from several sources. For example, one case study described how a misdiagnosis of Alzheimer’s disease promoted a patient’s disease-related beliefs and behavior, which persisted even after correction of the misdiagnosis (Merckelbach, Jelicic, & Jonker, 2012). Experimental studies demonstrated that misinformation may inflate participants’ self-reported symptoms when they are exposed to false expectancies (e.g., Crichton, Dodd, Schmid, Gamble, & Petrie, 2014; Lorber, Mazzoni, & Kirsch, 2007) or exaggerated symptom feedback (e.g., see Baumann, Cameron, Zimmerman, & Leventhal, 1989, Study 1; see also Merckelbach, Dandachi-FitzGerald, van Helvoort & Otgaar, 2019). For example, Merckelbach, Jelicic, and Pieters (2011) and Merckelbach, Dalsklev, van Helvoort, Boskovic, and Otgaar (2018, Study 1) provided undergraduates with suggestive feedback that they had raised levels of certain symptoms (e.g., concentration difficulties). Considerable percentages of participants (63% and 82%, respectively) accepted the misinformation and some confabulated reasons for symptoms they initially did not report (e.g., “I have been drinking too much coffee lately”). However, one problem with these lab studies is that the misinformation was provided by an authority figure (i.e., the experimenter). This raises the possibility that symptom inflation reflected demand characteristics rather than internalized misinformation.
Inspired by the red-herring technique developed by Laney et al. (2008), our study relied on a paradigm in which we tried to minimize the risk that participants would understand the true purpose of the experiment and would intentionally escalate symptoms after having received misleading feedback. Thus, our design involved two separate levels of deception: (a) a cover story and (b) a red herring (i.e., clues for a plausible but incorrect explanation of what the study was about). This way, we believed that participants might come to believe that the cover story for the study they were given was false and that the clues revealed what the study was really about, when in fact these clues also masked the true purpose of the study. As a cover story, we told participants that they were taking part in a project on student stress. We had them interact with a so-called algorithm in development that purportedly examined stress–symptom associations, and told them that their data would be used to further tweak the algorithm. As a red herring, after the presentation of misinformation and just before the retest of self-reported symptoms, we gave them cues that we were interested in test-retest consistency. We emphasized that consistency was important for the calibration of the algorithm and had participants answer a brief but “not-so-subtle” 10-item questionnaire on personal consistency that hinted at this alternative explanation. Both the cover story and red herring worked against participants intentionally incorporating false symptom feedback in their symptom reports.
Method
Participants
Eighty students (mean age = 21.0 years; SD = 2.3; range = 18–30 years; 14 men) from Maastricht University participated in return for course credit and/or small financial compensation. We used a mixed design that involved symptoms (targets vs. controls) and time (Test 1 vs. Test 2) as within-subjects factors and group (accepters vs. rejecters) as a between-subjects factor. We assumed that at Test 2, the difference between target and control symptoms for accepters of symptom misinformation would be moderate (d = 0.48). On the basis of a paired t test, the power analysis (calculated via G*Power 3; Faul, Erdfelder, Lang, & Buchner, 2007) indicated that a sample size of 74 participants was required for the study to have 80% power to detect an effect size (d) of 0.48 with an α level of .05. To err on the side of caution, we tested 80 participants. The study was approved by the standing ethics committee of the Faculty of Psychology and Neuroscience at Maastricht University (ERCP_173_08_03_2010_V1).
Procedure
See Table S1 in the Supplemental Material available online for a comprehensive overview of the procedure, including instructions and material used for each of the three stages in the experiment.
Stage 1: cover story
The experimenter (i.e., the first author) introduced himself as a fellow student. Participants were verbally informed that they were taking part in an important university-wide data project on stress experienced by students so as to enhance student counseling. They were told that an algorithm for mapping stress–symptom associations was currently in development but required further tweaking and calibration on the basis of student data. Participants were informed that for this reason, in the current session and stage of algorithm development, they would be asked to respond to two questionnaires, one about stress circumstances and the other about common symptoms, so that their answers could be fed into the algorithm’s database. They were told that later in the session, the algorithm in development would flag six of their symptoms as standing out in absence or intensity compared with the data of other respondents and that they would be asked to elaborate on these symptoms to further improve the algorithm. The rationale for emphasizing stress circumstances in the cover story was to distract from symptom ratings as the main focus of our experiment. In addition, informing participants that the so-called algorithm was still in development provided us with a credible reason for later providing symptom feedback and asking for elaboration. Importantly, we expected social demand, if present at all, to encourage participants to explicitly disclose and reject “errors” in the algorithm’s feedback given the implicit notion that algorithm malfunction would jeopardize our project.
Stage 1: test 1
Participants completed the Student Stress Questionnaire (SSQ), a bogus self-report measure that we created to lend credibility to the cover story. The SSQ consisted of 33 statements about stressful experiences (e.g., time management) that students might encounter during their studies. Next, participants completed the Checklist for Symptoms in Daily Life (CSDL; Wientjes & Grossman, 1994). The CSDL asks how often respondents have experienced 39 common somatic and psychological symptoms (e.g., tension, chills, sleepiness) in the past year. Both SSQ and CSDL items were rated on 5-point scales (1 = never, 5 = very often). Higher scores on the CSDL indicated higher self-reported symptom levels. The CSDL has satisfactory reliability (α = .92; Wientjes & Grossman, 1994). In the present study, αs for Test 1 and Test 2 were .91 and .92, respectively.
Stage 2: feedback manipulation
After Test 1, each participant played Tetris (a video game) for 10 min. In the meantime, the researcher supposedly formatted the responses of the participant, purportedly to feed it into the algorithm. Instead, unbeknown to the participant, the researcher selected control and target CSDL symptoms based on a file that contained randomly generated numbers between 1 and 39. Then, the researcher edited a keyboard-responsive slideshow that had the appearance of a computer program with feedback pertaining to these specific symptoms (created in E-Prime 2.0; Schneider, Eschman, & Zuccolotto, 2012). All slides of the bogus computer program contained black text on a gray background, a Maastricht University logo, and a copyright statement: “Stress-Symptom Algorithm ©, Maastricht University, The Netherlands, 2017.” The bogus program included an end-user license agreement, slides conveying the illusion that data were being processed, and six slides that each provided feedback on one CSDL symptom rating (for an example, see Fig. 1). Specifically, based on the manual editing and personalization performed by the researcher, the slides displayed accurate feedback for four symptom ratings (controls; Slides 1, 2, 4, and 6) and inflated feedback (i.e., misinformation; ratings increased by two full-scale points) for two symptom ratings (targets; Slides 3 and 5).
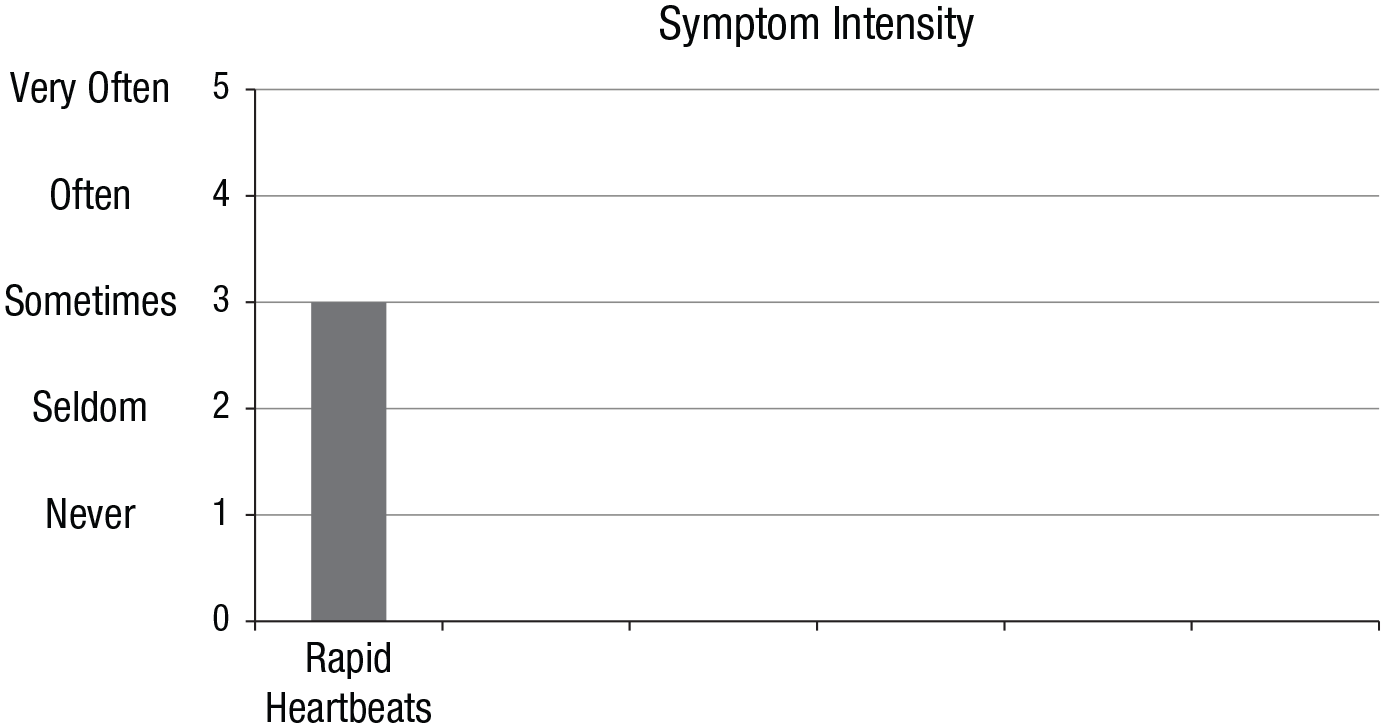
Example of a bar chart that was part of the feedback slides presented by the bogus computer program. Each section in the bar chart (one bar visible, five slots blank) was used sequentially to provide feedback on the six prompted symptoms, one symptom (and corresponding bar) at a time. The heading and bars were presented in a medium blue color. The feedback was also written in a large, bold font above the chart (e.g., “The stress-symptom algorithm indicates that you sometimes suffer from rapid heartbeats”).
Stage 2: misinformation
After this, the researcher sat next to the participant and informed him or her that the data formatting had been completed and that they would run the algorithm together. Participants were reminded that for further calibration, the algorithm would select six of their symptoms “that stood out compared with the scores of other students.” Participants were given a form on which they were requested to write about recent occasions (i.e., situation, time of day, the presence of other people) when these symptoms occurred. The researcher then ran the bogus computer program via a desktop shortcut entitled “Stress-symptom algorithm v0.8.” The researcher pressed the “Run” icon and entered the participant’s research ID number while mumbling, “Let’s see . . . data set [research ID], right?” During the viewing of each feedback slide, the researcher also read symptom feedback out loud: “The stress–symptom algorithm indicates that you [intensity] suffer from [symptom].”
When a participant “rejected” symptom feedback, the researcher looked surprised, paused for a moment, and said, “Are you sure you don’t experience [symptom and intensity]? This is really weird. Perhaps a formatting error occurred, as the algorithm is still under construction, or you may have made an error when filling out the items.” In case the second target score was also rejected, a variation on this response was used by the experimenter that emphasized more concern and appreciation for the feedback (see Table S1 in the Supplemental Material). A target score was coded as “rejected” when the participant indicated that the score presented by the bogus program was incorrect (e.g., by stating that it confused them, that they disagreed, or when they indicated that they remembered their score or perceived their symptoms differently).
Stage 3: red herring
After the symptom-feedback session, participants were asked to complete several questionnaires. They were first given the Brief Personal and Academic Reliability Questionnaire (B-PARQ), a 10-item bogus checklist that we created as part of the red herring. The B-PARQ, scored on a scale from 1 (never) to 5 (very often), was presented as “a questionnaire about consistency in daily and academic life” and contained general statements such as “I eat the same breakfast every morning,” but also not-so-subtle questions such as “I will answer questions about myself in a similar way,” and “While taking a test twice, my answers are very similar,” hinting at our red herring: that the real purpose of our experiment was test–retest consistency. Participants were given the following instruction: For the calibration of the algorithm, we would like to get the most accurate estimates of your stress and symptom levels. Therefore, after filling in the B-PARQ, we would like to ask you to respond to the SSQ and CSDL again.
Specifically, we assumed that the explicit and repeated emphasis on the importance of being consistent would make participants aware that they should rate SSQ and CSDL items at Test 2 the same way they did at Test 1. If anything, social demand would encourage participants to reproduce their earlier Test 1 responses on the SSQ and CSDL at Test 2, regardless of their experience with “the algorithm.” The time between Test 1 and Test 2 was approximately 30 min.
Stage 3: test 2 and other questionnaires
Participants completed the B-PARQ, SSQ, and CSDL. Thereafter, they were presented with an 8-item self-report measure of pathological dissociation, the Dissociative Experiences Scale Taxon (DES-T; Waller, Putnam, & Carlson, 1996). Participants rated the percentage of time (from 0 to 100) during which they experienced each dissociative phenomenon in daily life. Scores were averaged across items to calculate a total DES-T score. In the present study, α was .84. Next, participants responded to the 20-item Toronto Alexithymia Scale (TAS-20; Bagby, Parker, & Taylor, 1994). The TAS-20 is a self-report measure of alexithymia (i.e., experiencing difficulties in identifying and articulating emotions). The TAS-20 is rated on a 5-point scale (1 = strongly disagree, 5 = strongly agree). Scores are summed to obtain a total TAS-20 score that ranged from 20 to 100; higher scores indicate higher levels of alexithymia. In the current study, α was .63. Specifically, we measured self-reported trait alexithymia and dissociation because we suspected that these traits—associated with poor introspective monitoring—relate to susceptibility to symptom escalation (but see Merckelbach et al., 2018). Finally, participants completed an exit questionnaire that measured their ideas about the experiment, after which they were fully debriefed (see Table S1 in the Supplemental Material).
Results
Our hypotheses and the analyses reported below were preregistered at Open Science Framework. Most analyses were confirmatory and in line with previous articles on the topic (Merckelbach et al., 2011, 2018). Tests that involved total CSDL scores, symptom-change scores from Test 1 to Test 2, DES-T scores, and/or TAS-20 scores were exploratory.
Manipulation check
On an open-ended exit-questionnaire item about the goal of the experiment, 50 participants (63%) responded in line with the cover story, and 6 participants (8%) responded in line with the red herring. Only 6 participants (8%) articulated our actual hypothesis; these participants were excluded in the statistical analyses reported below. Answers on a multiple-choice version of this item were similar, except that more participants (20%) opted for the red herring. On an open-ended item, about half of the participants (51%) responded that they did not find anything strange about the experiment, 19 (24%) commented on the oddness of nonessential details (e.g., Tetris, DES-T, TAS-20), and 15 (19%) articulated that the algorithm was incorrect. Only 6 (8%) responded that our background story or the test–retest aspect was odd. Finally, even after participants were informed that we had deceived them, only 22 (28%) guessed our hypothesis correctly. Eleven respondents (14%) indicated that the algorithm was a cover up for test-retest reliability measures, testifying to the effectiveness of the red-herring technique (Laney et al., 2008).
Proportion of accepters
During exposure to the algorithm feedback, 49 (66%) participants accepted both target manipulations (i.e., did not articulate that the feedback was incorrect), 19 (26%) participants accepted one manipulation but rejected the other, and 6 (8%) rejected both target manipulations. From the 49 accepters, a subset of 35 (71%) were “confabulators” (i.e., wrote down reasons that explained why an upgraded symptom rating pertained to them). An accepter’s written elaboration was coded as a confabulation when it mentioned reasons for and/or frequency of occurrence for a symptom in line with the upgraded rather than the actual (Test 1) CSDL rating.
Excerpts from the confabulations are as follows: “[Dizziness] . . . happens on a weekly basis”; “When I noticed [tingling in my feet], I decided that it was time for a break”; “I sometimes [feel confused] when I really try to concentrate”; “I usually notice [joint pain] when I get up from being seated and move and stretch myself”; “Before my last exam I was so nervous that I [couldn’t breathe deeply]”; “I sometimes suffer from [stomach cramps], but not recently”; and “I often suffer from [pounding of the heart] as a result of constant worry.”
Overall symptom scores
Accepters’ mean total CSDL scores at Test 2, M = 2.09, 95% confidence interval (CI) = [1.95, 2.23], were lower than those at Test 1, M = 2.11, 95% CI = [1.97, 2.22], but their mean decrease in total CSDL scores was not statistically significant, t(48) = 0.19, p = .85, d = 0.03. Rejecters’ mean total CSDL scores at Test 2, M = 2.05, 95% CI = [1.83, 2.27], were lower than those at Test 1, M = 2.13, 95% CI = [1.90, 2.35]. The mean decrease in total CSDL scores was statistically significant, t(24) = 3.35, p = .003, and was associated with a moderate to large effect size, d = 0.67.
Symptom escalation
To test whether participants adopted the upward manipulation at Test 2, we performed a 2 (group: accepters vs. rejecters) × 2 (time: Test 1 vs. Test 2) × 2 (symptom: correct symptom feedback [controls] vs. false symptom feedback [targets]) repeated measures analysis of variance (ANOVA) on relevant CSDL ratings. Accepters consisted of those participants who accepted both false feedback items (n = 49). The rejecters group consisted of participants who had rejected at least one instance of false symptom feedback (n = 25). There were statistically significant interactions of group and symptom, F(1, 72) = 4.62, p = .035, η p 2 = .06, group and time, F(1, 72) = 6.93, p = .010, η p 2 = .09, and symptom and time, F(1, 72) = 28.96, p < .001, η p 2 = .29. Most importantly, the critical three-way interaction between group, time, and symptom attained statistical significance, F(1, 72) = 13.01, p = .001, η p 2 = .15 (see Fig. 2; also see our file in the Supplemental Material for simple effects).
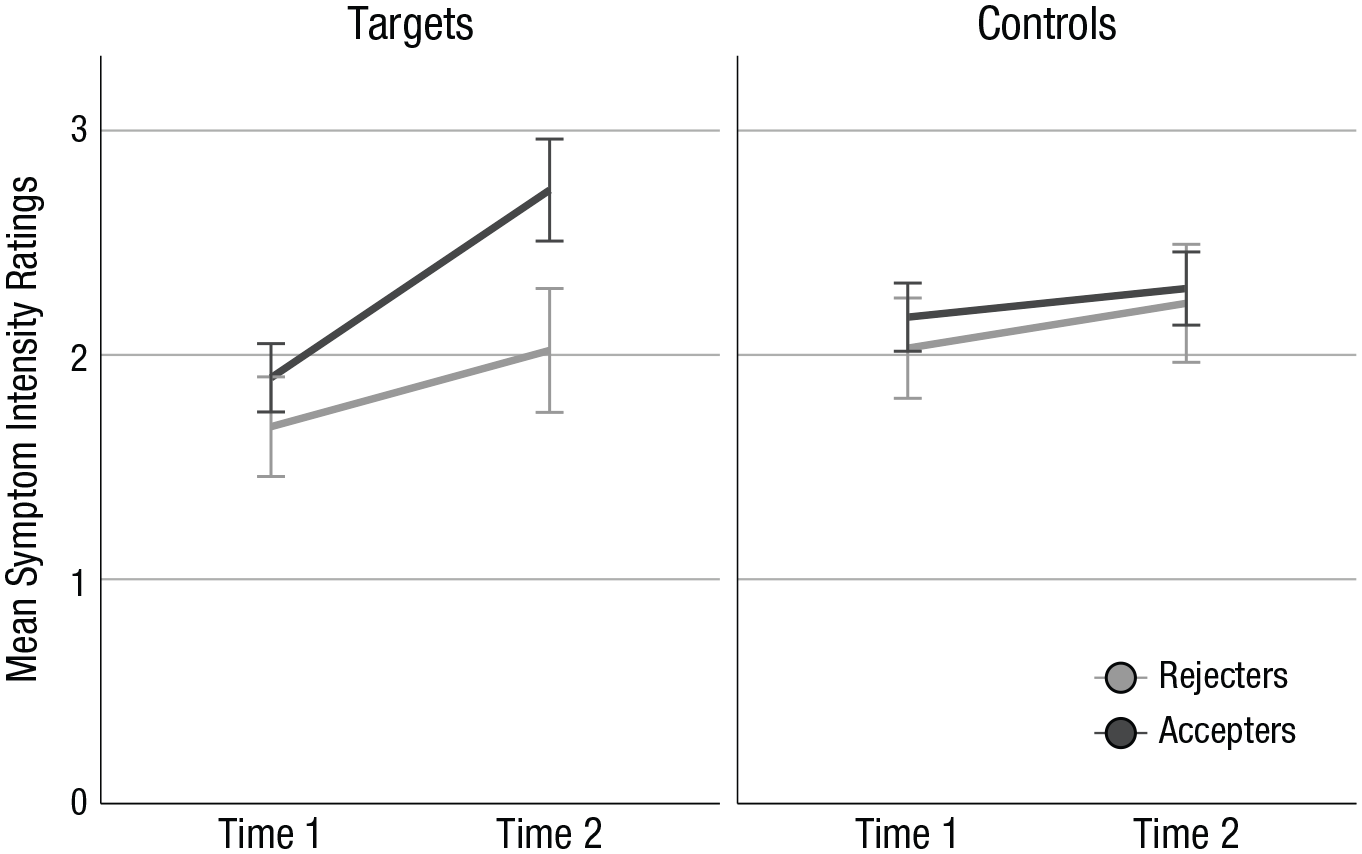
Mean symptom intensity ratings (1–5) for target and control items at Test 1 and Test 2, separately for participants who accepted (n = 49) and rejected (n = 25) symptom misinformation. Error bars indicate 95% confidence intervals.
Exploratory analyses
As a follow-up analysis, we conducted t-tests on change scores. To this end, we calculated for accepters and rejecters Test 2 minus Test 1 scores for target and control symptoms. Change scores for targets were statistically significantly larger, t(72) = 3.46, p = .001, d = 0.90, in accepters, M = 1.67, 95% CI = [1.31, 2.03], than in rejecters, M = 0.68, 95% CI = [0.33, 1.03], whereas change scores for control symptoms did not differ, t(72) = 1.04, p = .30, d = 0.27, between accepters, M = 0.51, 95% CI = [0.17, 0.85], and rejecters, M = 0.80, 95% CI = [0.43, 1.18]. In addition, change scores were statistically significantly higher for targets than for controls, t(48) = 4.66, p < .001, d = 0.67, in accepters, but not in rejecters, t(24) = 0.47, p = .64, d = 0.09.
Next, we looked at DES-T and TAS-20 scores of those participants who accepted or rejected misinformation. One respondent did not complete the DES-T but did complete the TAS-20. We ran independent Welch’s t tests and found that accepters and rejecters did not differ statistically significantly with regard to their scores on the DES-T, t(42.69) = −0.20, p = .85, d = 0.20, and TAS-20, t(58.85) = 0.04, p = .97, d = 0.04. Likewise, “escalators” (i.e., participants who at Test 2 had at least one increased target score and no decreased target score) did not differ statistically significantly from “nonescalators” with regard to their scores on the DES-T, t(22.32) = 1.15, p = .26, d = 1.15, and the TAS-20, t(24.02) = 1.07, p = .29, d = 1.07.
Discussion
Our study is a first experimental demonstration of symptom escalation as a result of false feedback using a design that was intended to minimize social demand. A majority of participants indicated on the exit questionnaire that they believed one of our two cover stories that operated against symptom escalation. Still, a substantial proportion of students accepted symptom misinformation, confabulated reasons for upgraded ratings, and demonstrated elevation of manipulated symptoms but not overall symptoms at Test 2. Thus, target symptom ratings of accepters had increased, which reflects symptom inflation as a result of misinformation.
Although our exit-interview findings suggest that we were successful in minimizing demand, researchers in future studies may want to incorporate the following more stringent design elements: (a) an a priori check in which naive participants are shown the entire method and are asked to predict and express certainty about how actual participants would respond; (b) “blind” research assistants (i.e., to minimize subtle and unanticipated demand); (c) a more extensive post hoc interview conducted by an unaffiliated person, with participant anonymity guaranteed and strong demands for honesty, during which participants would be asked about their assumptions regarding the purpose of the experiment.
We do not want to argue that demand characteristics are irrelevant to symptom inflation. Our point is that even in the absence of demand characteristics, people find it difficult to calibrate symptom intensities. When they attempt to quantify their symptom self-reports, they are affected by contextual information or misinformation. We speculate that this is due to the ambiguous nature of symptoms (Rietveld & van Beest, 2007), which may make people sensitive to misleading feedback. Such feedback effects are also likely to occur in replications of our experiment that use symptom self-report measures other than the CSDL, including scales that address psychological symptoms (e.g., see Merckelbach et al., 2011). Beyond the current study, whether misleading feedback may also inflate more objective parameters of symptoms (e.g., heart rate) and may initiate a cascade of pseudo memories that “explain” the symptoms remains to be seen.
The present study was limited to a sample of healthy university students and we focused on a limited number of symptoms. Our algorithm paradigm may seem far removed from clinical practice, yet there are case studies illustrating, for example, that suggestive feedback from wearable sleep trackers may encourage people to believe that they have a sleep disturbance (Baron, Abbott, Jao, Manalo, & Mullen, 2017). In future, researchers may want to address how iatrogenic interventions such as extensive symptom exploration may worsen symptoms in vulnerable people (e.g., people with psychopathology and/or low education).
The field of psychology has not paid much attention to symptom worsening during psychological treatment (Linden, 2013). It is often seen as an artifact that is explained away with the “no-pain no-gain” doctrine (Moritz et al., 2018). Nevertheless, in one survey (N = 653), 17.2% of former patients reported that their symptoms had worsened during treatment (Rozental, Kottorp, Boettcher, Andersson, & Carlbring, 2016). Hence, it is essential to elucidate the mechanisms that drive symptom worsening; as the current results show, misleading feedback is one important candidate. Our experimental demonstration of a misinformation symptom-escalation link is just a first step, and we invite others to replicate and extend the paradigm.
Supplemental Material
Helvoort_Open_Practices_Disclosure – Supplemental material for Worsening of Self- Reported Symptoms Through Suggestive Feedback
Supplemental material, Helvoort_Open_Practices_Disclosure for Worsening of Self-Reported Symptoms Through Suggestive Feedback by Daniël van Helvoort, Henry Otgaar and Harald Merckelbach in Clinical Psychological Science
Supplemental Material
vanHelvoort_Supplemental_Material – Supplemental material for Worsening of Self- Reported Symptoms Through Suggestive Feedback
Supplemental material, vanHelvoort_Supplemental_Material for Worsening of Self-Reported Symptoms Through Suggestive Feedback by Daniël van Helvoort, Henry Otgaar and Harald Merckelbach in Clinical Psychological Science
Footnotes
Action Editor
Scott O. Lilienfeld served as action editor for this article.
Author Contributions
D. van Helvoort designed the study. H. Merckelbach and H. Otgaar provided helpful comments on the design. D. van Helvoort conducted testing, data collection, data analysis, and interpretation under the supervision of H. Merckelbach. D. van Helvoort drafted the manuscript and the revision, and H. Merckelbach and H. Otgaar provided comments and revisions. All of the authors approved the final version of the manuscript for submission.
Declaration of Conflicting Interests
The author(s) declared that there were no conflicts of interest with respect to the authorship or the publication of this article.
Open Practices
All data and materials have been made publicly available via Open Science Framework and can be accessed at https://osf.io/kpgdt. The design and analysis plans for the experiments were preregistered at https://osf.io/cqxsn. The complete Open Practices Disclosure for this article can be found at http://journals.sagepub.com/doi/suppl/10.1177/2167702619869184. This article has received badges for Open Data, Open Materials, and Preregistration. More information about the Open Practices badges can be found at ![]() .
.
References
Supplementary Material
Please find the following supplemental material available below.
For Open Access articles published under a Creative Commons License, all supplemental material carries the same license as the article it is associated with.
For non-Open Access articles published, all supplemental material carries a non-exclusive license, and permission requests for re-use of supplemental material or any part of supplemental material shall be sent directly to the copyright owner as specified in the copyright notice associated with the article.