
Abstract
Racially and ethnically diverse youth with disabilities receiving Supplemental Security Income (SSI) benefits were randomly assigned to usual services, including available school and vocational rehabilitation (VR) transition services, or enhanced case management and transition services through the Wisconsin Promoting Readiness of Minors in SSI (PROMISE) federal demonstration grant. A hierarchical logistic regression analysis demonstrated increased age, being African American, having a psychiatric disability, and transition services predicted higher youth employment rates. However, enhanced PROMISE transition services were no longer significant in the presence of VR services, suggesting the effect of enhanced services was mediated by increasing engagement in VR. Limitations and implications are discussed regarding the relationship between school and state VR transition services and postsecondary competitive integrated employment outcomes.
Keywords
Postsecondary transition planning, services, and advocacy help students with disabilities in reaching their education, employment, and independent living goals. Despite efforts, high rates of underemployment persist. Diminished employment is linked to other postsecondary challenges, including social isolation and poverty (Fogg et al., 2010; Smedema et al., 2018). In 2018, the employment-population ratio was 19% among persons with disabilities compared to 66% of persons without disabilities (Bureau of Labor Statistics [BLS], 2020). A similar discrepancy extends to transition-age youth with disabilities. Among youth with disabilities age 16 to 19 years, employment rates are 17% compared to 31% of their counterparts; among those age 20 to 24 years, 38% are employed compared to 67% without disabilities (BLS, 2020). Multiple factors correlate with employment rates of transition-age youth with disabilities, including race, ethnicity, disability, age, gender, and transition services.
Considerable evidence suggests that the sources of poor employment and postschool outcomes are compounded for individuals who are culturally, racially, ethnically, and linguistically diverse. African American and Hispanic youth with disabilities are among the most vulnerable (Banks, 2014; Booth et al., 2016; Greene, 2014; Thoma et al., 2015). In contrast, White students with disabilities are more likely to earn more than the federal minimum wage (Wagner et al., 2006) and more likely to work in community employment (Rooshey & Balcazar, 2009). With extensive histories of discrimination against youth of color and individuals with disabilities, African American and Hispanic youth with disabilities remain vulnerable to multiple types of biases and structural barriers. Increasing opportunity and improving outcomes require identifying supports that mitigate oppression and enhance outcomes (Gatlin & Wilson, 2016).
Symptoms associated with disability can influence engagement in employment services, postsecondary education, and employment (Akinola & Dunkley, 2019). For youth with psychiatric and intellectual and developmental disabilities (IDD), finding competitive integrated employment remains a challenge (Akinola & Dunkley, 2019; Bouck & Joshi, 2016; Butterworth et al., 2015; Wehman et al., 2014). Yet, employment and training services that connect youth with psychiatric disabilities directly to paid jobs in the community improve both employment outcomes and mental health (Akinola & Dunkley, 2019). When implemented with fidelity, Individual Placement and Supports (IPS) can increase employment rates when partners (e.g., vocational rehabilitation, schools and mental health agencies) collaborate, maintain consistently high expectations, and reduce mental health stigma (Noel et al., 2018). Work experiences and training in high school, including IPS and customized employment, can also increase competitive integrated employment for transition-age youth with IDD (Noel et al., 2018; Riesen et al., 2015; Wehman et al., 2018).
The Individuals with Disabilities Education Improvement Act (IDEIA, 2004) mandates transition planning by age 16. Many states, including Wisconsin, begin transition planning at age 14 (Wisconsin Statute 115.787(2)(g)1). Some research has demonstrated that commencing transition planning by age 14 improves employment outcomes (Cimera et al., 2014). This said, it is important to note that younger youth employment rates have been shown to be more affected by state unemployment rates (Alsaman & Lee, 2017). In other words, younger youth are less likely than older youth to find a job when local unemployment rates are high.
Employment outcomes of transition-age youth highlight increased employment outcomes for males. More male youth received vocational rehabilitation (VR) services and had greater odds of obtaining successful employment than their female peers (Alsaman & Lee, 2017). Similarly, the implementation of several federal grant projects known as Promoting Readiness of Minors in Supplemental Security Income (PROMISE) served more males. This higher male participation was consistent with the gender differences of teenage youth receiving Supplemental Security Income (SSI; Hartman et al., 2019; Selekman et al., 2018). Despite higher male participation rates, PROMISE evaluation has not yet indicated any differences in employment outcomes by gender (Hartman et al., 2019; Mamun et al., 2019).
VR services are positively associated with employment for adults and transition-age youth with disabilities (Dutta et al., 2008; Kaya et al., 2016; Rumrill et al., 2017). VR services more strongly influenced outcomes than did demographic or receipt of social security disability benefits (Kaya et al., 2016; Rumrill et al., 2017). In contrast, Awsumb and colleagues (2020) found transition-age youth with disabilities were not consistently connected to VR services and, of those who were, employment was not significantly improved. One aim of the Workforce Innovation and Opportunity Act (WIOA, 2014) is to increase youth connection and participation with VR services through pre-employment transition services, including job exploration counseling, work-based learning experiences, counseling on postsecondary education enrollment opportunities, workplace readiness training, and instruction in self-advocacy (Honeycutt et al., 2019). The current study aimed to better understand what demographic and transition services variables best predict employment outcomes.
Current Study
Wisconsin PROMISE was one of six research demonstration projects developed to assist youth between the ages of 14 and 16 receiving SSI in achieving their career and education goals (Hartman et al., 2019; Mamun et al., 2019; Selekman et al., 2018). All PROMISE sites were required to implement core program components, including formal agency-level partnerships, case management, benefits counseling and financial literacy training, career and work-based learning experiences, and parent training (Selekman et al., 2018). The Wisconsin PROMISE program implemented these services through Wisconsin’s state VR program in partnership with schools and state disability and poverty programs. Following enrollment, youth were randomly assigned to services as usual or Wisconsin PROMISE services. Usual services included receiving information about school and VR-based transition services by mail. Wisconsin PROMISE services included enrollment in Wisconsin’s VR program and assignment to a program counselor. As part of the youth’s Individual Plan for Employment (IPE), the counselor worked with the youth and family to develop a resource team, which often included someone from the youth’s school, thus allowing coordination of PROMISE, VR, and school transition services (Hartman et al., 2019; Selekman et al., 2018).
Initial analyses of Wisconsin PROMISE results demonstrated increased employment for youth in the Wisconsin PROMISE treatment services group (Hartman et al., 2019). Increased employment occurred across youth with disabilities, including those from historically minority backgrounds and from low income households. The purpose of the current study was to more directly explore the relationship between youth demographics (race, ethnicity, disability, age, gender), the different transition services youth received (PROMISE, VR, and school), and employment. The following research questions were investigated:
Method
Participants
Data were collected through the Wisconsin PROMISE federal research demonstration grant from the U.S. Department of Education. Participants were youth receiving SSI and were 14, 15, or 16 years old when they enrolled in the project between April 2014 and April 2016 (Hartman et al., 2019). A total of 2,024 participants enrolled in the Wisconsin PROMISE grant. Seven youth withdrew from the study. Therefore, the remaining 2,017 participants were included in the analysis.
Predictor Variables
Demographics
Age, race/ethnicity, gender, and primary disability were self-reported on the Wisconsin PROMISE intake form. Age at intake was calculated based on enrollment date and the youth’s birthdate. Gender was self-reported as male (67%) or female (33%). Seven youth did not report gender, so they were not included in either group. Youth self-reported their race/ethnicity as African American (49%), White (36%), Hispanic (10%), and Other (5%). Youth self-reported primary disability as psychiatric (34%), IDD (30%), or Other (36%; Hartman et al., 2019).
Transition services
Youth could receive up to three different types of transition services: PROMISE, school, and VR. Half the youth were randomly assigned to receive PROMISE transition services (treatment) and half to services as usual (control). VR and school transition services were included in the Wisconsin PROMISE Management Information System (MIS) via administrative data sharing agreements (Guentherman et al., 2020). Youth were counted to have received VR services if they had at least one paid VR service on their IPE. All youth in the PROMISE treatment group had a VR case, and 33% of control youth had a VR case (Hartman et al., 2019). Youth were counted to have received school transition services if they had a service included on their electronic Individualized Education Program Postsecondary Transition Plan (IEP PTP). At intake, 84% of participants reported having an IEP (Hartman et al., 2019).
Outcome Variable
Employment rates
Measured employment rates were based on quarterly wages reported to Wisconsin’s Unemployment Insurance (WI-UI) by employers and provided to the PROMISE data system via administrative data sharing agreements. A dichotomous employment variable (ever worked) was defined as having WI-UI wages reported in any quarter from April 2014 to September 2018.
Descriptive Statistics
Prior to conducting statistical analysis, researchers calculated employment rates for each demographic group and transition services group. To further understand the interaction between demographic groups and the transition services groups, researchers calculated both participation rates and employment rates for each demographic group by receipt of PROMISE services, VR services, and school IEP transition services.
Statistical Analysis
The Statistical Package for Social Scientists (SPSS version 24.0) was used for data analysis. Hierarchical logistic regression (HLR) analysis was used to examine the relationship between the predictor variables and the employment outcome variable. Multilevel analysis or hierarchical modeling is used to compare models with repeating predictor variables (nested) at more than one level. HLR provides a mechanism to implement hierarchical modeling when predictor and outcome variables are categorical, as is the case in the current study (Tabachnick & Fidell, 2019). Statistical analysis was conducted in a step-by-step fashion, identifying the statistical significance of each step of the model, determining what variables significantly predicted employment outcomes, and comparing results in each step with the previous step and with the final model that included all predictor variables and the outcome variable.
The predictor variables for the current study’s HLR analysis included each demographic variable and each transition services group. The outcome variable was employment rate (ever employed during the study period). In the first step of the HLR, demographic covariates (age, gender, race/ethnicity, disability) were entered. For the demographic variables, the focal group was the group with the most youth. The demographic variables were coded as follows: (a) age (continuous variable), (b) gender (female as the reference group and male as the focal group), (c) race/ethnicity (White, Hispanic, and other as reference groups and African American as the focal group), and (d) disability (IDD and other disabilities as the reference groups and psychiatric disability as the focal group). In the second step of the HLR, the PROMISE service (treatment, control) variable was entered. PROMISE transition services (treatment) were coded as the reference group and usual services (control) as the focal group. In the third step of the HLR, the VR services variable was entered. VR transition services were coded as the reference group and no VR services as the focal group. In the fourth and final step of the HLR, the school IEP transition service variable was entered. School IEP transition services were coded as the reference group and no school IEP transition services as the focal group.
Results
Descriptive Trends
Employment rates for participant demographics and transition service groups are shown in Table 1. Demographic differences included higher employment rates by age, similar rates by gender, higher employment rates for African American youth compared with Hispanic youth, and higher employment rates for youth with a psychiatric disability. Employment rates also varied by transition services. Youth who received VR services had the highest employment rates, followed by youth who received PROMISE services and youth who received school IEP transition services.
Employment Rates for Participant Demographics and Transition Services.
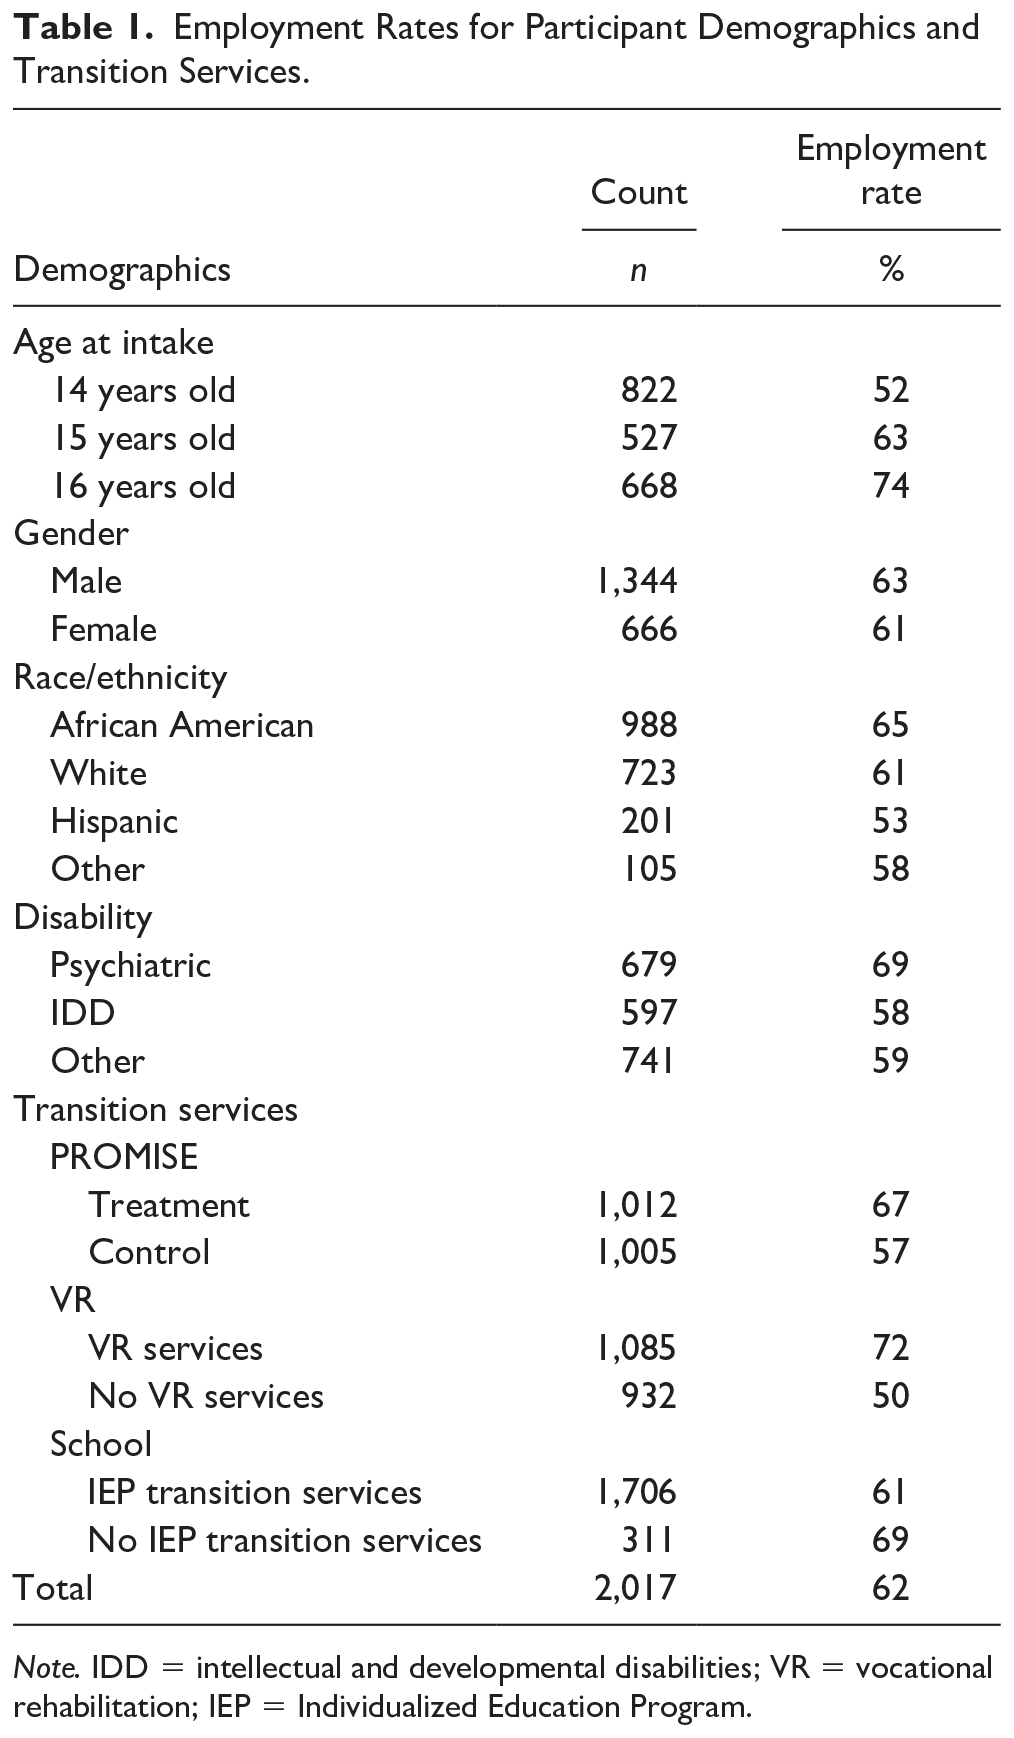
Note. IDD = intellectual and developmental disabilities; VR = vocational rehabilitation; IEP = Individualized Education Program.
Patterns emerged for transition service participation and subsequent employment rates by each demographic group. First looking at participation rates, as expected given random assignment, roughly half of youth in each demographic group received PROMISE services. Table 2 shows PROMISE service participation rates and employment outcomes by demographic group. Without random assignment, participation in VR services varied more by demographic groups. Table 3 shows VR participation rates and employment outcomes by demographic group. Most youth received school IEP transition services, but variation was still observed by demographic group. Table 4 shows school IEP transition service participation rates and employment outcomes by demographic group.
Percentage of Participation and Employment Rates by Demographics and PROMISE Transition Services.
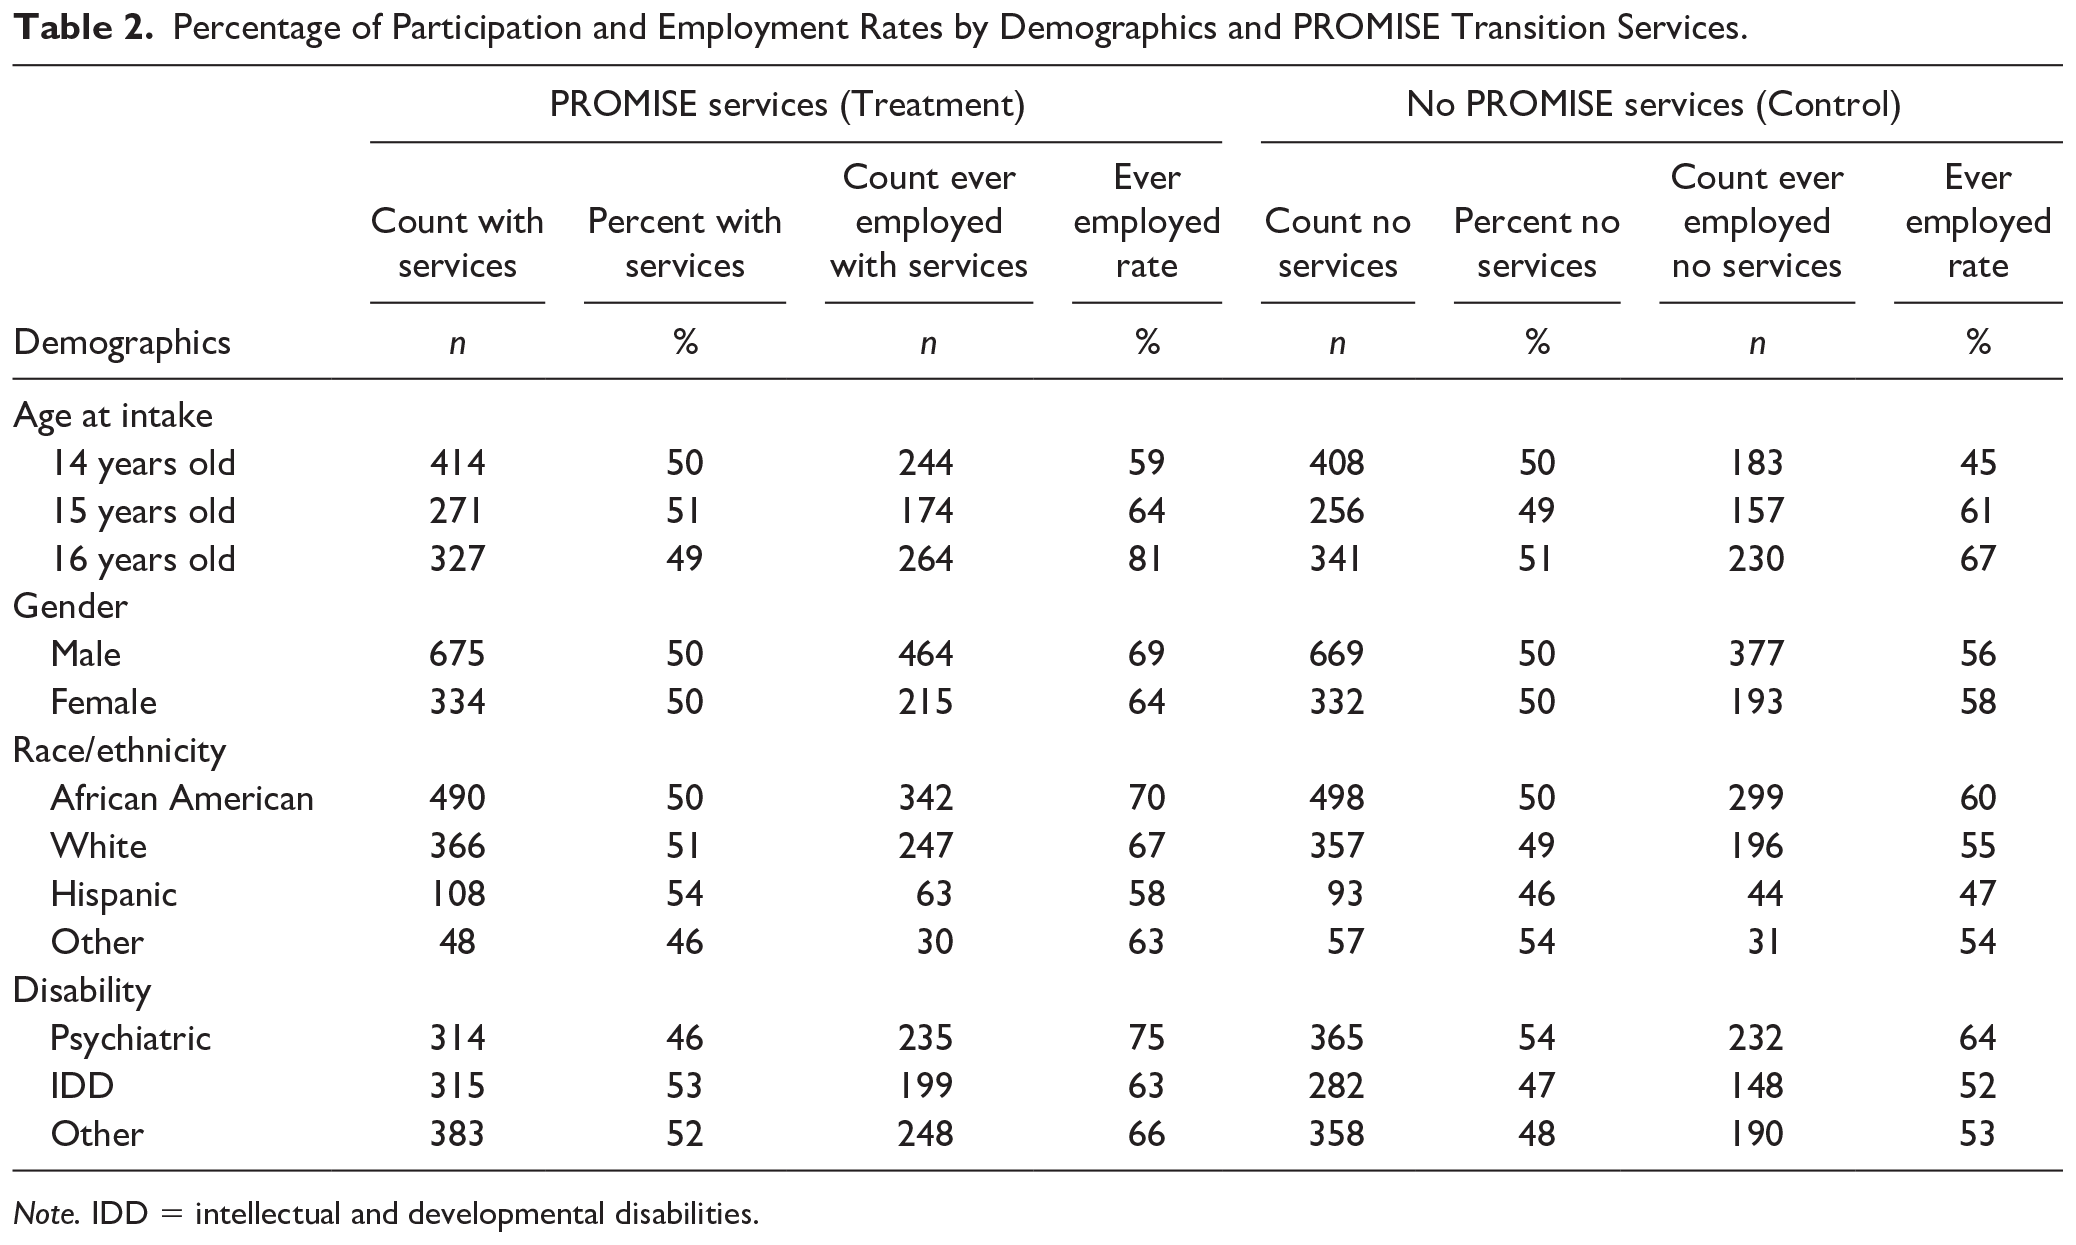
Note. IDD = intellectual and developmental disabilities.
Percentage of Participation and Employment Rates by Demographics and VR Services.
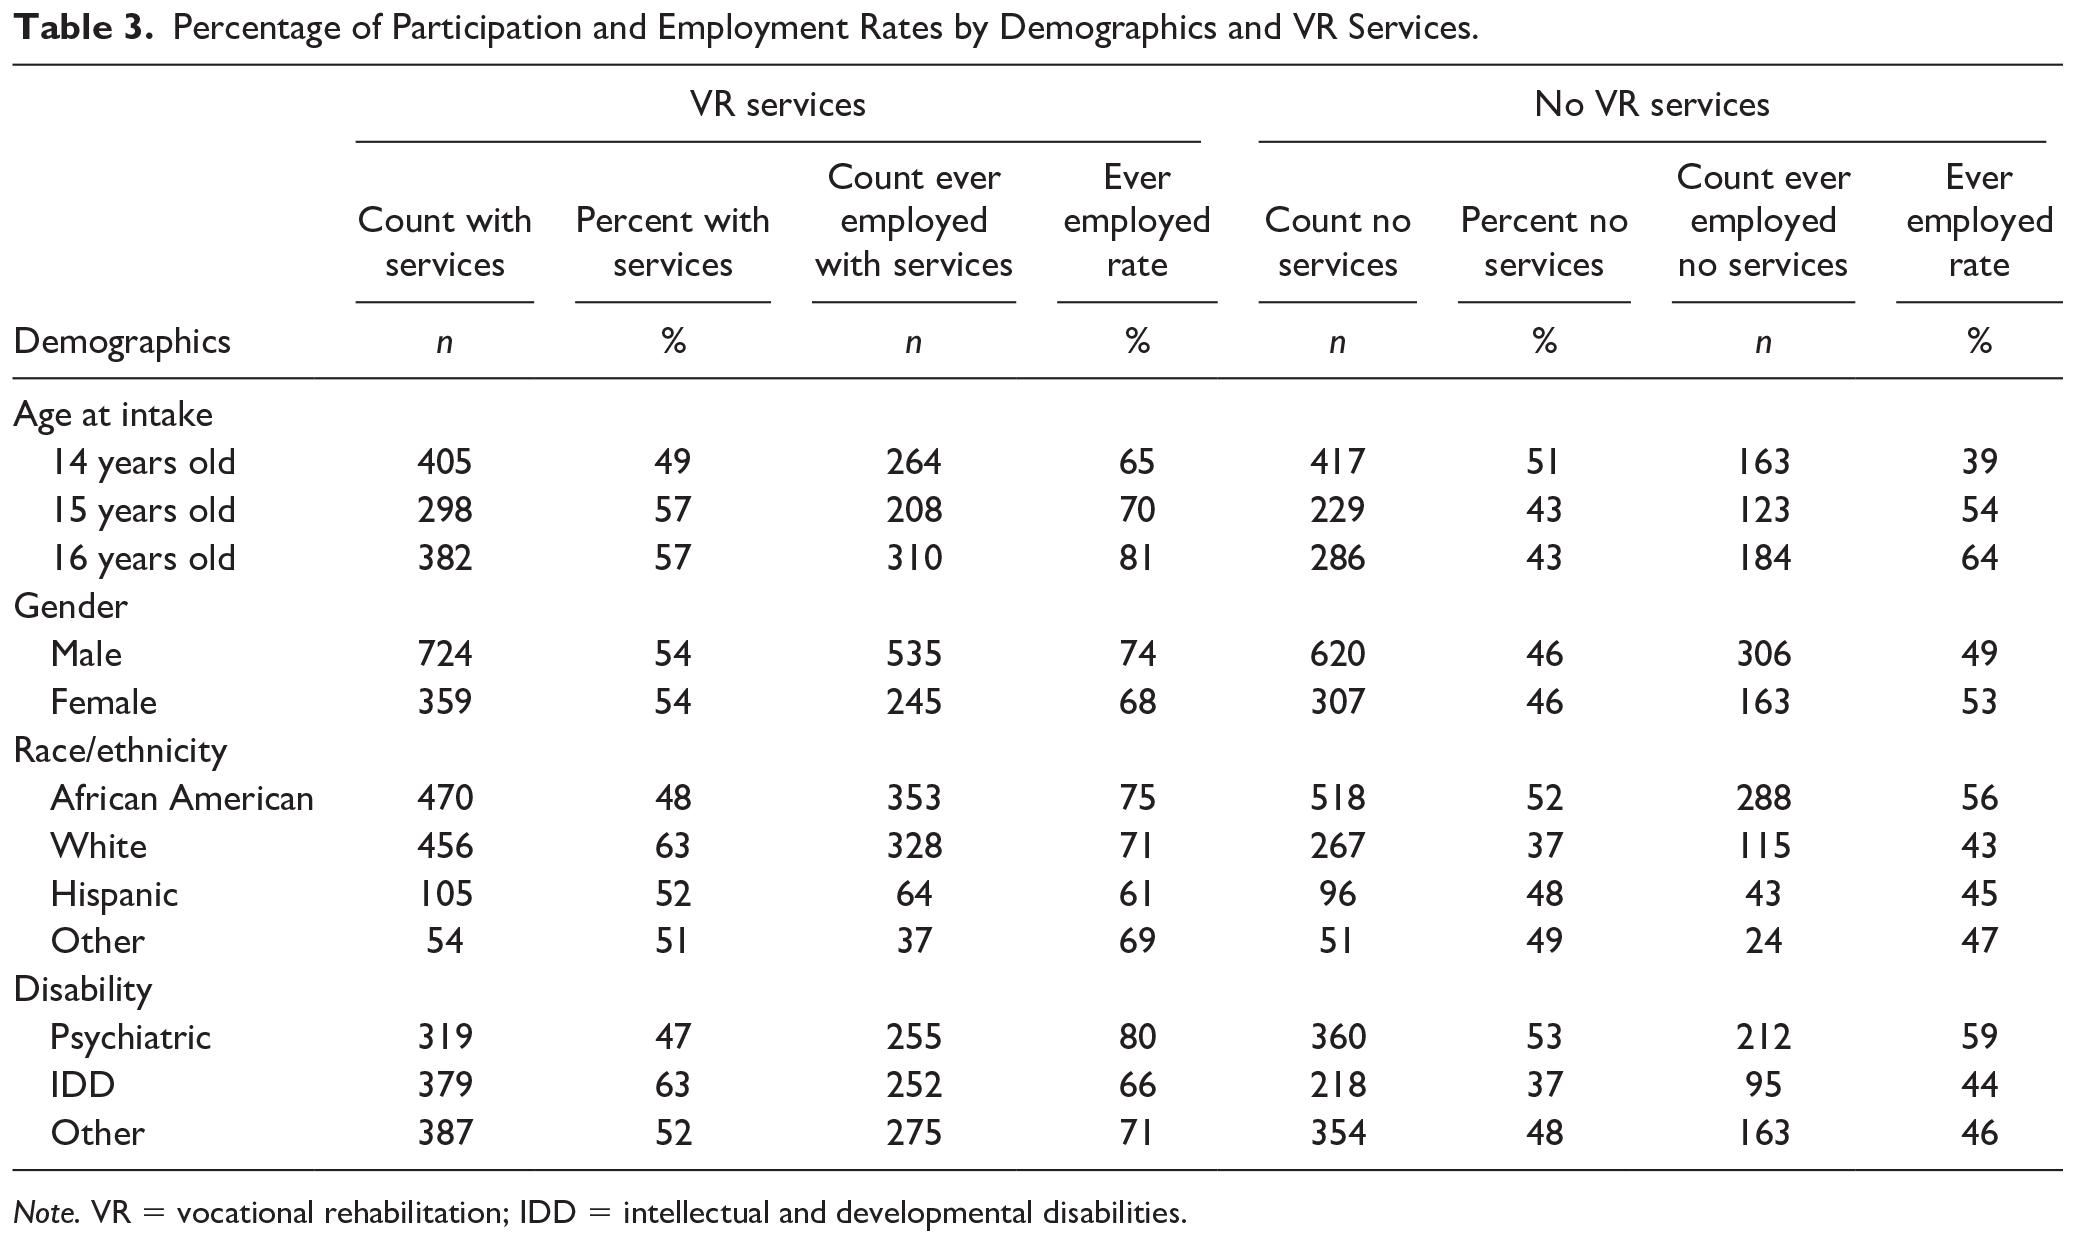
Note. VR = vocational rehabilitation; IDD = intellectual and developmental disabilities.
Percentage of Participation and Employment Rates by Demographics and School IEP Transition Services.
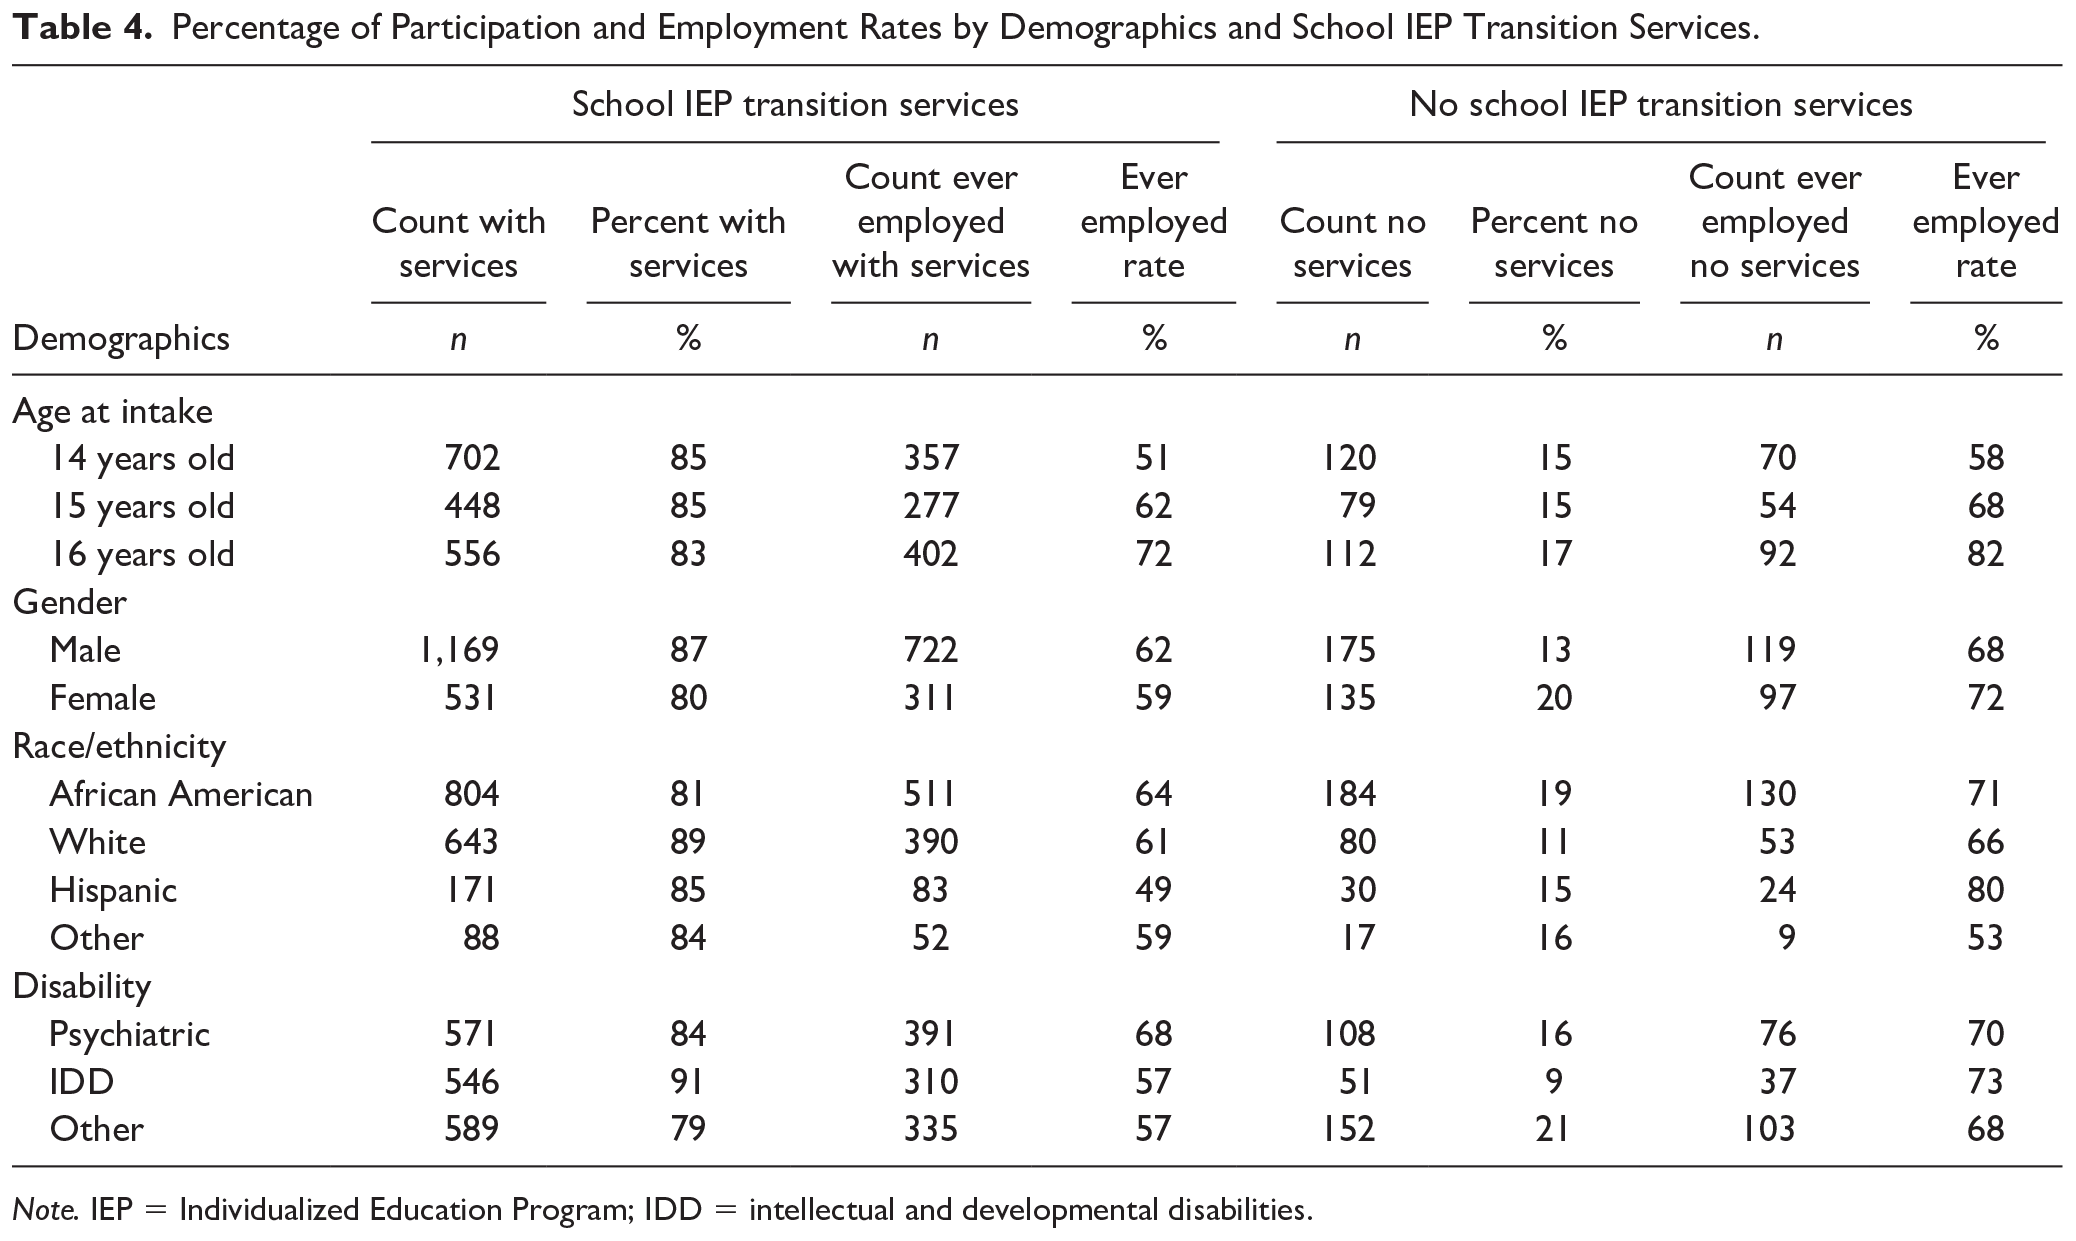
Note. IEP = Individualized Education Program; IDD = intellectual and developmental disabilities.
Youth receiving PROMISE and VR services had higher employment rates than youth who did not receive these services. In contrast, youth receiving school transition services had lower employment rates than youth who did not receive these services. Again, different patterns of these employment rates by transition service receipt varied across demographic groups. In looking at PROMISE youth, employment rates were higher for youth participants by each demographic group at a similar rate for each group (approximately 10 percentage points), although this varied by group. More variation in patterns of employment rates were observed when comparing youth who received VR services and youth who did not. Participation in VR services not only increased employment rates but also reduced differences in employment rates across some demographic groups. Whether receiving VR services or not, older youth still had higher employment rates, but youth who enrolled in PROMISE as young as 14 and had VR services had higher employment rates, reducing the differences with their older counterparts. Similarly, African American youth still had the highest employment rates, but the employment rates of youth in other race and ethnicity groups who received VR services increased to the point that discrepancies between race and ethnicity groups were reduced, especially between African American and White youth.
The relationship between school IEP transition services and employment rates by demographic group reflected patterns fairly consistent with those observed overall. A few notable differences were observed, including the difference in employment rates for Hispanic youth. Hispanic youth without IEP transition services had higher employment rates (80%) than those with an IEP (59%). Interestingly, the opposite pattern was observed for youth who identified in other race categories, with higher employment rates for those with school IEP transition services (59%) compared to those without (53%). However, these differences could be due to chance given the smaller difference and number of youth in these groups. Also, youth with IDD who did not have IEP transition services had higher employment rates (73%). Again, this group was a relatively smaller group of students. Although these differences in participation and employment rates are notable, the subsequent step-by-step HLR provided a mechanism to determine whether differences in employment rates by demographics and transition services were statistically significant.
HLR Analysis
Step 1: Demographic covariates
The omnibus test for the Step 1 model, including demographics (age, gender, race/ethnicity, disability) as predictors and employment rate as the outcome, was found to be statistically significant, χ2(7, N = 2,017) = 111.28, p < .001. The Hosmer–Lemeshow test was not significant, χ2(8, N = 306) = 13.68, p = .09, ns, indicating a good model fit. The Nagelkerke R2 was computed to be .07, indicating a small association between the demographic covariates and the employment outcome variable.
Age
Age was significantly associated with employment, unstandardized beta (β) = 0.504, Wald’s χ2(1, 2,017) = 79.27, p < .001, odds ratio = 1.66 (95% confidence interval [CI] = [1.48, 1.85]). The odds of employment for older students were 1.66 times greater than the odds of employment for younger students. Youth who were 16 years old at enrollment were 1.66 times more likely to have worked than youth who were 15 years old at enrollment. Similarly, youth who were 15 years old at enrollment were 1.66 times more likely to have worked than youth who were 14 years old at enrollment.
Race/ethnicity
Race/ethnicity was significantly associated with employment: Wald’s χ2(3, 2,017) = 10.52, p < .05. There was no significant difference between African American and White students in their odds for employment. However, Hispanic students were less likely to be employed than African American students, β = −0.51, Wald’s χ2(1, 2,017) = 9.78, p < .01, odds ratio = 0.60 (95% CI = [0.44, 0.83]). Compared with African American students, Hispanic students had 40% reduction in odds for employment. To better understand this percent reduction, the reverse odds were calculated by dividing 1 by the odds ratio, 1 / 0.60 = 1.67. African American students had 1.67 times greater odds of employment than Hispanic students.
Types of disability
Type of disability was significantly associated with employment, Wald’s χ2(2, 2,017) = 29.86, p < .001. Students with IDD were less likely to be employed than students with a psychiatric disability, β = −0.52, Wald’s χ2(1, 2,017) = 18.61, p < .001, odds ratio = 0.59 (95% CI = [0.47, 0.75]). Students with IDD had 41% reduction in odds for employment compared with the odds of students with psychiatric disabilities. The reverse odds were calculated by dividing 1 by the odds ratio, 1 / 0.59 = 1.69. Students with psychiatric disabilities had 1.69 times greater odds of employment than students with IDD. Students with other disabilities also had significantly lower odds of employment than students with a psychiatric disability, β = −0.41, Wald’s χ2(1, 2,017) = 12.57, p < .001, odds ratio = 0.67 (95% CI = [0.53, 0.83]). Students with other disabilities had 33% reduction in odds for employment compared with the odds of students with psychiatric disabilities. The reverse odds were calculated by dividing 1 by the odds ratio, 1 / 0.67 = 1.49. Students with psychiatric disabilities had 1.49 times greater odds of employment than students with other disabilities.
Step 2: PROMISE
The omnibus test for the Steps 1 and 2 model, including age, gender, race/ethnicity, disability, and PROMISE services as predictors and employment rate as the outcome, was found to be statistically significant, χ2(8, N = 2,017) = 140.10, p < .001. The Hosmer–Lemeshow test was not significant—χ2(8, N = 2,017) = 6.00, p = .648, ns—indicating a good model fit. The Nagelkerke R2 was computed to be .092, indicating a small association between the demographic covariates, PROMISE services, and the employment outcome variable.
PROMISE services
PROMISE services were significantly associated with employment, β = 0.51, Wald’s χ2(1, 2,017) = 28.49, p < .001, odds ratio = 1.67 (95% CI = [1.38, 2.01]). For students who received PROMISE services, their odds for employment were 1.67 times greater than the odds of employment for students who did not receive PROMISE services. The percent of students in the PROMISE treatment group who worked during the grant period was 67%.
Step 3: VR
The omnibus test for Steps 1, 2, and 3, including age, gender, race/ethnicity, disability, PROMISE, and VR services as predictors and employment rate as the outcome, was found to be statistically significant, χ2(9, N = 2,017) = 220.51, p < .001. The Hosmer–Lemeshow test was not significant—χ2(8, N = 2,017) = 10.14, p = .255, ns—indicating a good model fit. The Nagelkerke R2 was computed to be .14, indicating a robust association between the demographic covariates, PROMISE services, VR services, and the employment outcome variable.
VR services
VR services were significantly associated with employment, β = 0.99, Wald’s χ2(1, 2,017) = 77.73, p < .001, odds ratio = 2.70 (95% CI = [2.17, 3.37]). For students who received VR services, their odds for employment were 2.70 times greater than the odds of employment for students who did not receive VR services. Importantly, it should be noted that in the presence of VR services, PROMISE transition services were no longer statistically significant. It is likely the effect of PROMISE services on employment is accounted for by VR services.
Race
Also notable, when VR services were added to the model, the difference in employment rates between African American and White youth became statistically significant. White students were less likely to be employed than African American students, β = −0.30, Wald’s χ2(1, 2,017) = 7.59, p < .05, odds ratio = 0.74 (95% CI = [0.60, 0.92]). Compared with African American students, White students had 26% reduction in odds for employment. The reverse odds were calculated by dividing 1 by the odds ratio, 1 / 0.74 = 1.35. African American students had 1.35 times greater odds of employment than White students.
Step 4: IEP PTP
The omnibus test for the final model, including age, gender, race/ethnicity, disability, PROMISE, VR, and school IEP transition services as predictors and employment rate as the outcome, was found to be statistically significant, χ2(10, N = 2,017) = 235.725, p < .001. The Hosmer–Lemeshow test was not significant—χ2(8, N = 2,017) = 4.739, p = .785, ns—indicating a good model fit. The Nagelkerke R2 was computed to be .151, indicating a robust association between the demographic covariates, PROMISE services, VR services, school IEP PTP services, and employment rates.
School IEP transition services
Students who had IEP transition services were less likely to be employed than students without an IEP, β = −0.57, Wald’s χ2(1, 2,017) = 14.64, p < .001, odds ratio = 0.57 (95% CI = [0.43, 0.76]). Compared to students without an IEP, students with an IEP had a 43% reduction in odds for employment. The reverse odds were calculated by dividing 1 by the odds ratio, 1 / 0.57 = 1.75. Students without an IEP had 1.75 times greater odds of employment than students with an IEP. Along with the negative association with school IEP transition services, age, race (identifying as African American), disability (psychiatric), and VR services continued to have a statistically significant positive association with employment rates in this final predictive model. Table 5 provides a listing of all the HLR results by each hierarchical step.
Hierarchical Logistic Regression Prediction of Employment Rates (N = 2,017).
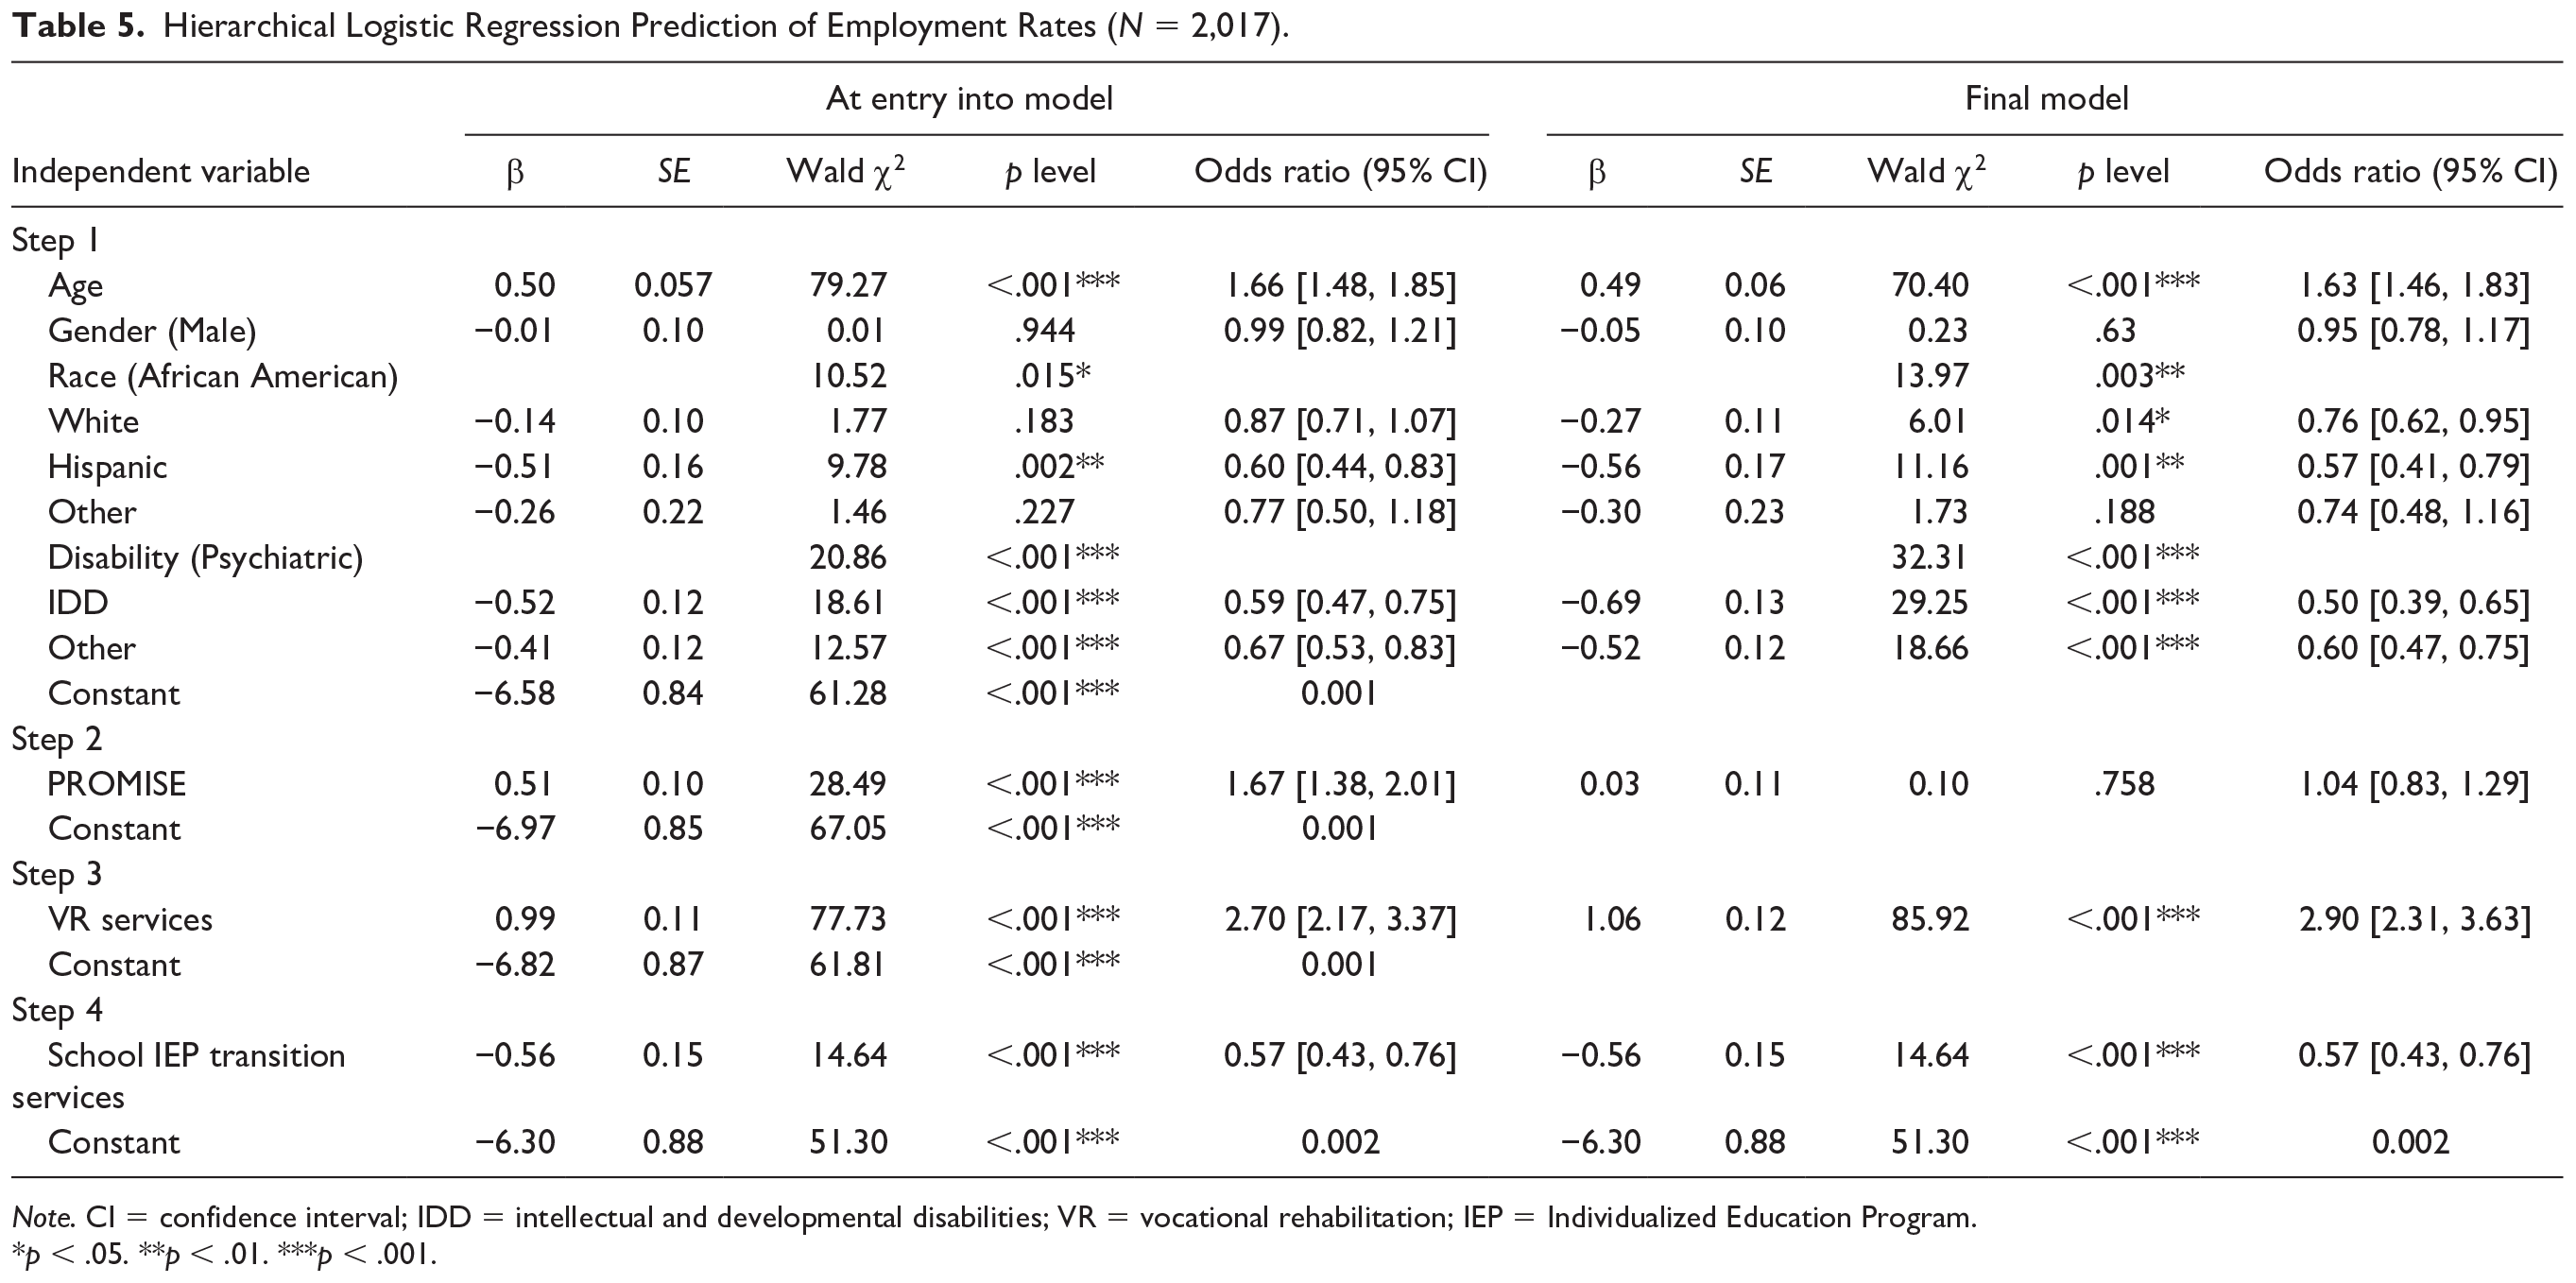
Note. CI = confidence interval; IDD = intellectual and developmental disabilities; VR = vocational rehabilitation; IEP = Individualized Education Program.
p < .05. **p < .01. ***p < .001.
Chi-Square Analysis of VR Services and Race
A subsequent chi-square analysis between VR services and race was conducted to better understand why the association between race and the employment outcome (comparing African American and White youth employment rates) became statistically significant when VR services were added to the HLR. The hypothesis was that employment rates of African American youth were higher than White youth. However, White youth had higher rates of VR participation, and VR participation was associated with better employment outcomes. VR services were a suppressor variable. Once VR services were added to the HLR model, demographic employment differences were disentangled from VR service influence. The chi-square analysis controlled for the effect of VR services by holding VR services constant to compare African American and White students’ employment rates directly. The chi-square analysis showed statistically significant higher employment rates for African American students compared with White students (χ2 = 11.07, p < .001). When controlling for VR services, employment rates of African American youth were estimated to be 72% compared with 60% for White youth.
Discussion
PROMISE aimed to increase education and employment outcomes of transition-age youth with disabilities receiving SSI benefits. The PROMISE demonstration focused on providing employment services and supports and ensuring youth participants had at least one, preferably two, paid competitive integrated employment experiences during high school. Equally important was connecting youth with transition services available through school and VR. This study investigated the relationship between demographics, PROMISE services, VR services, school IEP transition services, and employment rates of transition-age youth receiving SSI.
Consistent with previous research, this study showed a strong relationship between VR services and employment rates (Kaya et al., 2016; Rumrill et al., 2017). This may be because of VR’s emphasis on providing consumers with paid work experiences, and the consistent relationship of paid work experiences during high school predicting higher adult employment rates (Test et al., 2009; Wehman et al., 2015). In the HLR model, the correlation between PROMISE services and employment rates was likely due to the fact that more youth in the PROMISE treatment group received VR services. This may be because Wisconsin PROMISE utilized Wisconsin VR services as a mechanism to provide PROMISE participants with paid work experiences.
That said, other PROMISE models provided paid work experiences outside of their state VR system. This was especially true in states that had a waiting list for VR services. Instead, PROMISE programs in these states provided paid work experiences through a variety of other ways such as through school transition services, PROMISE-funded summer work programs, community providers, mental health service systems, and through case management linking youth to available employment and training programs (Mamun et al., 2019). Even when PROMISE programs did not connect all their youth to VR services, youth still had an increased employment rate compared with those in the control group (Mamun et al., 2019). Therefore, increased employment rates may not depend on receiving VR services, but VR services can provide a mechanism to provide employment and training services that lead to increased employment rates.
In Wisconsin, the relationship between VR services and higher employment outcomes may have been influenced by the implementation of PROMISE services within the VR system. PROMISE services began in 2014 at the same time when Wisconsin VR started to implement WIOA-mandated pre-employment transition services. Wisconsin VR administrators and staff used the PROMISE model to help develop and implement pre-employment transition services in Wisconsin (Hartman et al., 2019). Therefore, PROMISE service implementation could have included a carryover effect that influenced the employment rates of control youth who received VR services (Selekman et al., 2018).
Wisconsin PROMISE included high rates of African American and Hispanic youth participation. According to the 2010 Census, 83% of people in Wisconsin are White, 6% African American, and 6% Hispanic. In contrast, 36% of youth enrolled in Wisconsin PROMISE were White, 49% African American, and 10% Hispanic (Hartman et al., 2019). All three race and ethnicity groups had higher employment rates when they were in the PROMISE treatment group compared with those in the control groups. These higher employment rates were statistically significant for youth participating in VR services. African American youth with VR services had employment rates 19 percentage points higher than those who did not receive VR services; for White youth, the difference was 28 percentage points, and for Hispanic youth 16 percentage points.
Of interest is the fact that initial comparison between African American and White youth employment rates was not statistically significant until VR services were added to the model. In other words, employment rates of youth receiving SSI may be suppressed when youth are not connecting to VR services. Therefore, it is important to better connect all youth receiving SSI to VR services, with specific emphasis to ensure African American youth are connecting to these services. Given the lower employment rates of Hispanic youth, it is also important to ensure Hispanic youth are connecting to VR services, especially given employment rates of Hispanic youth were also higher when receiving VR services.
Even as youth who received PROMISE and VR services experienced higher employment rates, youth with school IEP transition services had statistically significant lower employment rates. First, it is important to note that most youth had school IEP transition services, and only a small group of youth (15%) did not have an IEP. Youth would not have an IEP if their disability did not influence their performance in school. Also, youth who did not attend public school, possibly due to attending a private school or being homeschooled, would not have an IEP. Youth who need an IEP to aid in their education may have also experienced barriers to employment, whereas youth who were successful in school without a need for an IEP may, in turn, also have had more success finding employment. In fact, youth with an IEP tend to struggle more academically and are less likely to engage in high school work activities or postsecondary education (Lipscomb et al., 2018). Somewhat aligned with this hypothesis is that youth with IDD, which one may assume may have more support needs, were also more likely to have an IEP. Of PROMISE youth with IDD, 91% received IEP transition services compared with 84% of youth who reported a psychiatric disability and 79% of youth who reported another disability.
Despite poorer employment outcomes, there are a variety of strategies that can help improve the outcomes of students with more significant disabilities. These strategies include community-based employment programs that include school and VR partnerships, individualized-customized supports, data-based decision-making (Choiseul-Praslin & McConnell, 2020), IPS employment services (Noel et al., 2018), customized employment (Riesen et al., 2015), and programs that provide internship and apprenticeship opportunities for youth with disabilities, such as Project SEARCH (Schall et al., 2020) and Wisconsin’s previous Let’s Get to Work grant that aimed to improve the employment rates of youth with IDD. Employment rates increased when schools implemented evidence-based transition services (Molfenter, Hartman, Neugart, et al., 2017).
Limitations and Future Research
Several limitations of this study are important to note. Some youth were still in high school, and among the high school completers, all were still in the early stages of employment, so outcomes may not have been fully realized. Future research should look at long-term impacts of services and supports on both education and employment outcomes (Trainor et al., 2019).
In addition, findings may be region specific, as school and VR services vary state by state and region by region. In fact, another recent study looked at the relationship between VR services and employment rates and found different trends by demographic group (Awsumb et al., 2020). Awsumb and colleagues (2020) looked at another Midwestern VR, specifically participation for youth in an urban school district, and found employment outcomes were worse for females, African American students, and youth with psychiatric disabilities, whereas Hispanic youth and youth with IDD had better employment outcomes. These results contrast with the results in the current study and may be explained by regional differences or due to differences in study design.
Awsumb et al. (2020) aimed to understand transition services as they were, whereas PROMISE treatment aimed to change and improve transition service access and implementation. Awsumb and colleagues (2020) reported youth struggled to navigate the VR system and some youth struggled to access supports and employment outcomes with the existing service system, and recommended family supports and service coordination to help navigate the system. In contrast, Wisconsin PROMISE specifically aimed to connect youth to VR services. The PROMISE case management system was built with an emphasis on family supports, which may have helped remove existing barriers, at least for youth in the Wisconsin PROMISE treatment group. Population differences may also explain the different results between the Awsumb et al. (2020) study and the current study. Youth in Wisconsin PROMISE were all receiving SSI but did not necessarily have an IEP, whereas youth in the Awsumb et al. (2020) study all had an IEP but did not necessarily receive SSI. More research is needed to better understand regional differences and how youth receiving SSI differ from all youth who have an IEP.
Implications for Policy and Practice
School IEP transition services aim to better connect students with disabilities to educational services and improve employment outcomes. WIOA (2014) has added further emphasis on VR programs to also increase credentials that will help transition-age youth achieve higher quality employment outcomes with higher wages. Schools and VR agencies continue to strive to better collaborate and coordinate transition services and supports for all students with disabilities, including students from diverse racial/ethnic and low socioeconomic backgrounds. Schools and VR agencies can work together to better engage diverse communities in transition services and supports to improve postschool outcomes in education and employment. Strengthening connections between youth, families, and service providers support active engagement in the planning process. Student engagement might vary as they mature over time and identify interests, skills, and abilities in alignment with the needs of local employers.
During this collaborative transition planning process, tools like the Transition Services Rating Scale (TSRS) can help teachers and schools ensure that every student with an IEP is connecting to evidence-based transition services (Molfenter, Hartman, Roskowski, et al., 2017). The TSRS tracks evidenced-based transition services based on predictors identified by Test and colleagues (2009), including teaching and incorporating student self-determination, individualized planning and goals, collaboration, inclusion classes and extracurricular activities, community work experiences, postsecondary education goals, and coordination of transition services. This tool helps teachers record and track the collaboration and coordination of services, with a focus on collaborating with the state VR agency. This collaboration can help ensure that students receiving SSI have consistent employment goals across school and VR and connect these students to effective services. PROMISE demonstrated engagement with diverse students receiving SSI through school and VR collaboration can improve active youth engagement in VR services and ultimately improve employment outcomes (Livermore et al., 2020).
Conclusion
As African American, Hispanic, and other individuals of color continue to experience discrepancies in social determinants of health, including in the area of employment (Bartik et al., 2020; Rice et al., 2019), it is important to highlight situations, services, and supports where employment rates for people of color are higher and/or increase through interventions and supports. Youth from a variety of diverse backgrounds, including African American, Hispanic, and White, youth with disabilities, have experiences, strengths, and interests that align with employer workforce needs. Transition services and programs that emphasize evidence-based transition services available through school and VR provide a mechanism to recognize these talents, improve the local workforce, and increase youth independence, community integration, and financial self-sufficiency.
Footnotes
Declaration of Conflicting Interests
The author(s) declared no potential conflicts of interest with respect to the research, authorship, and/or publication of this article.
Funding
The contents of this article were developed under a cooperative agreement with the U.S. Department of Education, Office of Special Education Programs, associated with PROMISE Award H418P140002. Selete Avoke served as the project officer. The views expressed herein do not necessarily represent the positions or policies of the Department of Education, the Wisconsin Department of Workforce Development, the Wisconsin Department of Public Instruction, and their federal or state partners. No official endorsement by the U.S. Department of Education, the Wisconsin Department of Workforce Development, or the Wisconsin Department of Public Instruction of any product, commodity, service, or enterprise mentioned in this publication is intended or should be inferred.