
Abstract
In this study, we focused on N–1 impurities in antisense oligonucleotides. We evaluated their binding affinity to the therapeutic target RNA, which had the complementary sequence to the full-length N-mer desired product (DP), and their ability to recruit ribonuclease H (RNase H) using cell-free in vitro assays. The binding affinity of each N–1-mer to the target RNA was extremely low, with binding constants <1: 100 of that of the DP/RNA duplex. However, the degree of destabilization varied significantly depending on the position of the nucleotide defect within the N–1-mer, with differences of up to 5.1 kcal/mol (a 4,000-fold difference in binding constant). This weak binding capability to the target RNA suggests that the presence of the N–1-mer has little effect on DP activity. This study provides essential information for the dissemination of oligonucleotide therapeutics by providing a basis for considering the effect of N–1-mer impurities.
Introduction
Antisense oligonucleotides (ASOs) are synthesized using solid-phase phosphoramidite chemistry. 1 The process extends nucleotide monomers in the 3′–5′ direction and involves repeating four steps: detritylation of the 5′ end, coupling a phosphoramidite to the 5′-OH, oxidation of the phosphite to phosphate, and capping any unreacted 5′-OH. This process can produce various impurities due to side reactions. Common impurities with high contamination rates include N–1-mer(s) and N+1-mer(s), which are shorter or longer than the intended N-mer desired product (DP). An N–1-mer is missing a nucleotide because of failure in two consecutive reactions: coupling with the amidite monomer and the subsequent capping.2–4 An N+1-mer results from an extra nucleotide being added due to the unexpected release of the trityl group under mildly acidic conditions during coupling. 5 N–1-mers and N+1-mers are not single molecules; they are groups of multiple molecules because some nucleotides in the DP may be missing or added.
Ion-pair reversed-phase liquid chromatography (IPRP-LC) and anion-exchange liquid chromatography (AEX-LC) are standard methods for separating oligonucleotides. However, N–1-mers and N+1-mers are difficult to distinguish because their physicochemical properties are nearly identical to those of the DP. In addition, separating individual oligonucleotides within N–1- and N+1-mers is more challenging, as all oligonucleotides in each group have the same number of nucleotides. Other separation techniques, such as hydrophilic interaction liquid chromatography,6,7 and two-dimensional liquid chromatography combined with IPRP and AEX, have been explored.8,9 However, none have fully separated all individual oligonucleotides within N–1- or N+1-mers in ∼20-mer ASOs. Consequently, the impact of each N–1- or N+1-mer on the therapeutic target RNA, which is complementary to DP, has not yet been confirmed.
Although many studies have investigated the effectiveness of ASO drugs by transfecting cells with synthetic oligonucleotides, the drugs’ effectiveness relies on several factors, including resistance to nucleases, cell membrane permeability, binding affinity to the target sequence of the DP, and the contamination ratio of impurities. As a result, there is no precise assessment of the function of impurities. When each N–1-mer or N+1-mer binds to the therapeutic target sequence, it creates a bulge in the structure. However, the impact of bulge formation on binding stability has only been studied in the central part of the duplex structure,10–22 and the effect of position on affinity has not been thoroughly examined.
In this study, we aimed to identify and analyze each factor affecting ASO function. We used a simple cell-free in vitro model system to thoroughly examine how each sequence in N–1-mers interacts with RNA complementary to DP. Because the function of ASOs heavily depends on their binding affinity to the therapeutic target RNA, we conducted a thermodynamic analysis of binding and quantified the binding affinity.
Materials and Methods
Oligonucleotide sequences
The oligonucleotide sequences listed in Table 1 and the RNA oligonucleotide 5′-GGUGCGAAGCAGACUGAGGC-3′, which is complementary to the DP, were used in this study. The RNA oligonucleotide, purified by reversed-phase high-performance liquid chromatography (HPLC), was purchased from Fasmac (Kanagawa, Japan). The oligonucleotides shown in Table 1 as DP and N–1-mer models were synthesized by us using solid-phase phosphoramidite chemistry. Purification was performed with IPRP-HPLC, and the target product was fractionated (Supplementary Fig. S1). Oligonucleotides corresponding to the DP and N–1-mers contained the modified nucleotides shown in Figure 1. All phosphate groups in the oligonucleotides were modified with phosphorothioate. The sugar moiety of five nucleotides at both the 5′ and 3′ ends was 2′-O-methoxyethyl (2′-MOE). For cytosine and uracil, the C5 atom of the base was methylated in all cases (5-Me-C and 5-Me-U, respectively). Seventeen oligonucleotides were synthesized with a single nucleotide deletion from DP as the N–1-mer model. The sequence missing the first base from the 5′ end was designated N–1 (1), and the others were designed similarly. For N–1 (19/20), the 19th and 20th nucleotides from the 5′ end have the same structure, so N–1 with either the 19th or 20th nucleotide missing is the same. N–1 (2/3) and N–1 (13/14) were named similarly.
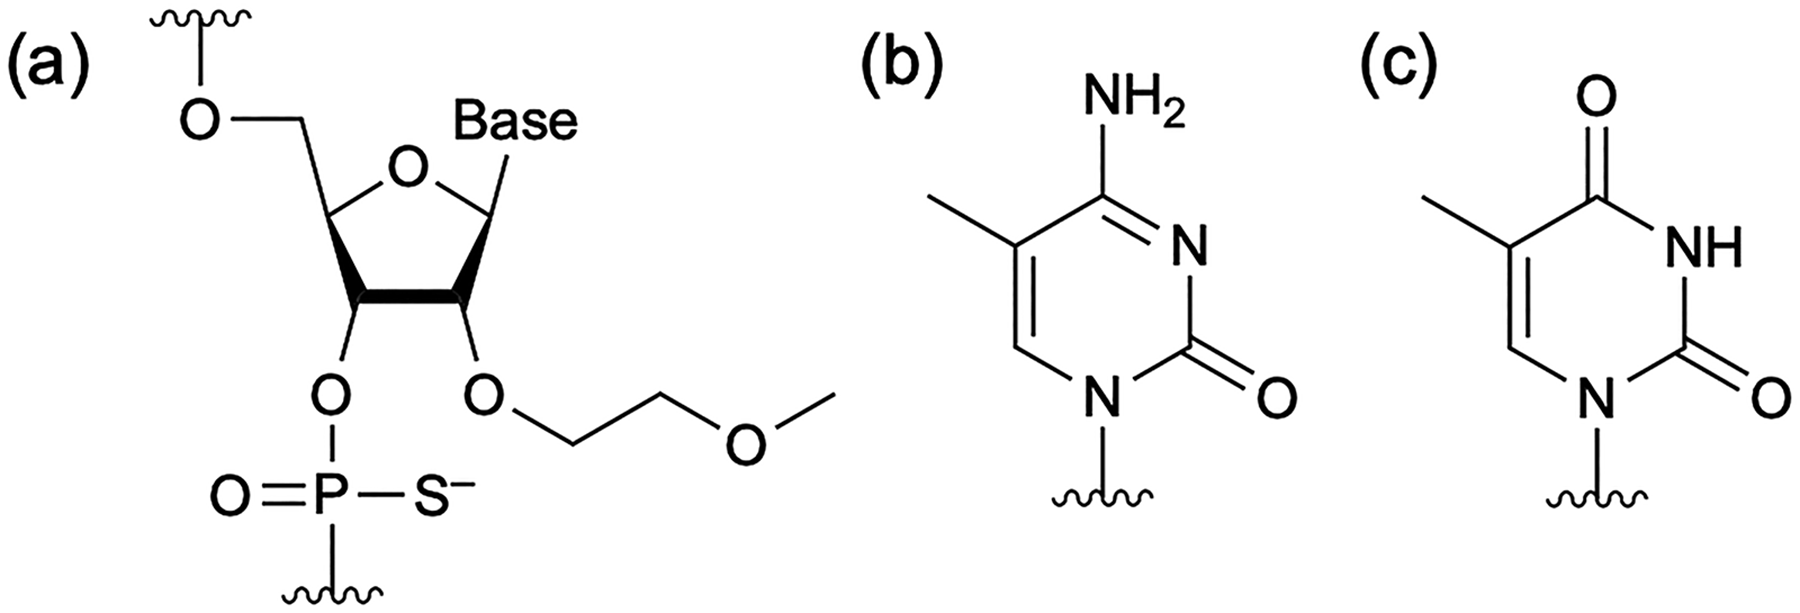
Structure of modified nucleic acids used in this study.
Oligonucleotides Used in This Study
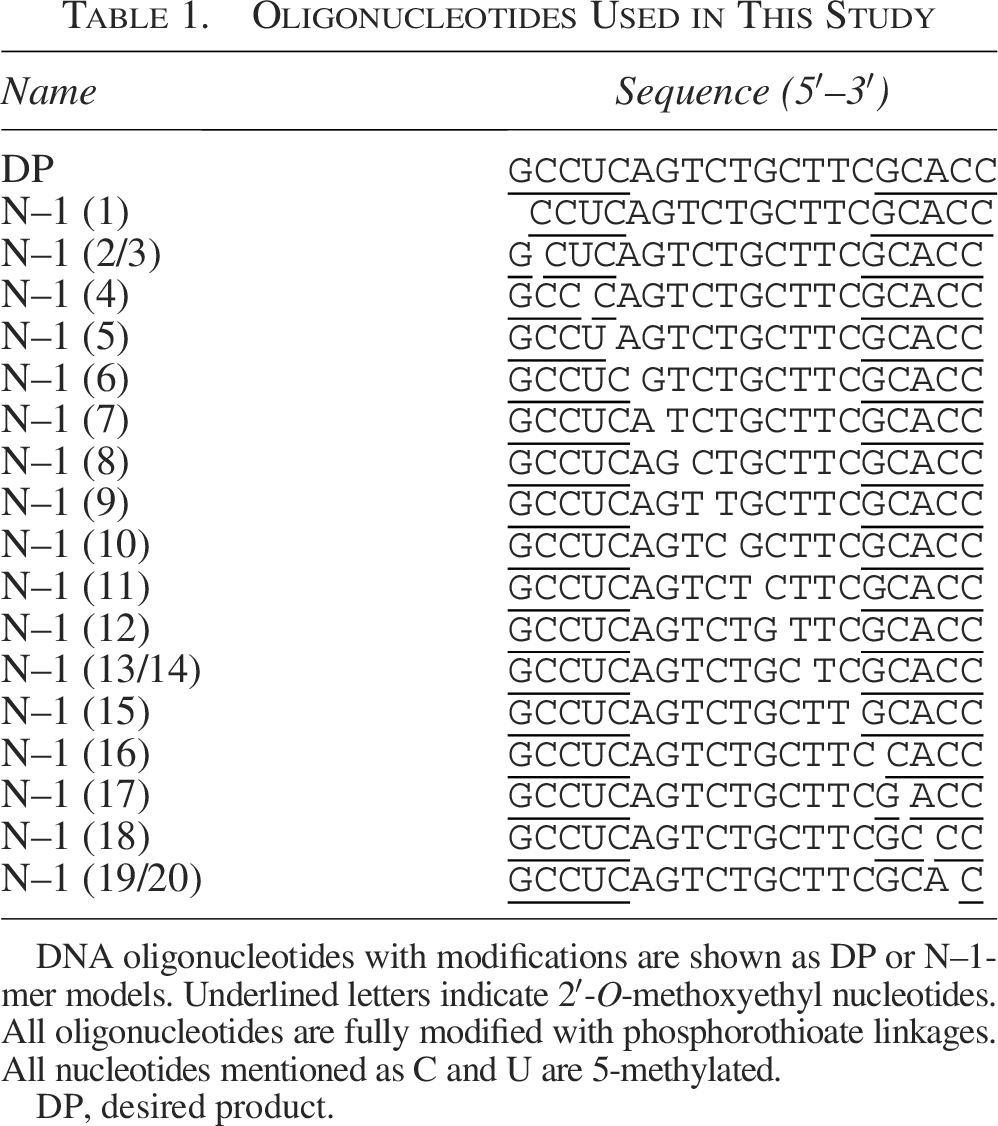
DNA oligonucleotides with modifications are shown as DP or N–1-mer models. Underlined letters indicate 2′-O-methoxyethyl nucleotides. All oligonucleotides are fully modified with phosphorothioate linkages. All nucleotides mentioned as C and U are 5-methylated.
DP, desired product.
Dialysis of oligonucleotides
All oligonucleotides were desalted using a PlusOne Mini Dialysis Kit (Cytiva, Tokyo, Japan) with pure water as the external solution. Dialysis was carried out by placing ∼200 µL of the oligonucleotide solution into a dialysis tube and dialyzing against 1 L of pure water. Up to 16 tubes were floated simultaneously in 1 L of water. Desalination was achieved by placing the beaker on a magnetic stirrer and continuously circulating the external solution. The outer solution was replaced after about 24 h, and this process was repeated twice. All procedures were conducted at 4°C.
Determination of oligonucleotide concentrations
The solution for all measurements was prepared by adding concentrated phosphate buffer to desalted oligonucleotides to achieve a final concentration of 10 mM phosphate (pH 7.0), 1 mM ethylenediaminetetraacetic acid (EDTA), and 100 mM NaCl. The final Na+ concentration was 119 mM, measured using a LAQUAtwin device (HORIBA, Kyoto, Japan). The absorbance at 260 nm from 20°C to 90°C was measured to determine the temperature dependence of UV absorption (UV melting curve) based on the hyperchromicity associated with DNA double-strand melting. For RNA oligonucleotides, the single-stranded state in the higher temperature range was approximated by a straight line, and the value at 25°C was used. For oligonucleotides containing modified nucleic acids, the change in absorbance from 240 to 340 nm at 25°C was measured. The absorbance at 340 nm was normalized to zero to obtain the absorbance at 260 nm at 25°C. The concentration of each oligonucleotide was calculated from the measured absorbance and the molar absorption coefficient (ε260). The ε260 was calculated for each sequence using the nearest-neighbor base pairing method.23,24 Because the ε260 of oligonucleotides with modified nucleotides was uncertain, concentrations of the modified oligonucleotides were determined based on RNA concentration. Solutions with various mixing ratios of RNA and modified oligonucleotides were analyzed via polyacrylamide gel electrophoresis. Based on the gel image, the modified oligonucleotide concentration was determined from the mixing ratio at which the single-stranded RNA band disappeared.
Thermodynamic analysis from the UV melting curve
The same amounts of RNA and DP/N–1-mer dissolved in phosphate buffer (10 mM phosphate [pH 7.0], 1 mM EDTA, 100 mM NaCl) were mixed to reach a total oligonucleotide strand concentration (Ct) of 2.5 µM. The solution was heated at 80°C for 5 min, then cooled to 25°C at a rate of –1.0°C/min for annealing. UV melting curves were recorded using a UV-1800 Spectrophotometer (Shimadzu, Kyoto, Japan) with a Peltier temperature controller (TMSPC-8). After 300 s of incubation at 20°C, absorbance at 260 nm was measured during a temperature increase from 20°C to 90°C at 0.5°C/min. The temperature was then held for 60 s, followed by cooling at –0.5°C/min back to 20°C.
For absorbance measurements, an eight-series microcell with a 1 cm optical path length was used. The top of the quartz cell was sealed with sealing tape to prevent concentration heterogeneity caused by evaporation of the sample solution. The solution temperature in the quartz cell was measured with thermocouples. A temperature correction was applied to the obtained melting curve, and the resulting data were used for thermodynamic analysis. The Gibbs energy at 37°C (ΔG°37) and melting temperature (Tm) were calculated through curve fitting of the melting curve obtained by heating from 20°C to 90°C.25,26 Tm is the temperature at which half of the duplex dissociates into single strands, and the value at a Ct = 2.5 µM was calculated. The fraction of double-strand formation was determined from the absorbance at each temperature, and van’t Hoff plot analysis was performed. The average ΔG°37 and Tm values from curve fitting and van’t Hoff plot analyses served as thermodynamic parameters. The degree of destabilization of the N–1-mer relative to the DP was evaluated using the following equation:

Results
Thermodynamic parameters obtained from the UV melting curves
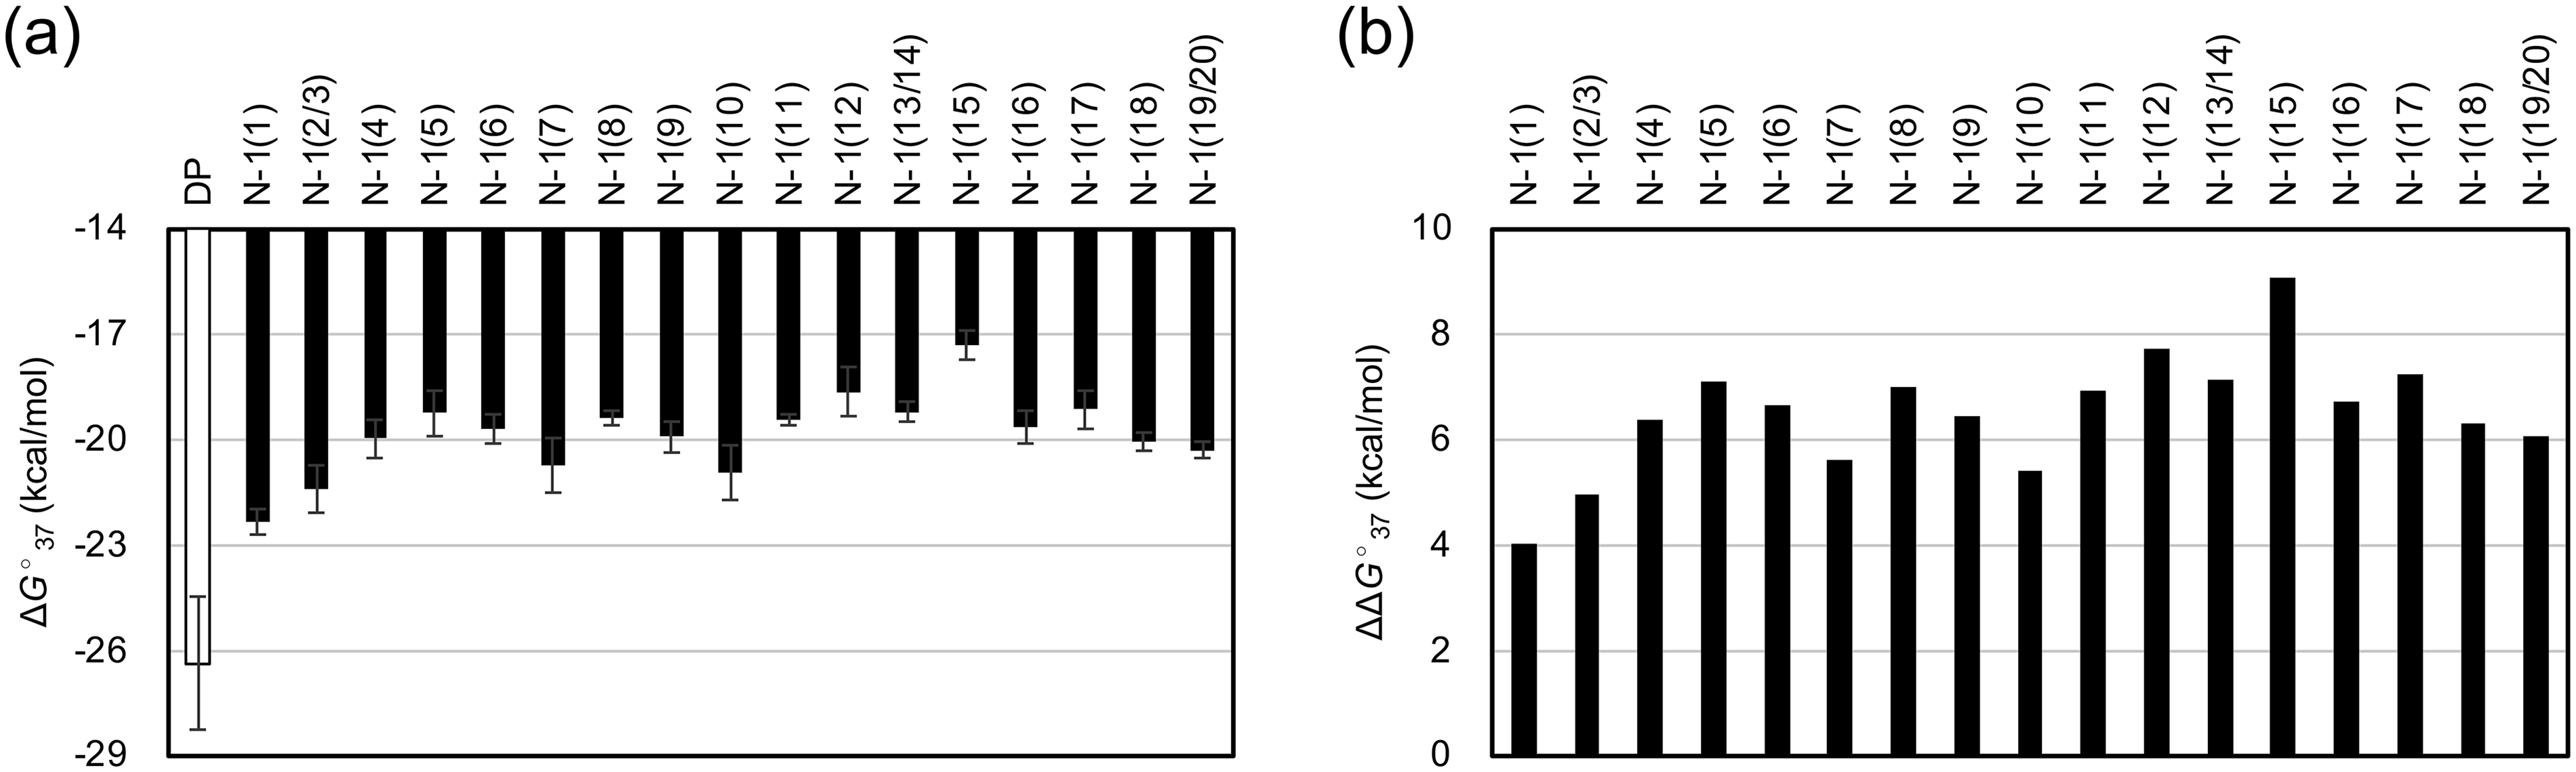
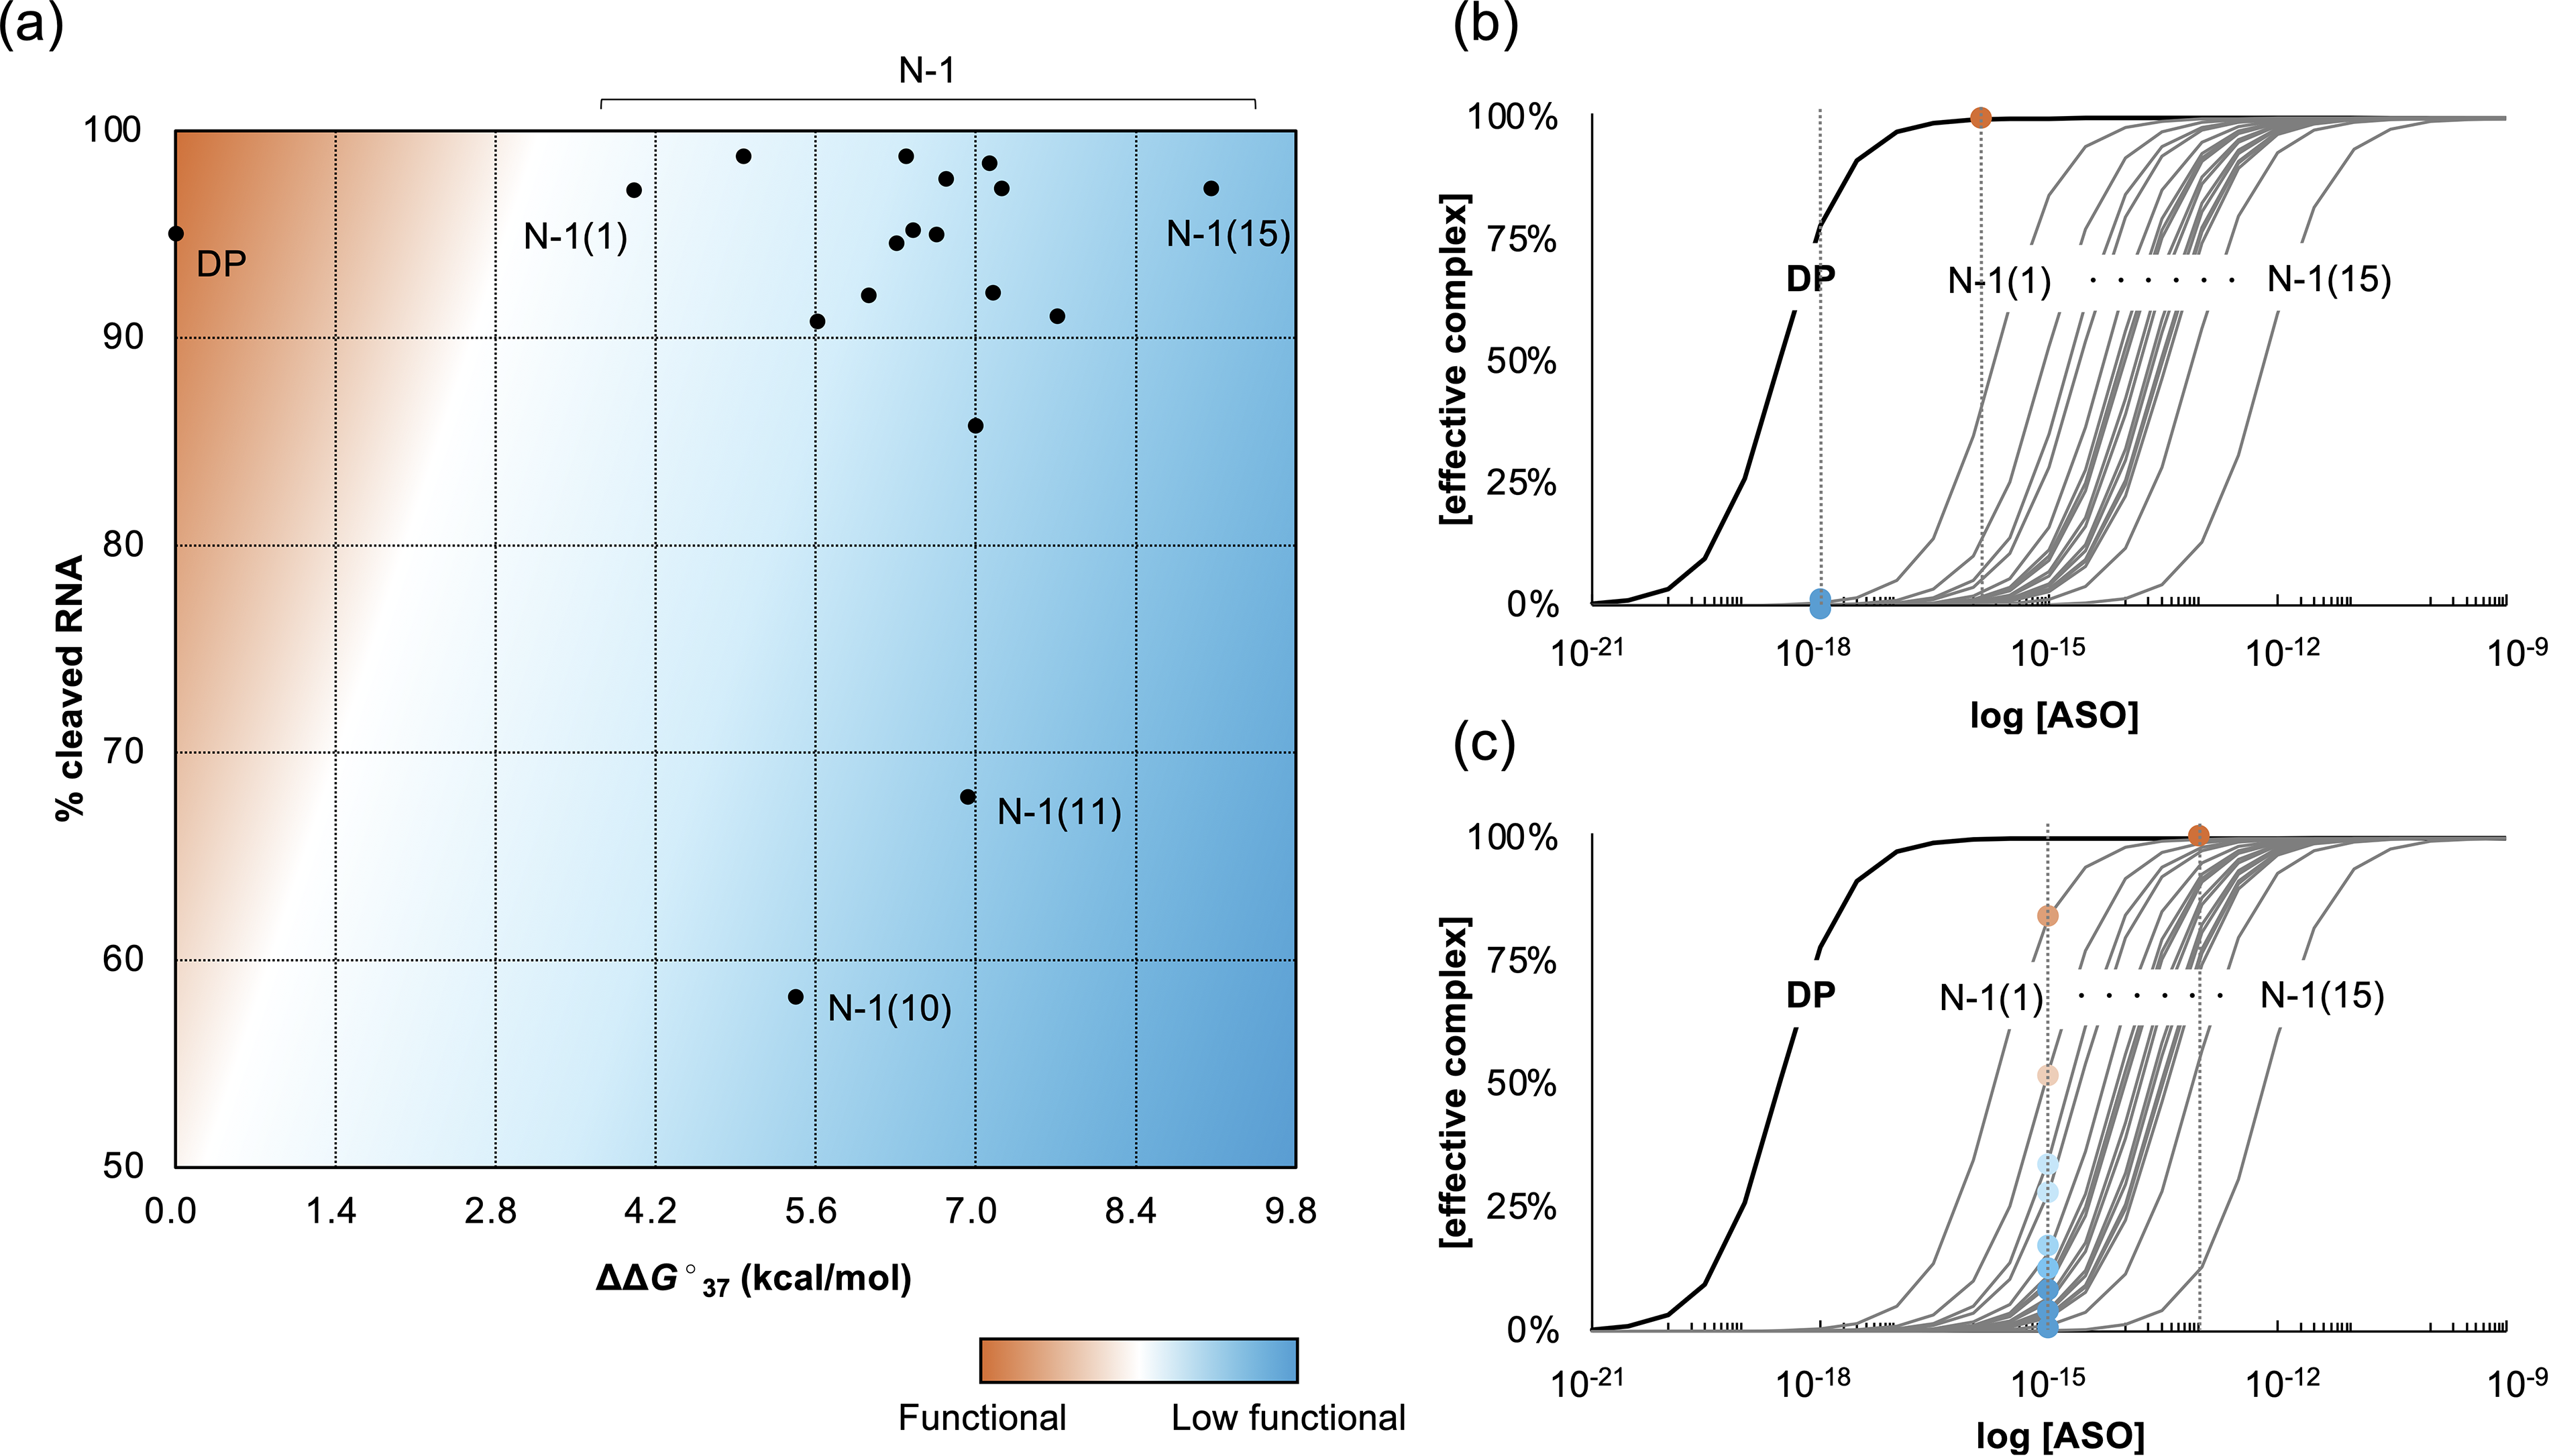
We obtained UV melting curves for the dissociation of the complementary RNA and DP/N–1-mer duplexes, along with thermodynamic parameters from curve fitting and van’t Hoff plot analyses. The average values of ΔG°37 and Tm derived from both methods, the binding constant K calculated from ΔG°37, and the ratio of K for DP and N–1-mers are listed in Table 2. The values of ΔG°37, ΔΔG°37, and Tm are shown in Figure 2 and Supplementary Figure S2. For N–1-mers excluding DP, ΔG°37 ranged from −26.4 to −17.3 kcal/mol and Tm ranged from 64.1 to 74.1°C. For each N–1-mer, the standard deviations for ΔG°37 and Tm in at least three measurements ranged from ± 0.2 to 1.9 kcal/mol and ± 0.1 to 1.3°C, respectively. The ΔG°37 absolute value for all N–1-mers was smaller than that of the DP, indicating that N–1-mers had lower binding affinities than the DP. To assess the destabilization of N–1-mers, ΔΔG°37 was calculated as ΔG°37 (N–1-mer) minus ΔG°37 (DP). A higher positive ΔΔG°37 indicates greater destabilization compared with the DP. The average ΔΔG°37 was 6.5 kcal/mol. In addition, the ΔG°37 values were converted to binding constants K, and the ratio KN–1/KDP was used to compare the instability of N–1-mers with that of the DP. The least destabilized N–1-mer was N–1 (1), lacking the 5′-terminal base, with a ΔΔG°37 of 4.0 kcal/mol and a KN–1/KDP ratio of 1/(6.6 × 102). Conversely, the most unstable was N–1 (15), missing the 15th base from the 5′ end, with a ΔΔG°37 of 9.1 kcal/mol and a ratio of 1/(2.4 × 106). The destabilization of N–1-mers varied by up to 5.1 kcal/mol (equivalent to about 4,000-fold in binding constant), depending on the position of the nucleotide deletion. All N–1-mers exhibited more than two orders of magnitude lower binding affinity than the DP.
Thermodynamic Parameters of Target RNA Binding
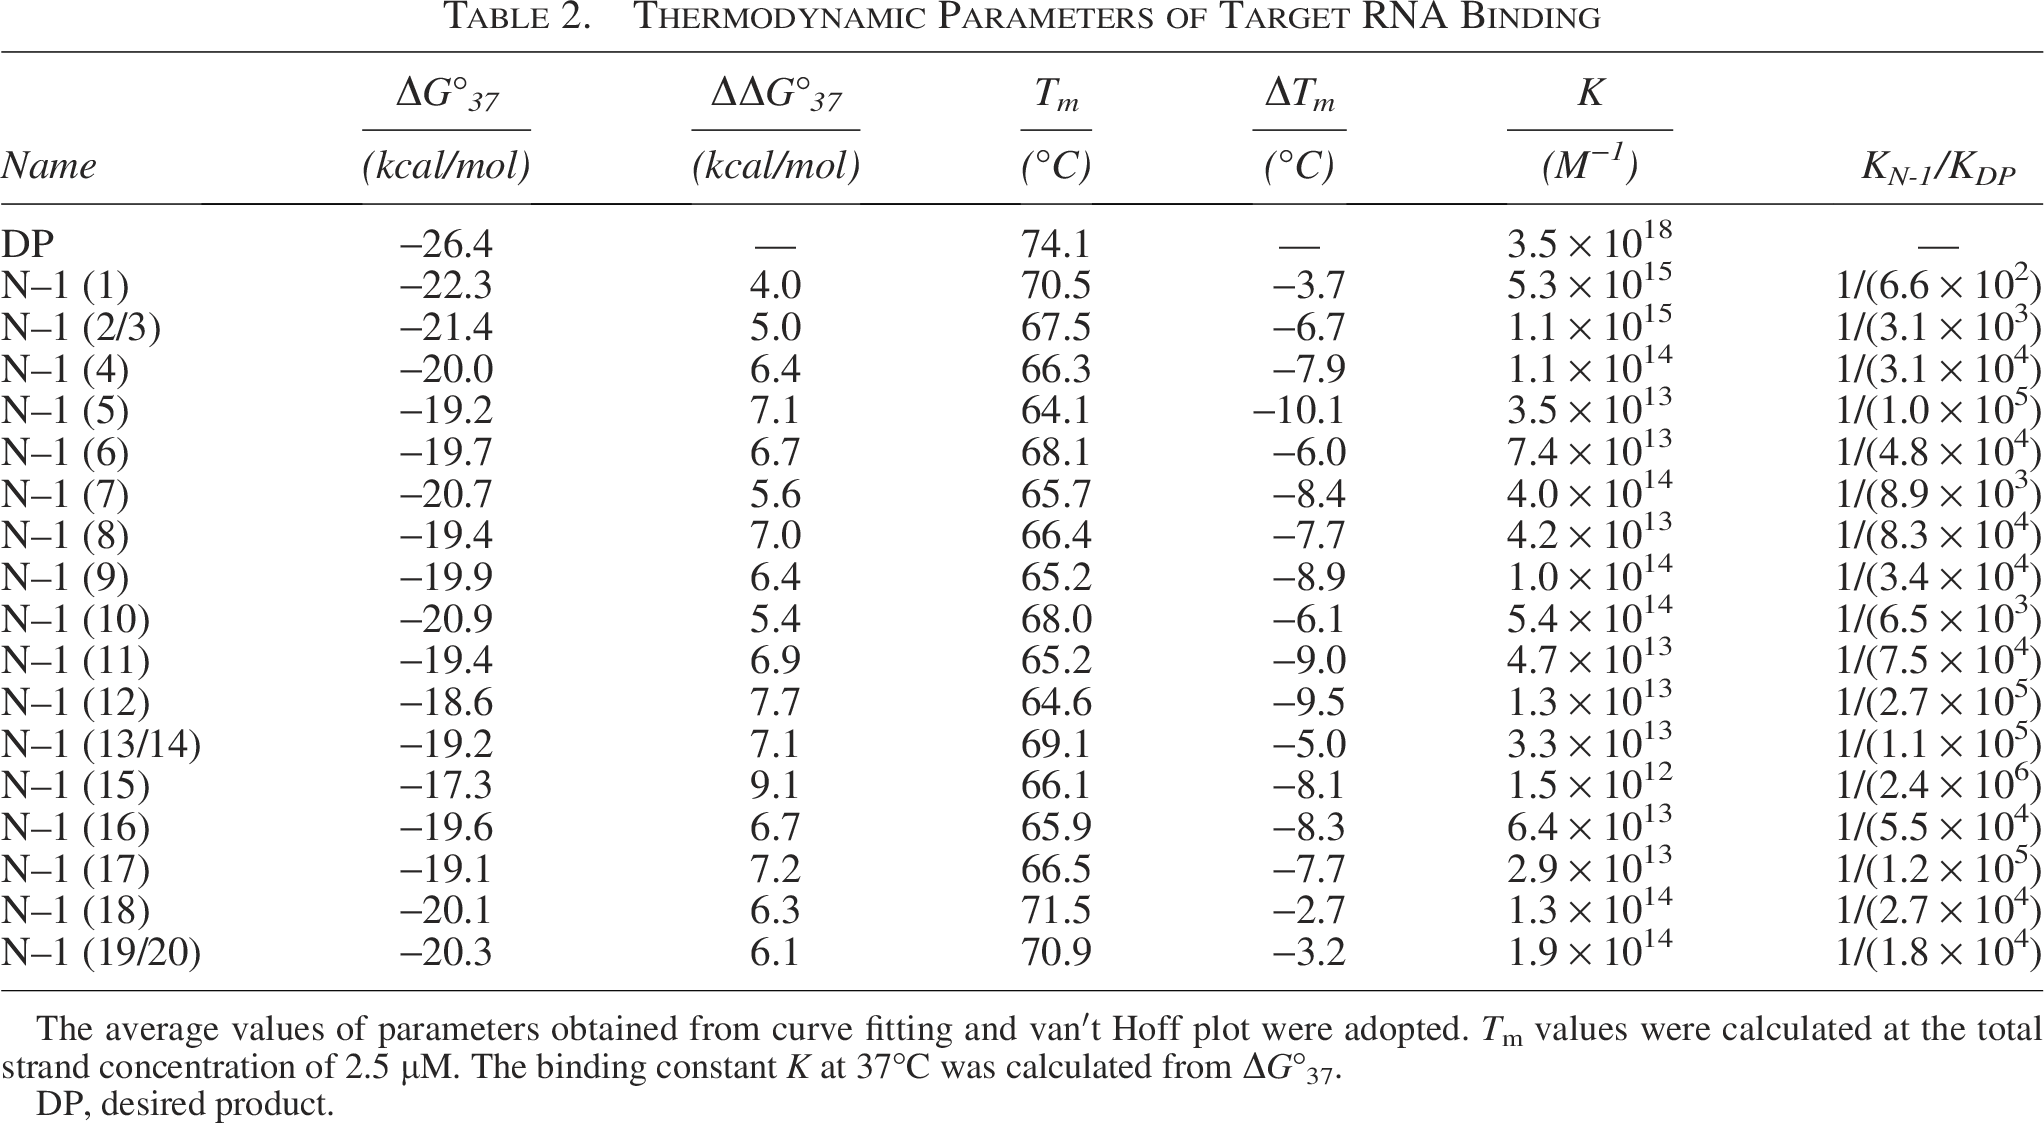
The average values of parameters obtained from curve fitting and van′t Hoff plot were adopted. Tm values were calculated at the total strand concentration of 2.5 µM. The binding constant K at 37°C was calculated from ΔG°37.
DP, desired product.
Target RNA degradation by RNase H
The binding affinity of N–1-mers to the target RNA was much lower compared with that of the DP, although N–1-mers may bind to the target RNA at high concentrations. Regarding the function of N–1-mers, different factors need to be considered for splice-switching ASOs and RNase H-dependent ASOs. When N–1-mers are present at high concentrations, splice-switching ASOs can produce the same drug effect as the DP, where target binding regulates gene expression. However, in RNase H-dependent ASOs, RNase H recognition ability, along with binding affinity, must be considered to assess their effectiveness. Therefore, we examined whether RNase H recognizes and cleaves N–1-mer/RNA duplexes. From the binding affinity measurements, the Tm of all N–1-mer/RNA duplexes was above 60°C at Ct = 0.4 µM. Consequently, we assumed that 100% of N–1-mer/RNA duplexes formed at the RNase H treatment temperature (37°C). The specific RNA cleavage rates and gel images are shown in Supplementary Figures S3 and S4. In all RNase H-treated samples, there was a reduction in duplexes and an increase in single-stranded antisense RNA compared with untreated samples. Many duplexes had cleavage rates above 90%, but for N–1 (10) and N–1 (11), where the nucleotide defect was in the middle of the duplex, the cleavage rate was around 60%. No bands corresponding to single-stranded RNA of pre-degradation length were observed in all RNase H-treated samples, while bands attributed to single-stranded DNA or duplexes were seen.
Discussion
Multiple mechanisms may contribute to the destabilization of duplexes by N–1-mers
The binding affinity of each N–1-mer to the target RNA varied widely among sequences, with a maximum difference of ∼4,000-fold in the binding constants. The duplex composed of the N–1-mer and target RNA is generally considered to form a bulge. Although previous reports have documented destabilization of single bulges in DNA and RNA duplexes, to our knowledge, no prior thermodynamic studies have examined destabilization associated with bulge formation in DNA/RNA heteroduplexes. While earlier results cannot be directly compared due to differing reference definitions and salt concentrations, the destabilization caused by the bulge of (NN)/(N′X′N′) based on (NN)/(N′N′) base pairs is known to be 1.9–4.0 kcal/mol for DNA duplexes10–17 and 2.9–5.0 kcal/mol for RNA duplexes.18–21 The stability in both cases is roughly 1: 30 to 1: 3,000 of that of a fully complementary strand. We then predicted the stability of (NXN)/(N′X′N′) in references18–21 using nearest-neighbor parameters27,28 to evaluate destabilization, applying the same criteria as in our experiments. Based on these predictions, the destabilization caused by the bulge in (NN)/(N′X′N′) was estimated to be ∼1: 300 to 1: 30,000. These results indicate that the extent of destabilization by the bulge can vary by about 100-fold, depending on the nucleotide sequence.
We quantified the destabilization caused by bulge formation under physiological conditions to evaluate its role in biological systems. Many previous studies performed thermodynamic analyses under 1 M NaCl conditions, and few could directly compare numerical values with our results. Zieba et al. estimated the destabilization of DNA double strands caused by bulge formation by comparing the stability of (NN)/(N′X′N′) with that of (NXN)/(N′X′N′) under 100 mM NaCl conditions, similar to our analysis. 22 Since their report shows ΔG° at 20°C, ΔG°20 was converted to ΔG°37 based on the TΔS° value to estimate ΔΔG°37, indicating destabilization by bulge formation, which ranges from 2.3 to 3.1 kcal/mol. Conversely, the destabilization of the bulge in the DNA/RNA heteroduplex under 100 mM NaCl conditions, obtained in this study, was 4.0–9.1 kcal/mol (average, 6.5 kcal/mol) for d(NN)/r(N′X′N′), based on d(NXN)/r(N′X′N′). In other words, the difference between the least and most destabilized cases was 5.1 kcal/mol (corresponding to a 4,000-fold difference in the binding constant). Assuming that the range of destabilization is solely due to differences in sequence, this is an order of magnitude larger than reported elsewhere. In summary, some destabilizing factors cannot be explained by bulge formation alone.
The oligonucleotides examined in this study were extensively modified at nucleotide-deficient positions, where the destabilization of sequences missing the terminal nucleotide was less severe than in others. The N–1 (1) and N–1 (19/20) should not form a bulge, indicating a dangling end structure with the RNA strand extended by a single nucleotide. For these N–1-mers, the loss of stability may result from the absence of single base pairing and the slight stability contribution of dangling ends.29,30 However, compared with the nearest-neighbor parameters proposed by Kierzek et al. 31 and Banerjee et al., 32 the ΔG°37 difference between 2′-OMe(5′-GC-3′)/r(5′-GC-3′) and d(5′-GC-3′)/r(5′-GC-3′) (N–1 (1) case) and between 2′-OMe(5′-CC-3′)/r(5′-GG-3′) and d(5′-CC-3′)/r(5′-GG-3′) (N–1 (19/20) case) is nearly –1.0 kcal/mol in both cases, showing that the 2′-OMe/RNA base pair is more stable than the natural DNA/RNA pair. The missing terminal base pair in our case is 2′-MOE/RNA. Although the nearest-neighbor parameters for 2′-MOE/RNA base pairs have not been reported, they are known to confer almost the same stabilizing effect as 2′-OMe/RNA.33–36 Consequently, there may be a more significant stability loss in this case than in natural DNA/RNA. The ΔΔG°37 of N–1 (2/3) is 5.0 kcal/mol, which is 1.0 kcal/mol higher than that of N–1 (1), indicating a greater destabilizing effect. Interestingly, the ΔΔG°37 of N–1 (4) and N–1 (5) are 6.4 and 7.1 kcal/mol, respectively, indicating increased destabilization as the nucleotide loss shifts from the end toward the center. Similar patterns were observed for the 3′-terminal defects, with ΔΔG°37 values of 6.1, 6.3, and 7.2 kcal/mol for N–1 (19/20), N–1 (18), and N–1 (17), respectively. The change in binding affinity caused by shifting one defective position closer to the center can be described as a roughly 10-fold decrease in the binding constant at both the 5′ and 3′ ends for several bases from the termini. For example, in N–1 (2/3), although the 5′ end of the bulging base might form one or two base pairs, it is unlikely to form stable pairs at 37°C and would likely fray. Similarly, N–1 (4), N–1 (5), N–1 (17), and N–1 (18) may not pair from the bulging base to the end, causing some bases to fray. Therefore, we can infer that gradual destabilization from the terminus occurs, likely due to the dissociation of base pairs in the order of N–1 (1), N–1 (2/3), N–1 (4), and N–1 (5), or in the order of N–1 (19/20), N–1 (18), and N–1 (17). As discussed, the destabilization during binding of an N–1-mer to the target RNA results from bulge formation and fraying of a few bases at the duplex ends. It is important to note that although RNAs of the same length as the studied duplex were used, real drug targets are much longer mRNAs than both the duplex and N–1-mers, which would likely reduce fraying somewhat. In a study on the effect of the bulge between guide RNA and substrate DNA in CRISPR/Cas9, cleavage was observed in sequences with defects up to three nucleotides from the end; however, little cleavage occurred with defects near the center. 37 In addition, studies on siRNA, using RNA duplexes, showed that terminal defects had little impact on activity, whereas central defects reduced it.38,39 These findings align with the reasons behind the present results.
Target RNA degradation by RNase H
The binding affinity of the N–1-mer to the target RNA is very low, and accurately measuring nucleic acid concentrations in cells is challenging; therefore, the cleavage of target RNA with N–1-mers in cells has not yet been evaluated. Using a cell-free in vitro model system, we established hypothetical concentration conditions under which all N–1 molecules can bind to the target RNA to assess, for the first time, whether a bulge-containing heteroduplex can serve as a good substrate for RNase H. The results showed that most duplexes, in which each N–1-mer was bound to the target RNA, had an RNA cleavage rate exceeding 90%, similar to the DP duplex, indicating successful recognition by RNase H. However, N–1 (10) and N–1 (11), which contain a bulge at the duplex center, displayed a relatively lower cleavage rate of around 60%. It is known that modified nucleic acids, such as locked nucleic acid LNA, inhibit RNase H recognition, which requires at least six consecutive natural DNA/RNA base pairs. 40 The maximum number of DNA sequences for DP and N–1 (1)–(5) and (16)–(19/20) is 10 bases, and for N–1 (6)–(15), it is 9 bases; thus, RNase H can adequately recognize DNA/RNA heteroduplexes. However, the RNA used in this experiment was complementary to the DP; therefore, the number of contiguous natural DNA/RNA base pairs did not match the number of contiguous DNA sequences. From N–1 (7) to N–1 (10), the number of contiguous natural DNA/RNA base pairs decreased from eight to five; for N–1 (11), N–1 (12), and N–1 (13/14), five, six, and eight natural base pairs were formed, respectively. Consequently, the reduction in RNase H cleavage observed for the N–1 (10) and N–1 (11) duplexes may be due to the presence of only five contiguous DNA/RNA base pairs. It is reported that RNA cleavage by RNase H is <10% when the number of contiguous natural DNA/RNA base pairs is fewer than five. 40 However, N–1 (10) and N–1 (11), which had a maximum of five contiguous natural DNA/RNA base pairs, exhibited ∼60% cleavage. This may be because the interruption caused by the bulge was incomplete, allowing RNase H recognition, unlike the gap caused by modified nucleotides. Hagedorn et al. quantified RNase H cleavage of 20 different RNAs that could be off-target (including bulges and mismatches) in a gapmer containing eight contiguous DNA bases. 41 Off-targets with low RNase H cleavage contained many mismatches and bulges, with these noncanonical structures predominantly located centrally. Conversely, off-targets with high cleavage rates also contained mismatches and bulges; however, the unpaired regions were located at the ends or involved GT mismatches. In addition, there was no proportional relationship between the cleavage rate and the binding affinity for RNA. Their findings align with those of the present study, showing that RNA cleavage rates were low in central bulge-forming duplexes, while RNA binding capacity was nearly identical for N–1-mers missing a nucleotide in the central region. This occurs when most of the RNA is bound to the N–1-mer in the presence of sufficient N–1-mer concentrations. Considering real-world applications, the concentration of each N–1-mer as an impurity in oligonucleotide therapeutics depends on DP purity. However, these impurities are all more than two orders of magnitude less in concentration, and their binding affinities are over four orders of magnitude lower than the DP. Therefore, the impact of N–1-mers on the therapeutic target RNA is considered negligible, as revealed in this study.
All N–1-mers function as ASOs less efficiently than the DP, albeit widely varied
Factors crucial for ASO function depend on their mechanism of action. Since RNase H-independent ASOs bind strongly to RNA and sterically regulate gene expression, their binding affinity to the target RNA is the most important factor. Conversely, RNase H-dependent ASOs must also be recognized by RNase H to cleave RNA. Figure 3a shows a plot of binding affinity versus the percentage of RNA cleavage by RNase H for each N–1-mer from this study. The horizontal axis, ΔΔG°37, indicates that the binding constant changes from the DP by one order of magnitude for every 1.4 kcal/mol, meaning that all N–1-mers have a binding capacity at least two orders of magnitude lower than the DP. The vertical axis displays RNA cleavage efficiency. Most N–1-mers exhibited cleavage similar to that of the DP, but those lacking a nucleotide in the central region showed only around 60% cleavage. No N–1-mer achieved the binding affinity and RNA cleavage efficiency close to the DP; all N–1-mers displayed weak ASO activity. However, their positions on the graph in Figure 3 varied widely depending on the site of the missing nucleotides. Notably, N–1 (1), missing the 5′-terminal nucleotide, is the most likely N–1-mer to function similarly to the DP. Whether an N–1-mer competes with the DP depends on the drug dosage. The formation of the ASO/target RNA complex, necessary for ASO effectiveness, relies on binding affinity and dosage. Figure 3b and c illustrates how ASO concentration affects complex formation, assuming 1:1 binding. The horizontal axis shows the antisense nucleic acid concentration at the site of action on a logarithmic scale, and the vertical axis indicates the percentage of the target molecule bound to the ASO. A higher percentage signifies greater drug efficacy. The dissociation constant, Kd, is the concentration at which 50% of the complex is formed. For simplicity, we consider the relationship between concentration and drug effect when each N–1-mer is present at 1% of the drug (about 20% N–1-mers when DP is a 20-mer). For instance, if the dose of ASO just meets the minimum needed for effect via the DP (red dot in Fig. 3b), then the N–1-mer, at 1: 100 of the DP concentration, would have a much weaker effect (blue dot). However, increasing the dose 1,000-fold (Fig. 3c) could make the N–1-mers’ target binding comparable with that of the DP, especially for high-affinity N–1 (1), leading to potential competition. Nonetheless, it is unlikely to encounter a situation with a high concentration of N–1-mers (about 20% impurity). These results come from a model system where only RNAs complementary to the DP are present as targets, which does not reflect a real environment with nontarget RNAs. Future research should explore the effects of impurities in more realistic settings similar to actual drug administration.
Our objective is to quantitatively assess the impact of N–1-mer impurities—currently managed in batches—on patients when administered as oligonucleotide therapeutics and to predict risks based on physicochemical parameters. The data presented here provide a strong, quantitative basis for concluding that N–1-mer impurities do not significantly contribute to the activity against the therapeutic target RNA in the batch at the levels expected in clinical products. However, to evaluate the total effects, including side effects, quantitative interpretations of both on-target and off-target effects are required. This study focuses solely on the impact on therapeutic target mRNA; therefore, quantitative analysis of off-target effects on RNAs other than the therapeutic target mRNA must be conducted as the next step. We expect that once these results are obtained, we will be able to present fruitful discussions regarding risk-based CMC quality control.
Conclusion
A comprehensive examination of N–1-mer impurities in oligonucleotide therapeutics revealed that their characteristics change depending on the location of the nucleotide deletion. Notably, the N–1-mer without a terminal nucleotide shows a relatively high binding affinity to the target RNA; however, the presence of N–1-mers appears to have little impact on DP activity. This study provides key thermodynamic data as a critical basis for assessing the effect of N–1-mer impurities quantitatively in the evaluation of oligonucleotide therapeutics.
Footnotes
Author Disclosure Statement
Each author confirms that their research is supported by an institution that is primarily involved in research or education.
Funding Information
This research was supported by AMED under Grant Numbers JP21ae0121022, JP21ae0121023, JP21ae0121024, JP24mk0121278h0401, and by JST SPRING, Japan, under Grant Number JPMJSP2117.
Supplemental Material
References
Supplementary Material
Please find the following supplemental material available below.
For Open Access articles published under a Creative Commons License, all supplemental material carries the same license as the article it is associated with.
For non-Open Access articles published, all supplemental material carries a non-exclusive license, and permission requests for re-use of supplemental material or any part of supplemental material shall be sent directly to the copyright owner as specified in the copyright notice associated with the article.