
Abstract
The efficacy of nucleic acid therapeutics (NATs) such as antisense oligonucleotides (ASOs) and small interfering RNAs relies on multiple stages of extra- and intracellular trafficking. Assessing uptake and efficacy often relies on fluorescent tagging of the NAT for imaging, although the exogenous tag undoubtedly influences the kinetics of intracellular transport and does not represent the compound used clinically. Therefore, better methods to assess the cellular and tissue distribution of NATs are needed. Here, we have validated new panels of antibody reagents that target clinically relevant nucleic acid modifications for visualizing ASOs both in vitro and in vivo. Using the ModDetect™ library of antibodies, we have tested ASOs in vitro for intracellular localization by immunocytochemistry and for biodistribution in mouse tissues by immunohistochemistry. Antibodies specific for the commonly used phosphorothioate (PS) or 2′-O-methoxyethyl (2′-MOE) modifications successfully detected gapmer ASOs, facilitating colocalization studies with endosomal markers in 2D and 3D cell models. In addition, we assessed colocalization of anti-PS signals with fluorescently tagged ASOs. Our data demonstrate the utility of these reagents for the NAT field, where modified nucleic acids can be detected irrespective of the nucleotide sequence, rendering the system amenable for multiple clinical and preclinical workflows and quantitative immunoassays.
Introduction
Nucleic acid therapeutics (NATs) have the potential to target disorders that were previously untreatable by conventional pharmaceutical drugs. Small antisense NATs, such as antisense oligonucleotides (ASOs) and short interfering RNAs, use modified nucleic acids complementary to a target to modify transcript expression or splicing, with an increasing number of U.S. Food and Drug Administration’s approvals in recent years and hundreds in preclinical development.1,2 Mechanistically, ASOs function typically by instigating degradation of a target RNA species through RNase H1, or modulation of RNA–protein interactions via steric hindrance. 3 Despite the relative simplicity of the underlying design and preclinical testing of these compounds, the inherent instability of ASOs in biological systems has necessitated investigations into modifications to the nucleotide, most commonly the phosphodiester backbone and sugar moieties. The first generation of chemically modified ASOs replaced the nonbridging oxygen with a sulfur atom in the phosphate group, generating phosphorothioate (PS) internucleosidic bonds; this provides increased nuclease resistance and enhanced bioavailability through interactions with plasma proteins.4,5 Second-generation ASOs included ribose sugar modifications, with examples such as 2′-O-methyl (2′-OMe) or 2′-O-methoxyethyl (2′-MOE); these increase RNA binding affinity and nuclease resistance but are incompatible with RNase H1 recruitment. 4 To overcome this limitation, gapmer ASOs were introduced, combining sugar-modified bases flanking a DNA “gap”; this particular structure has now become well established in the NAT field for targeted gene knockdown. 6
For a new drug class to be successful clinically, tools for their quantification in vitro and in vivo are essential; this includes not only standard pharmacokinetic/pharmacodynamic quantification but also methods for understanding basic biological features such as cellular uptake, intracellular trafficking, and biodistribution, all of which have fundamental implications for both efficacy and safety.7,8 For NATs such as ASOs, a range of quantification methods are established, each with varying degrees of sensitivity, throughput, technical complexity, and cost. For example, liquid chromatography–tandem mass spectrometry has the ability to determine accurately the identity of NAT species and metabolites in parallel with quantification, 9 although throughput and sensitivity are challenged by modified enzyme-linked immunosorbent assay (ELISA) methods with improved specificity against oligonucleotide species. 10 Molecular methods, exploiting the obvious DNA/RNA features of ASO composition, can be highly sensitive but often rely on enzymatic amplification kinetics that are influenced by the biological matrix or chemical modifications.8,11 For NAT visualization studies, fluorescent labeling of an ASO, such as with cyanine dyes, can be compatible with live-cell microscopy. However, the biophysical properties of the ASO are altered considerably due to the size and charge of the dye itself, while the labeled molecule does not represent the compound that would be used clinically.12,13 An alternative is detecting the native ASO by fluorescence in situ hybridization; here, the probe design is limited to the short, complementary sequence, and thus, individual probes need to be optimized for every target and may not be compatible for the technology.14,15
For these reasons, antibody reagents that are raised against NAT backbone or sugar modifications, irrespective of nucleotide sequence, provide several advantages for visualization and detection of ASOs. For example, standard methods such as immunocytochemistry (ICC) and immunohistochemistry (IHC) are highly suited to multiplexing, using established protocols. In addition, such reagents provide opportunities for the development of rapid, standardized immunoassays across panels of ASOs with differing sequences but shared modifications.8,16 Historically, an antibody has been raised “in-house” against the 20-mer PS ASO ISIS 2105 designed to target the human papillomavirus 17 ; this reagent has been used to detect NATs containing PS bonds, but it does not have any specificity to second-generation modifications. Importantly, therefore, a new panel of mouse monoclonal antibodies against a range of NAT modifications have recently become available to the NAT field (ModDetect 16 ). The aim of this study was to generate data to benchmark and characterize these panels of antibodies raised against either PS or 2′-MOE modifications in 2D and 3D cellular systems, as well as mouse tissue. By providing optimized protocols and assay exemplars, we illustrate the utility and specificity of the reagents across a range of applications relevant to understanding the efficacy and biodistribution of NATs for preclinical and clinical studies.
Materials and Methods
2D cell culture and ASO dosing
HeLa cells were cultured in Dulbecco’s modified Eagle’s medium (DMEM) with GlutaMAX (Gibco) supplemented with 10% fetal bovine serum (FBS) (Gibco) and 1% penicillin–streptomycin (Gibco). Where required, cells were detached from flasks using TrypLE Express enzyme (Gibco). For ICC, cells were seeded in 8-well chamber slides, either Millicell EZ SLIDE 8-well glass (Millipore) or Nunc Lab-Tek Chamber Slide Systems (Thermo Scientific) at a density of 17,000 cells in 400 µL per well. Gymnotic delivery of ASOs was performed by directly adding the determined ASO concentration to the cell growth media before adding to the cells. Lipofection delivery was performed by diluting 1–2 µL of Lipofectamine 2000 (Invitrogen) per well in Opti-MEM reduced serum medium (Gibco) to achieve 1:10 of the final volume, and then incubation for 5 min at room temperature. After incubation, diluted Lipofectamine was added to the diluted ASO in equal volume and incubated for 15 min, followed by addition of growth media to the desired final volume. Growth medium was replaced by the diluted Lipofectamine and ASO medium and incubated for 72 h. ASOs were synthesized and purified using High-performance liquid chromatography by ATD Bio or IDT.
2D cell culture ICC
Cells were fixed in 4% paraformaldehyde (PFA) in 1× phosphate-buffered saline (PBS) for 15 to 20 min at room temperature. After incubation, cell chambers were washed twice with 1× PBS and once with PBS-T (1× PBS with 0.01% TWEEN-20 or Triton X-100) for 5 min. Blocking was performed in 5% goat serum (New Zealand origin, Gibco) in 1× PBS-T for 60 min at room temperature. Primary monoclonal antibody incubation was carried out using 1:1,000 dilution of ModDetect anti-PS PS03 clone (200–301-MU9, lot 50533, Rockland Immunochemicals) in the same blocking buffer, with additional antibodies being one of the following: 1:200 Rab5 (C8B1) rabbit mAb (Cell Signaling Technology); 1:150 Rab9A (D52G8) XP rabbit mAb (Cell Signaling Technology, 5118S); 1:500 α-tubulin (GeneTex, GTX102078); or 1:100 α/β-tubulin (Cell Signaling Technology, 2148S). The primary antibodies were incubated for 120 min at room temperature. After three 5-min PBS-T washes, the required secondary antibodies were added as follows: 1:2,000 of goat anti-mouse immunoglobulin G (IgG) (H + L) with superclonal recombinant secondary antibody, Alexa Fluor 488 (Invitrogen) and one of the following: 1:2,000 of goat anti-rabbit IgG (heavy chain), superclonal recombinant secondary antibody, Alexa Fluor 555 (Invitrogen); 1:2,000 goat anti-rabbit IgG (heavy chain), superclonal recombinant secondary antibody, Alexa Fluor 647 (Invitrogen); or goat anti-rabbit IgG (H + L) cross-adsorbed secondary antibody, Alexa Fluor 568 (Invitrogen). The secondary antibodies were incubated for 1 h at room temperature, followed by two PBS-T and one with 1× PBS wash for 5 min each. The slide chamber walls were removed as required and the slide dipped in deionized water before mounting in mounting medium with 4′,6-diamidino-2-phenylindole (DAPI) (Abcam). Alternatively, Hoechst 33342 staining was carried out before fixation and the slides mounted with the Fluoromount-G mounting medium (Thermo Fisher). Slides were imaged using a Zeiss LSM900 confocal microscope with Zeiss Blue software, with image processing performed using FIJI (ImageJ). For colocalization quantification, FIJI (ImageJ) software was used with the JACoP plugin; the channels from each snap image were split, isolating the green and red channels and a Pearson’s coefficient value obtained. Data were generated between 63 and 80 individual cells per condition.
Quantitative real-time polymerase chain reaction
Cells were seeded in a 96-well plate in a density of 7,000 cells in 100 µL per well. ASOs were delivered via gymnosis or transfection as biological triplicates at each concentration. Samples were incubated for 72 h and RNA was extracted using the MagMAX mirVana Total RNA Isolation Kit (Applied Biosystems). RNA concentration was measured using the Qubit RNA High Sensitivity Assay Kit (Invitrogen) and cDNA synthesis was carried out using the High-Capacity cDNA Reverse Transcription Kit (Applied Biosystems). Quantitative polymerase chain reaction (qPCR) was performed using Fast SYBR Green Master Mix (Applied Biosystems) on a CFX Opus 384 Real-Time PCR System (Bio-Rad). The following cycling conditions were used: Enzyme activation at 95°C for 20 s, followed by 40 cycles of denaturation at 95°C for 3 s, and annealing and extension at 60°C for 30 s. Primer sequences: 5′-GCAGGCGTTGTGCGTAGAG and 5′-TTGCCGACCTCACGGATT for MALAT-1 and 5′-AGTTCTGTGGCCATATGCTTAGTAG and 5′-AAACAACAATCCGCCCAAAGG for the normalization reference gene HPRT. Reactions were carried out from 1 ng of cDNA with 250 nM of each primer in a 10 µL volume. qPCR data were analyzed using the comparative Ct (ΔΔCt) method: the Ct values of the target gene (MALAT-1) were normalized to the Ct values of the reference gene. Relative gene expression levels were calculated using the formula 2^-(ΔΔCt). All reactions were performed in technical triplicates per biological replicate and the average Ct values used for analysis.
Anti-PS antibody panel ELISA
A 29-mer oligonucleotide (PS-ELISA, Supplementary Fig. S1) was synthesized with 28, nine, or no PS bonds and a sandwich ELISA established. Ninety-six-well plates were coated with one of three ModDetect antibody clones (PS03: 200–301-MU9, lot A3498; PS04: 200–301-MV0, lot A4401; PS05: 200–301-MV1, lot A4402) at 2 µg/mL in 0.1M sodium bicarbonate pH 9.5 overnight at 4°C. After three washes in PBS-T, 300 µL of StabilCoat blocking buffer (Surmodics) was added for 2 h at room temperature. Each ASO was prepared at 100 ng/mL in KJX-0001D sample buffer (Rockland Immunochemicals), 100 µL was added to triplicate wells, followed by incubation for 2 h at room temperature at 450 RPM. After three PBS-T washes, 100 µL of a biotinylated version of the same ModDetect antibody panel (PS03: 200–306-MU9, lot BAC385-2; PS04: 200–306-MV0, lot BAC385-3; PS05: 200–306-MV1, lot BAC385-4) was prepared at 0.5 µg/mL and added to the appropriate wells for an hour at 450 RPM at room temperature. After three further PBS-T washes, 100 µL of streptavidin-HRP solution S000-03 (Rockland Immunochemicals) at 0.125 µg/mL in sample buffer was added to each well for 30 min at 450 RPM at room temperature. Following three further PBS-T washes, 100 µL of 3,3′,5,5′-tetramethylbenzidine (TMB, Surmodics) was added and incubated for 30 min at room temperature in the dark. The reaction was stopped by adding 100 µL of 1N HCl to each well and the absorbance read at 450–630 nm within 5 min.
Anti-MOE antibody panel ELISA
A 20-mer 5–10-5 gapmer containing 2′-MOE-modified bases in the wings, DNA in the gap, and all PS bonds (ISIS 420915, MOE-ELISA, Supplementary Fig. S1) 18 was conjugated to bovine serum albumin and diluted to 5 µg/mL in 0.05M sodium bicarbonate buffer pH 9.5. One hundred microliters of diluted antigen was added to each well at 4°C for 16–18 h. Excess antigen was removed and the plate was washed three times with 1× PBS. Blocking was carried out in 3% fish gel from stock Sigma fish gelatin from cold water fish (Sigma G7765) at room temperature for an hour and excess blocking solution was removed. Threefold serial dilutions of each anti-MOE antibody were added at room temperature for an hour. Excess antibody was removed and the plate was washed three times with PBS-T. 1:8,000 rabbit anti-mouse IgG HRP conjugated (610–403-C46, Rockland Immunochemicals) was diluted in antibody diluent (1% (w/v) of fish gel solution prepared by adding 1.11 g of 45% (w/v) fish gel to 50 mL of 1× PBS) and 100 µL added to each well for binding at room temperature for an hour. Excess conjugate was removed and the plate was washed three times with PBS-T. One hundred microliters of TMB substrate solution (TMBE-1000, Rockland Immunochemicals) was added at room temperature for 30 min and the absorbance at 450 nm was determined using a SpectraMax ME3 or M5e microplate reader.
3D spheroid culture and ASO dosing
A previously reported method was adapted to generate 3D multicellular neural spheroids. 19 Human neuroblastoma cell line SH-SY5Y (ATCC) was expanded in T75 flasks with tissue culture treatment surfaces (NUNC) in DMEM supplemented with 10% FBS. When cells reached the exponential growth phase, the cells were detached with TrypLE (Thermo Fisher) and resuspended in ultralow-adherence U-bottom 96-well plates (Corning), at a density of 10,000 cells per well. After 4 days of spheroid formation, for gymnotic delivery, ASOs were diluted to the desired concentration and added into the culture medium for another 72 h or 7 days of incubation. For transfection, an ASO–Lipofectamine 2000 complex was made by incubating 3 μL per well of Lipofectamine with the ASO at room temperature for 15 min. For RNA preparation, the culture medium was removed carefully from the spheroids in culture, and then 50 µL of Accutase (Thermo Fisher) was added into each well before returning to the 37°C incubator for 15 min. After incubation, the spheroids were homogenized by pipetting up and down five times. The cells were spun down at 300g for 5 min, and the supernatant was removed. Two hundred microliters of lysis buffer (Thermo Fisher) was then added into each well before the total RNA preparation workflow (KingFisher, Thermo Fisher).
3D cell culture ICC
Spheroids were fixed in 4% PFA in 1× PBS at room temperature for 30 min, and then washed twice in 1× PBS. The spheroids were then blocked in 10% goat serum in 1× PBS supplemented with 0.1% Tween-20 (PBS-T) for 45 min. Primary antibody incubation was carried out using 1:1,000 dilution of the ModDetect anti-PS clone PS03 (Rockland Immunochemicals, Inc.) in 1× PBS, with additional antibodies being either of the following: 1:300 Rab9A (D52G8) XP rabbit mAb (Cell Signaling Technology) or 1:300 TUJ1 (Abcam). After overnight incubation of the primary antibodies at 4°C, the spheroids were washed in 1× PBS at room temperature twice for 15 min. Then the required secondary antibodies were added as follows: 1:500 of goat anti-mouse IgG (H + L) with superclonal recombinant secondary antibody, Alexa Fluor 488 (Invitrogen, A28175) and 1:500 of goat anti-rabbit IgG (heavy chain) with superclonal recombinant secondary antibody, Alexa Fluor 647 (Invitrogen, A21244). After being incubated with the above secondary antibodies for 90 min at room temperature, the spheroids were washed in 1× PBS twice for 15 min and once in deionized water, were mounted in the DAPI mounting medium (Abcam), and imaged using a Zeiss LSM 900 confocal microscope with Zeiss Blue software.
In vivo ASO dosing
All animal experiments were conducted according to the Medical Research Council (MRC) guidance responsible for the use of animals for medical research (July 1993), and the UK Home Office Project License PP3246997 with local ethical approval by the MRC Mary Lyon Centre (MLC) Animal Welfare and Ethics Review Body Committee. All mice (C57BL/6JH strain, adult male mice) were housed at the MLC in individually ventilated cages in a pathogen‐free environment, in a 12-h light/12-h dark cycle (LD 12:12; lights on at 7:00 a.m.) with ad libitum access to standard rodent chow (SDS Rat and Mouse No. 3 Breeding diet, RM3) and water. The ASO (MOE/PS gapmer) was diluted in sterile 1× PBS for a final dose of 50 mg/kg and delivered subcutaneously. Control animals were dosed with 1× PBS alone. Tissue was harvested 72 h later for IHC.
Tissue IHC
Mouse tissues were immersed and fixed in 10% neutral buffered formalin for 30 h and then processed into wax blocks. Sections were cut at 8 µm and mounted on Trubond 380 slides (Electron Microscopy Sciences) and dried overnight. Immunostaining was carried out using the M.O.M. Fluorescein Immunodetection Kit (VectorLabs) as recommended by the manufacturer. Briefly, after dewaxing in xylene and rehydration into water, 1× PBS, slides were blocked for an hour at room temperature followed by overnight incubation with the ModDetect anti-PS clone PS03 (1:1,000, Rockland Immunochemicals) diluted in M.O.M. diluent (VectorLabs) at 4°C overnight. After two 1× PBS washes for 3 min, the biotinylated anti-mouse IgG secondary antibody (VectorLabs) was added for an hour at room temperature. Slides were washed twice for 3 min in 1× PBS, followed by the addition of Fluorescein Avidin DCS (VectorLabs) for an hour at room temperature. After two final 1× PBS washes of 3 min, the slides were mounted using the mounting medium with DAPI (Abcam). For co-IHC, tissues were dewaxed and washed as stated above. Tissues were permeabilized by washing for 3 min with 0.25% Tween-20 in PBS (PBS-T). Blocking was performed by mixing and adding equal parts of 5% donkey serum in PBS-T and M.O.M. blocking reagent, followed by an hour of incubation at room temperature. Primary antibody staining was performed with the M.O.M. protocol as stated above, using goat polyclonal anti-CLEC4F/CLECSF13 (1:500, R&D Systems), rabbit polyclonal anti-ASGR1 (1:300, Proteintech), and ModDetect anti-PS clone PS03 (1:1,000, Rockland Immunochemicals), and incubated overnight at 4°C. After two 1× PBS washes for 3 min, secondary antibody staining was performed by following the same M.O.M. secondary staining steps as stated above. After two 1× PBS washes, secondary antibodies were added, donkey anti-rabbit IgG (H + L) ReadyProbes secondary antibody, Alexa Fluor 594 (1:500, Invitrogen) and donkey anti-goat IgG (H + L) highly cross-adsorbed secondary antibody, Alexa Fluor Plus 647 (1:500, Invitrogen), diluted in 5% donkey serum in PBS-T, and incubated for an hour at room temperature. After two final 1× PBS washes of 3 min, the slides were mounted using mounting medium with DAPI (Abcam). Imaging was carried out using a Zeiss LSM 900 confocal microscope with Zeiss Blue software and the images were processed using FIJI (ImageJ) software.
Statistical analyses
Statistical analyses were performed using the GraphPad Prism 10.4.1 software. Data are presented as mean ± standard error of the mean. Differences between groups were analyzed using one-way analysis of variance followed by Dunnett’s test for multiple comparisons. A P value of <0.05 was considered statistically significant.
Results
The methodological details regarding the generation of the ModDetect panel of anti-PS and anti-MOE mouse monoclonal antibodies have been described recently. 16 Briefly, derivatized modified oligonucleotides conjugated to keyhole limpet hemocyanin as a carrier served as the immunogens in mouse, followed by hybridoma screening for specificity and sensitivity using a panel of positive and negative control oligonucleotides. 16
Anti-PS ICC and ASO efficacy in 2D cell culture
To evaluate the anti-PS antibodies as immunocytochemical reagents, first we wanted to assess their sensitivity and specificity across a range of ASO concentrations that are used typically in an on-target efficacy or cellular toxicity experiment, as opposed to a lead optimization or dose–response study. 20 For this, we compared gymnotic and transfection methods of delivery using an established 16-mer gapmer targeting the human noncoding RNA MALAT-1 21 ; this ASO has a 3-10-3 configuration with locked nucleic acid (LNA) modifications on the wings and PS internucleosidic bonds throughout (LNA/PS, Supplementary Fig. S1). Seventy-two hours after ASO delivery, HeLa cells were fixed and anti-PS immunostaining carried out using the ModDetect mouse monoclonal antibody clone PS03. Punctate cytoplasmic immunopositive staining was observed across all doses, with an increasing number of cells containing puncta at the higher concentrations (Fig. 1A). At these higher doses, for example, gymnosis at 10 µM, every cell appears to show puncta that fill a large proportion of the cytoplasm (Fig. 1A). At the lower transfection concentrations, not every cell demonstrated positive cytoplasmic immunostaining, suggesting that cellular uptake and sequestration of this ASO do vary considerably among a population of cells (Fig. 1A). Interestingly, the distribution of signal was consistently in larger, more discrete puncta in cells transfected, as opposed to those where ASO uptake was by gymnosis, as has been described previously. 5 In addition, no signal was detected from cells left untreated (Fig. 1A, left panel).
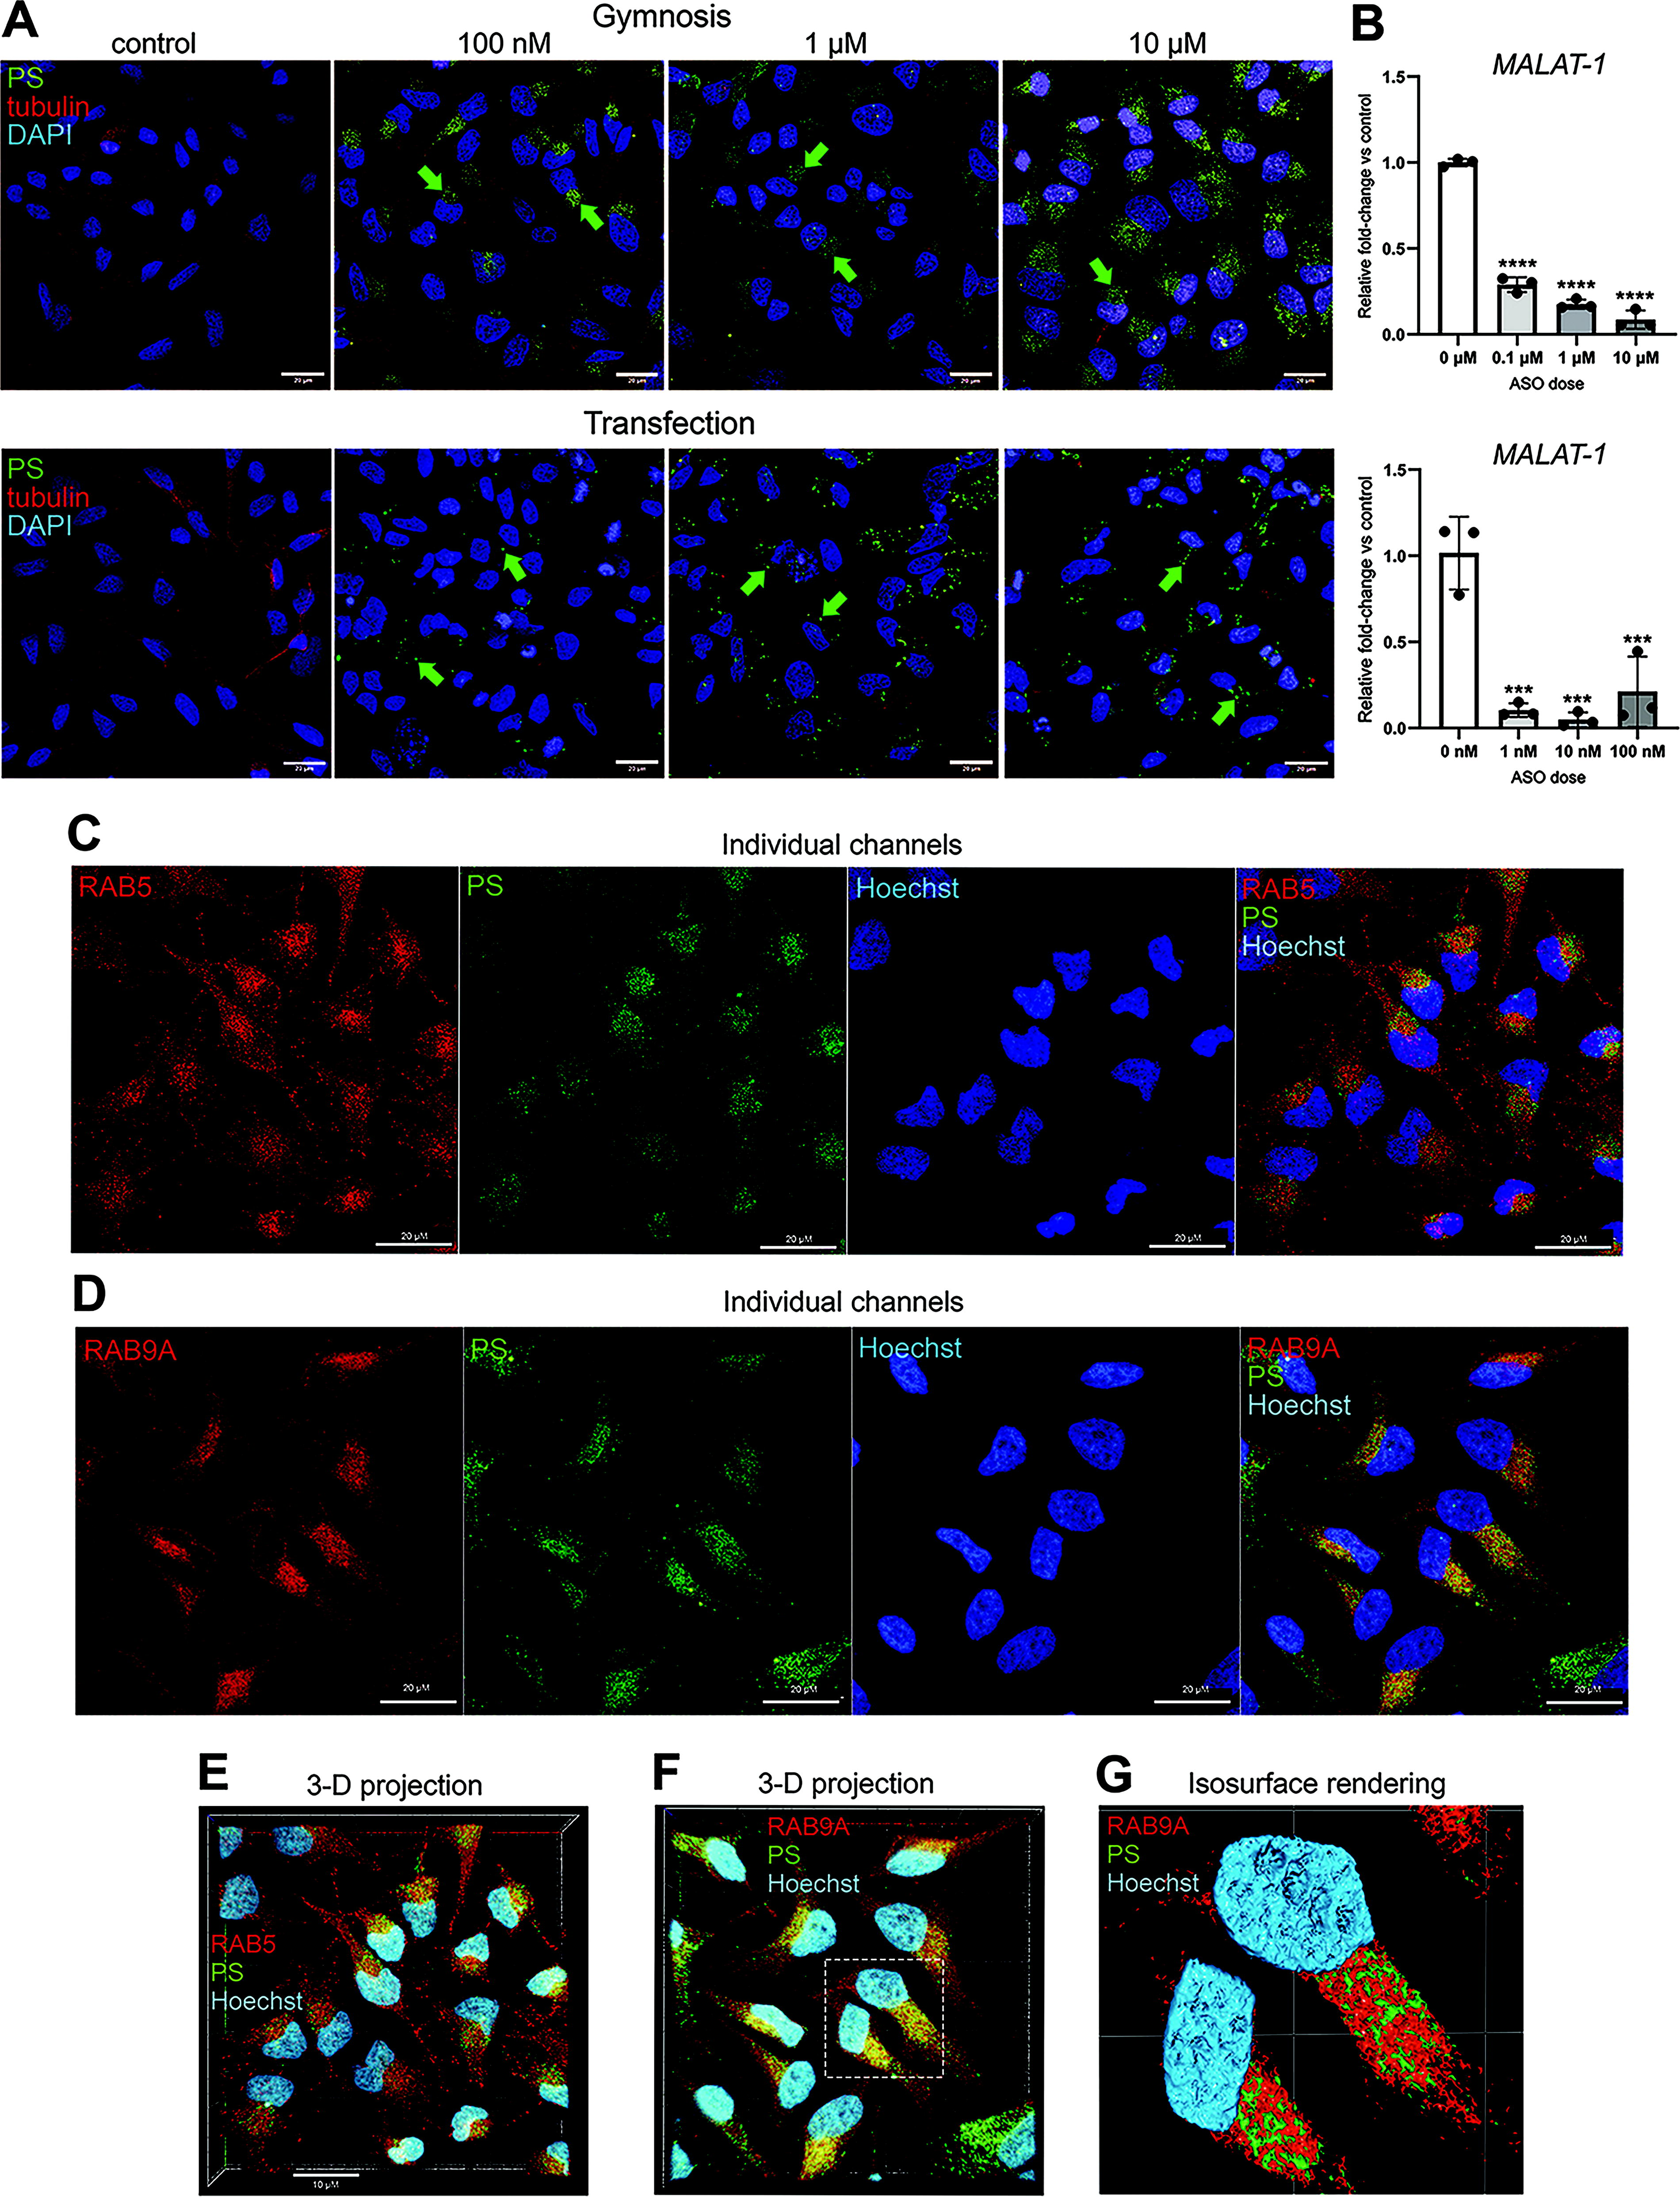
Anti-phosphorothioate (PS) antibody detection by immunocytochemistry and colocalization with endosomal markers. Representative anti-PS immunocytochemistry for a 16-mer LNA ASO gapmer (LNA/PS) in HeLa cells.
In parallel, to determine how the dose and immunocytochemical signal might relate to on-target efficacy of this LNA-modified ASO, cells treated under the same conditions were subjected to qRT-PCR for the target MALAT-1. Via gymnosis, a dose–response-associated knockdown effect was apparent, likely reflecting the uptake efficiency of the ASO without the transfection reagent (Fig. 1B). As expected, using an established, optimized gapmer over this time course, knockdown levels of over 90% were achieved at these relatively high concentrations by transfection (Fig. 1B). Of note, overall, these experiments only detected a very limited amount of potentially nuclear immunostaining despite the obviously highly active nature of this particular ASO. Together, these data suggest that the anti-PS antibody can specifically detect the cellular uptake of this active PS-modified ASO.
Anti-PS ICC and endosomal localization in 2D cell culture
A fundamental feature of ASO efficacy relies on intracellular trafficking via the endolysosomal system, through which only a very small proportion “escapes” endosomal sequestration and is productive. 22 Therefore, we predict that the punctate anti-PS staining we have observed reflects accumulation of the ASO in late endosomal compartments. To assess this experimentally, cells were dosed with the same LNA/PS-modified 16-mer ASO targeting MALAT-1 (LNA/PS), followed by coimmunostaining for markers for subsets of either early (RAB5) or late (RAB9A) endosomes (Fig. 1C, D). Combining the fluorescent channel signals demonstrates areas of likely colocalization between the endosomal markers and the ASO, with potentially more overlap with RAB9A immunostaining (Fig. 1C, D). Multiple images were also generated as Z-stack 3D projections to obtain a more unbiased indication of costaining, further demonstrating evidence for colocalization of the ASO in endosomes (Fig. 1E, F). This was further characterized by examining the 3D isosurface-rendered images of the RAB9A and anti-PS signal, showing close proximity of the coimmunostaining (Fig. 1G). These data suggest that sequestration of this ASO in endosomal compartments can be observed using the anti-PS reagents.
Anti-PS immunostaining and on-target efficacy in 3D cultures
Given the genetic basis of NAT targeting mechanisms, frequently the design of the ASO itself is limited to a human transcript sequence, in particular, when engagement to a disease-specific variant is necessary. As such, using human 3D cellular systems to model more complex tissue structures becomes a necessary replacement for rodent NAT efficacy or toxicity.23,24 Therefore, we wanted to assess the functionality of the anti-PS reagents in 3D cellular systems associated with ASO uptake and penetration. Neuroblastoma SH-SY5Y-based spheroids were grown for 4 days and dosed with the LNA ASO (LNA/PS). We compared gymnotic uptake in the growth media for 72 h with a transfection of the ASO into the cells after 4 days of initial growth. By gymnosis, as illustrated by generating 3D Z-stack images, much of the ASO anti-PS signal is maintained on the outer surface of the spheroid after gymnosis, while penetration is improved somewhat after transfection of the ASO into cells (Fig. 2A).
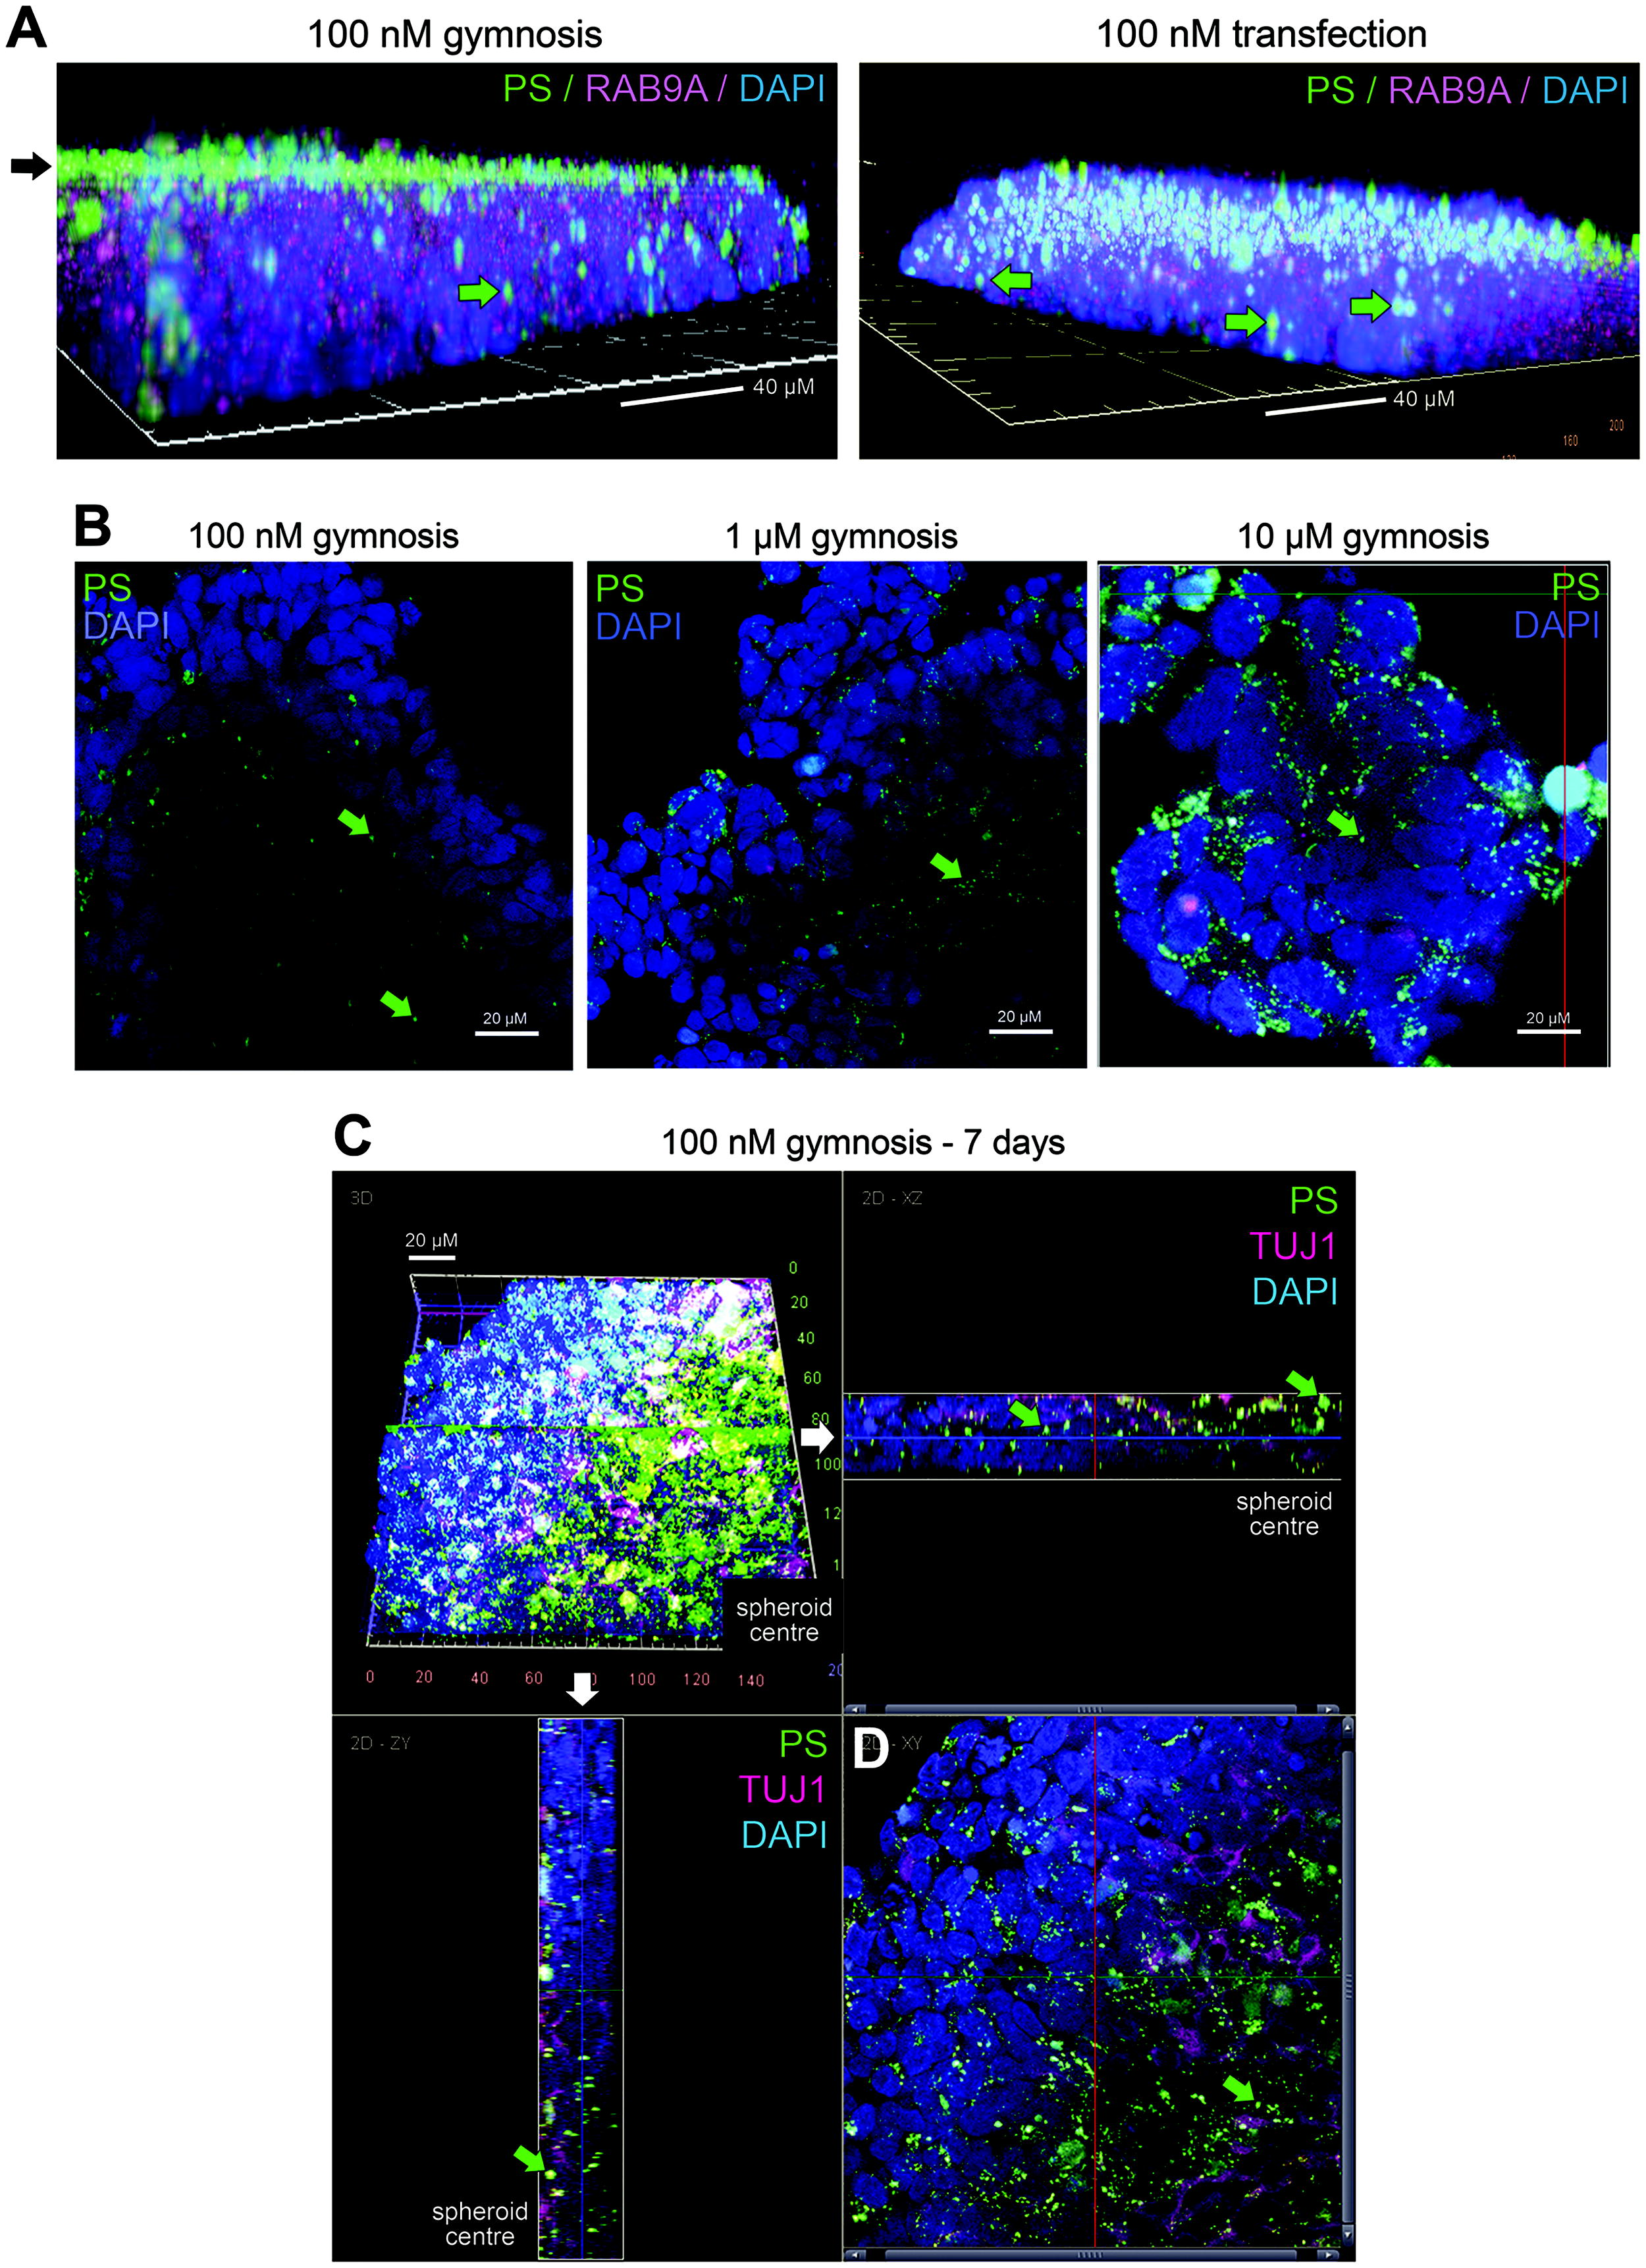
Dose and timing of ASO uptake into spheroid cultures.
Next, we wanted to test a range of ASO doses in 3D cultures that are used typically in organoid NAT treatment studies, 25 and thus, we repeated the spheroid treatment with the LNA/PS oligonucleotide at higher concentrations. Here, after 3 days, there appeared to be some increase in anti-PS-positive puncta throughout the structures as the concentration increased, particularly at 10 µM; imaging through the spheroid structure at this dose demonstrates the cumulative penetration of the ASO (Fig. 2B and Supplementary Fig. S2A). Of note, at this ASO concentration, the spheroids did reduce in size compared with lower doses, likely due to some cytotoxicity. As longer term culturing of 3D cell models is typical, we then repeated the immunocytochemical imaging in spheroids at 7 days after gymnotic delivery of 100 nM. Interestingly, these data show a deep penetration of the anti-PS signal toward the center of the spheroid (Fig. 2C, D), suggesting that the additional incubation time facilitates ASO trafficking through the structure. In summary, these data show the utility of the anti-PS reagents for detecting the spatiotemporal localization of an ASO in 3D cultures.
To relate these findings to ASO efficacy, 3D cultures were generated as above, followed by 3 days of either transfection or gymnosis of the LNA/PS oligonucleotide. RNA was prepared from whole spheroids and qPCR carried out for MALAT-1. At the 100 nM dose, the on-target activity level of the ASO was very similar by either transfection or gymnosis, showing approximately 20% knockdown of MALAT-1 compared with cultures treated with a nontargeting control ASO (NTC, Supplementary Fig. S2B). At the higher 10 µM dose, however, there was a significant reduction in MALAT-1 expression down to almost 70%, confirming that higher concentrations and deeper penetration of the ASO into the spheroid are beneficial for potency.
Sensitivity and specificity of ModDetect anti-PS panel by ELISA
Although PS modifications in ASOs are a well-established method of maintaining the cellular stability of an oligonucleotide, they are also associated with the induction of immune responses and related cellular toxicity. 26 As such, there is a conscious move to reduce the number of PS bonds in oligonucleotides destined for the clinic. A key feature of anti-PS reagents, therefore, will be the detection of ASOs with reduced PS content. Thus, to assess this empirically, a sandwich ELISA was established to compare the sensitivity and specificity of three independently generated anti-PS clones against oligonucleotides containing 100% (29/29), 31% (9/29), or no PS bonds (Supplementary Fig. S1). These data demonstrate equivalent sensitivity of all three clones against the fully PS ASO (Supplementary Fig. S3). For the partial (9/29) PS-containing oligonucleotide, the immunoreactivity is reduced by approximately 50% for all clones, with clone PS05 demonstrating significantly increased sensitivity compared with clones PS03 and PS04 using the ELISA method (Supplementary Fig. S3).
Anti-MOE antibody library ICC
With anti-PS antibodies applicable to many current nucleic acid therapeutics, second- and third-generation chemistries have focused on modifying the ribose sugar; therefore, reagents that detect such alternative oligonucleotide modifications are essential for the field. A panel of mouse monoclonal antibodies were generated against the 2′-MOE modification using the same approach as for the anti-PS clones. 16 We went on to test these new reagents by ICC in HeLa cells against a 20-mer gapmer ASO containing five 2′-MOE-modified bases on each wing, therefore 10 in total, with a full set of internucleosidic PS bonds (MOE/PS, Supplementary Fig. S1). 27 Each of the four individual anti-MOE clones (MOE-1, -3, -4, and -9) was tested, in addition to a clone pooled from three hybridomas (MOE-C). At a single transfected ASO dose (100 nM), all the clones generated punctate immunopositive staining reminiscent of the anti-PS data (Fig. 3A and Supplementary Fig. S4A). Focusing on one anti-MOE clone (MOE-4), we assessed in more detail the specificity of the signal observed. As negative controls, cells were transfected with the LNA-modified ASO as described above (LNA/PS) and the 20-mer MOE gapmer with no PS bonds (MOE/PO, Supplementary Fig. S1); in both cases, no positive signal using the anti-MOE could be detected (Fig. 3B); of note, the lack of signal for MOE/PO likely reflects endonuclease digestion of the ASO. In addition, to confirm the presence of the PS-modified MOE ASO (MOE/PS), cells transfected in parallel showed positive immunostaining using the anti-PS antibody (Fig. 3B). In these experiments, the cells were also costained for RAB9A; as for the anti-PS antibody, some colocalization between anti-MOE and anti-RAB9A is visible, suggesting some late endosomal sequestration of this transfected gapmer ASO (Fig. 3B). Together, these data demonstrate that the anti-MOE clones are able to detect successfully and specifically an ASO with 50% MOE-modified bases in human cells. To further characterize the anti-MOE reagents, the comparative sensitivity of each clone from the panel was determined by ELISA using a different 20-mer gapmer, also containing 50% MOE modifications; all clones display similar levels of sensitivity, consistent with the positive immunocytochemical data obtained (Supplementary Fig. S4B).
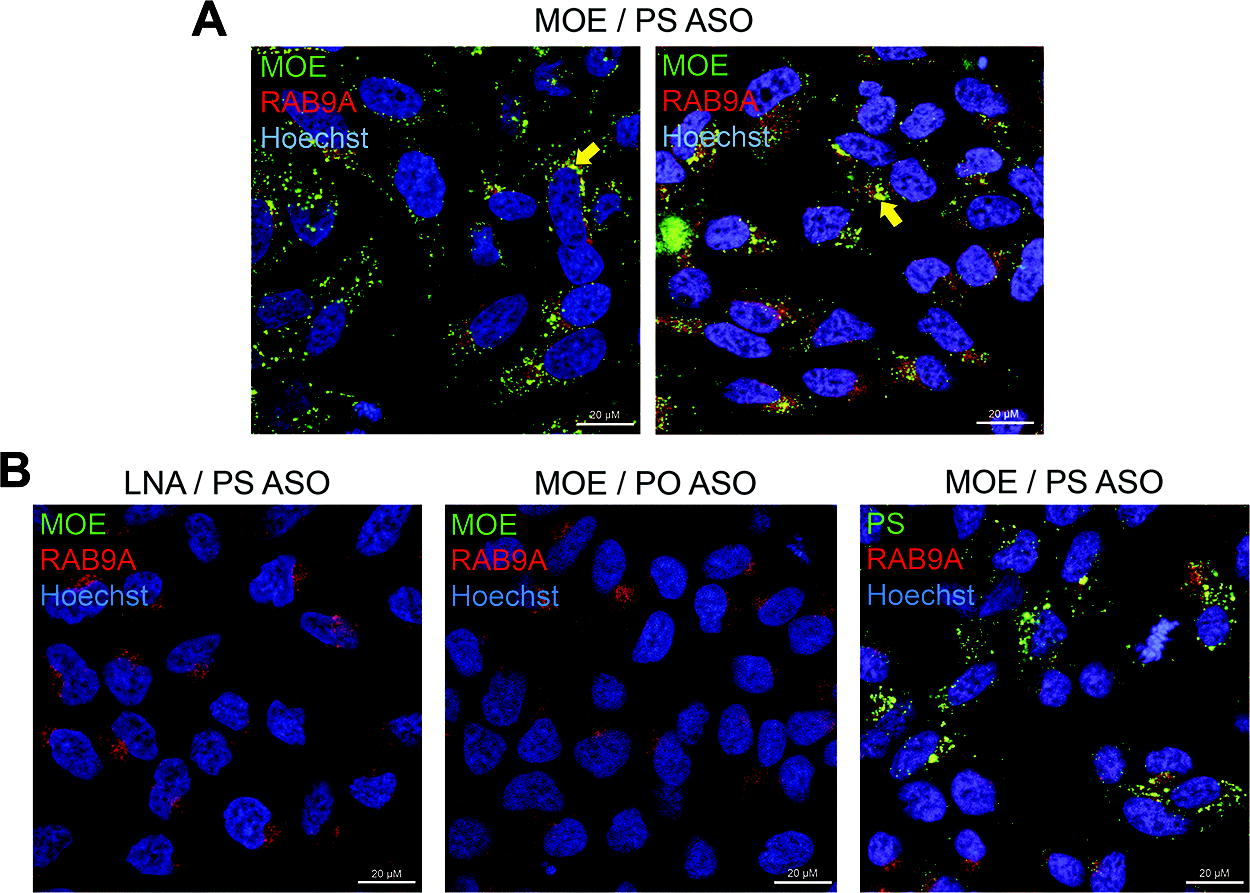
Anti-MOE immunocytochemistry. HeLa cells were treated with 100 nM of the gapmer ASOs indicated for 72 h by gymnosis. Representative immunostaining using the ModDetect anti-MOE clone MOE-4 (MOE, green) with the late endosomal marker RAB9A (red) and nuclei stained with Hoechst (blue).
Finally, to confirm that the specificity of the ICC data was not limited to an ASO sequence targeting the predominantly nuclear MALAT-1 transcript, 15 we repeated anti-PS and anti-MOE immunostaining in HeLa cells treated gymnotically with an ASO against the protein coding gene PTEN (Supplementary Fig. S1). 5 For both antibodies, immunopositive cytoplasmic puncta were present in all cells, with no signal detectable in those left untreated (Supplementary Fig. S5).
Codetection of labeled ASO and ModDetect antibody ICC
Criticisms of using fluorescently tagged oligonucleotides for intracellular localization studies include changes to the physical properties caused by the size and charge of the tag itself, and that unproductive metabolites of the NAT containing the tag will likely be visualized. 8 Therefore, we were interested to compare ICC for the anti-PS and anti-MOE clones with imaging of a fluorescently labeled ASO directly. A Cy3-labeled version of the MOE-modified ASO used above (MOE/Cy3, Supplementary Fig. S1) was generated and HeLa cells dosed at 100 nM, followed by immunostaining for the two antibodies independently 72 h later. As seen using the unlabeled MOE/PS ASO, the immunopositive staining derived from both the anti-PS (Fig. 4A) and anti-MOE (Fig. 4D) antibodies is generally clustered to one pole of the nucleus, and this pattern is shared with the Cy3-labeled ASO. At this microscopic resolution (63× magnification), there are clearly multiple areas of colocalization between the Cy3 signal and the antimodification antibody signal in both cases (Fig. 4A–F). Interestingly, however, there are also defined cytoplasmic puncta of each independent fluorescent channel, suggesting areas of ASO sequestration that are not shared between the labeled ASO signal and anti-PS or anti-MOE detection (Fig. 4C, F). To quantify the degree of colocalization, pixel-wise analyses were used using Pearson’s correlation coefficient. 28 By analyzing multiple individual cells across several fields of view, the coefficient for anti-PS and anti-MOE with the Cy3 signal was 0.76 and 0.8, respectively (Fig. 4G); this suggests a significant degree of colocalization, where 1.0 represents complete overlap. 28 To confirm that the background fluorescent signal was not interfering with these data overtly, exemplar quantification when no ASO was delivered to the cells showed a correlation coefficient of only 0.18 (Fig. 4G, H). Overall, these data suggest that there is a fraction or metabolite of the MOE/Cy3 oligonucleotide that cannot be detected by the antibodies, representing ASO fragments where the fluorescent tag alone has been cleaved, while the remaining oligonucleotide can still be detected by anti-PS or anti-MOE immunostaining.
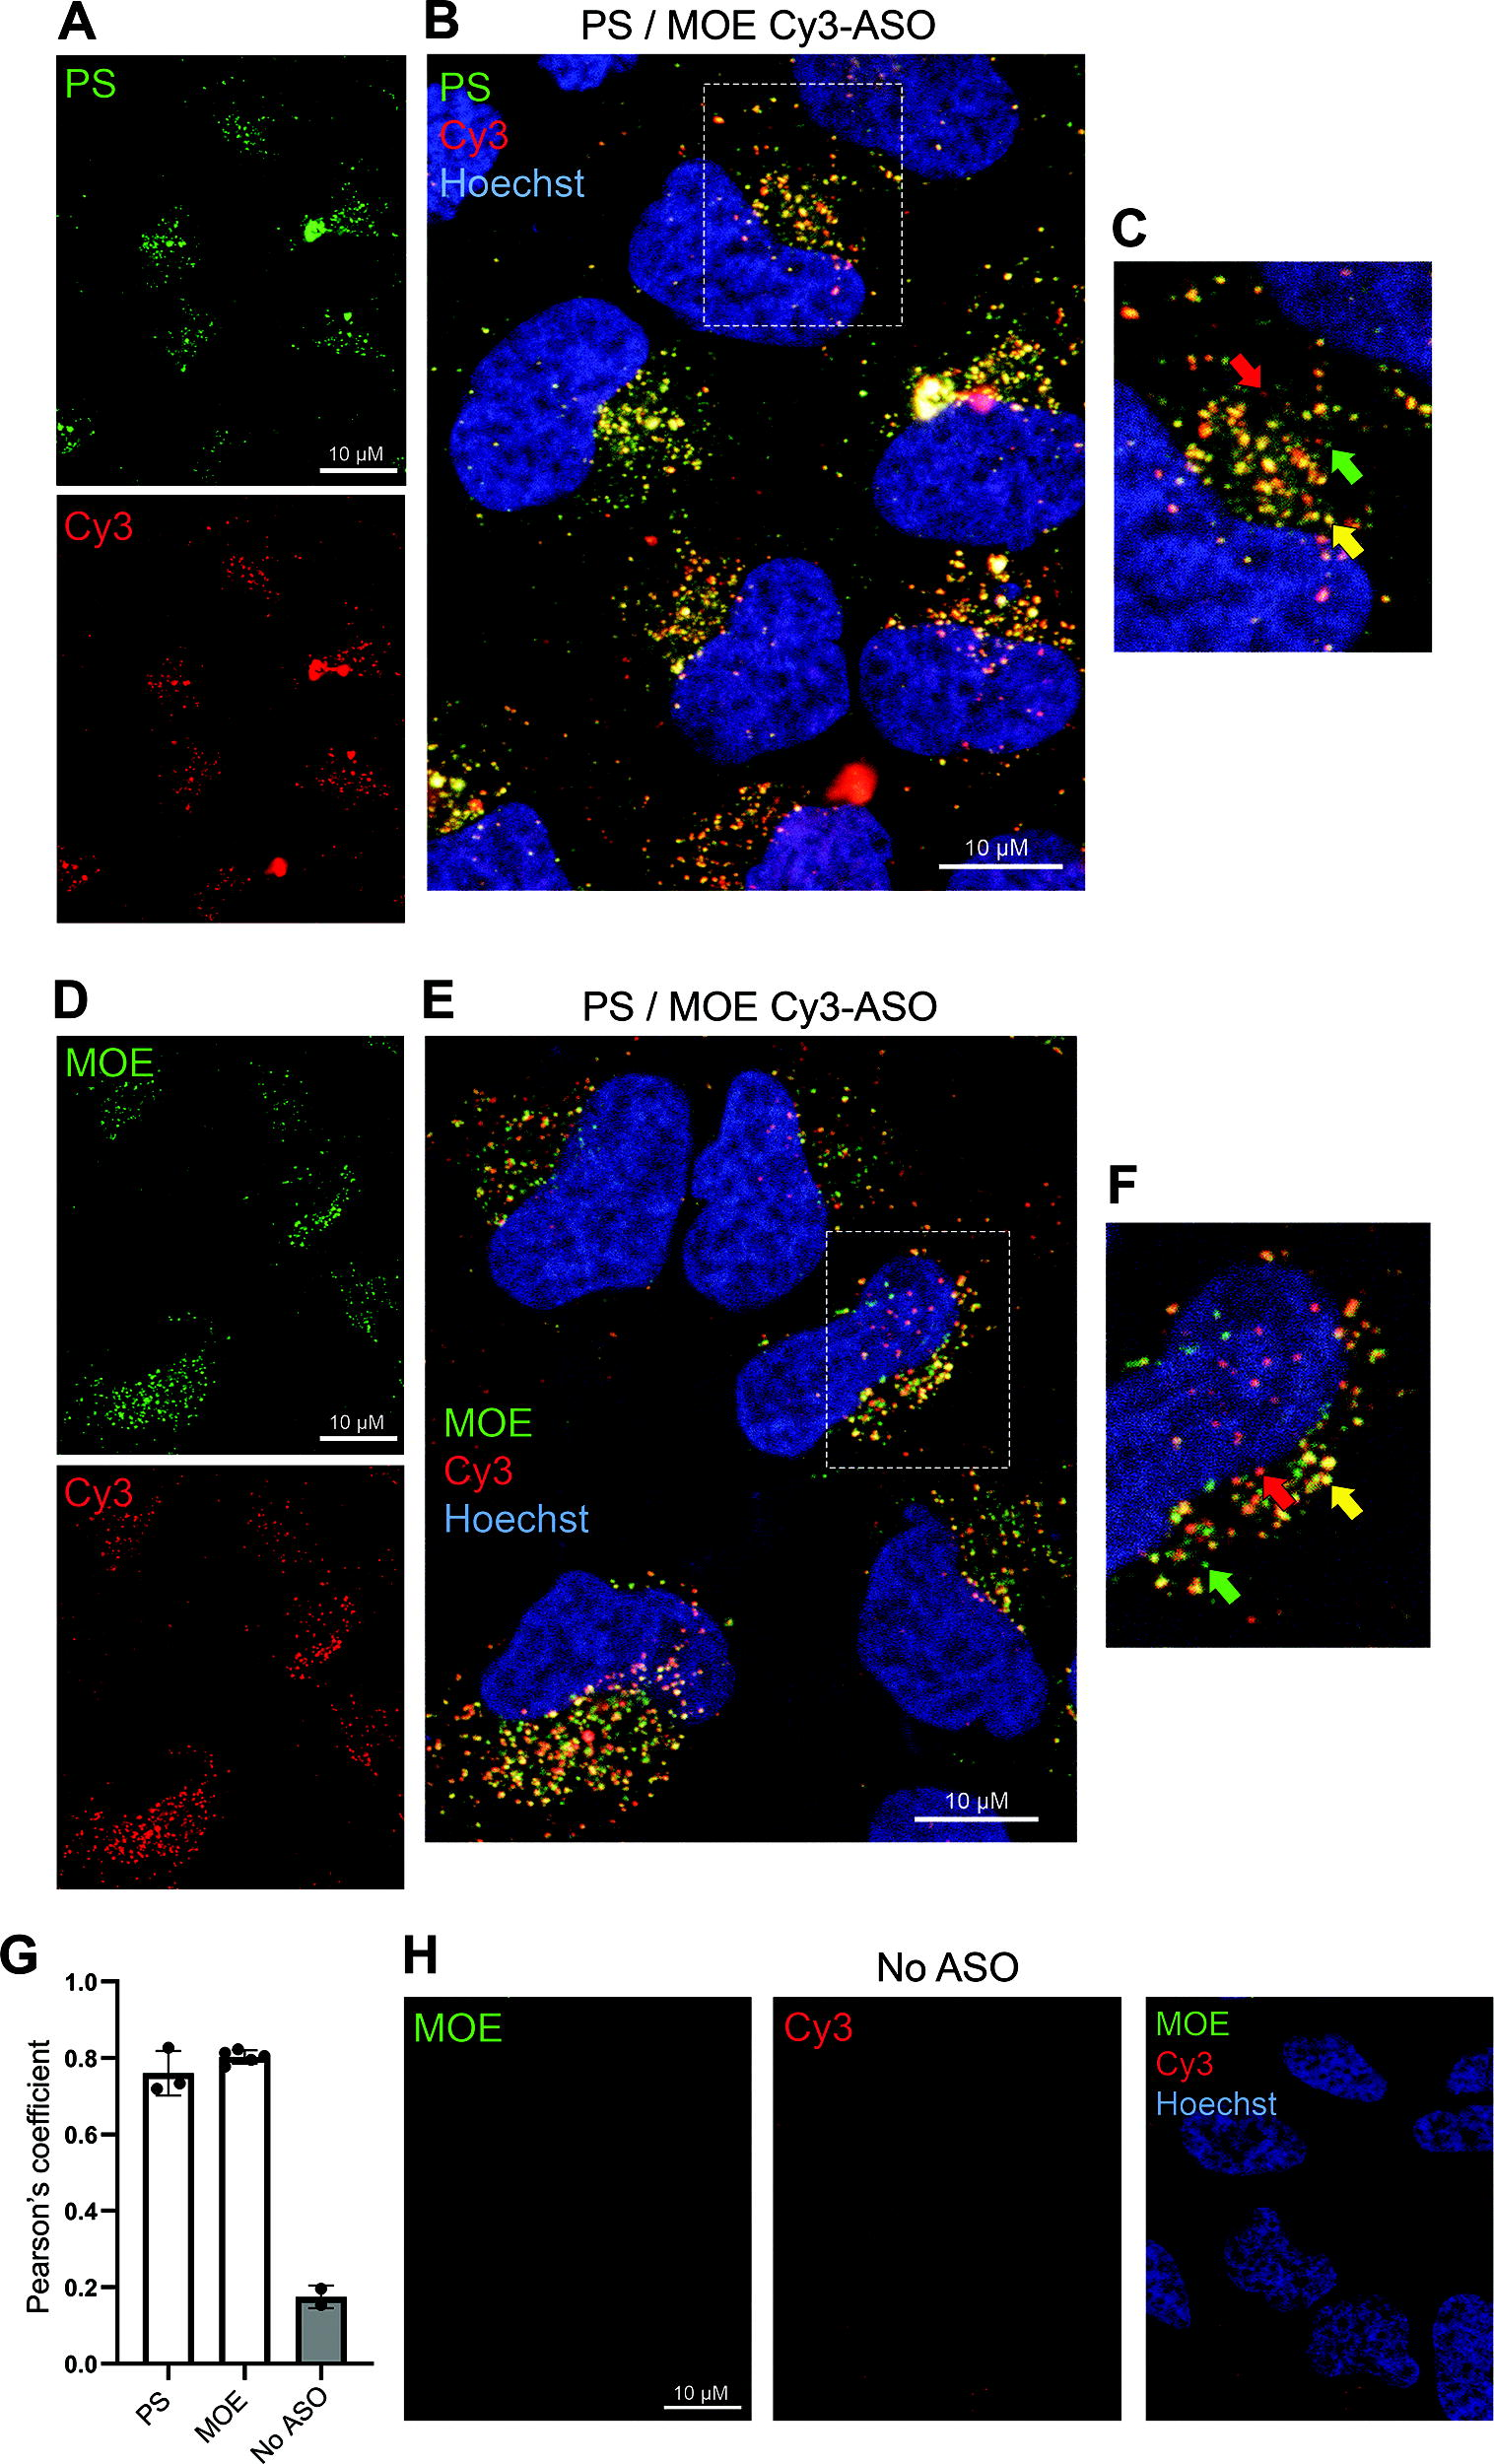
Colocalization of Cy3-labeled ASO with anti-PS immunocytochemistry. A Cy3-labeled ASO gapmer (MOE/Cy3) was delivered at 100 nM by gymnosis to HeLa cells for 72 h. Representative immunostaining using an anti-PS antibody (PS03, green)
In vivo ASO biodistribution by IHC
An important feature of NAT preclinical development is the assessment of biodistribution in vivo. After systemic delivery in rodents, for example, nonconjugated ASOs are known to be cleared rapidly via the liver and kidneys, although a major hurdle in the field is to discover and test novel conjugates or delivery vehicles combined with NATs that deliver to extrahepatic tissues. 29 As discussed above, fluorescently labeled NATs are used for this purpose; however, there are advantages to using IHC that can detect an unlabeled NAT in fixed tissue to determine cell-type-specific accumulation. Therefore, we tested immunohistochemical detection of the same MOE/PS gapmer ASO used above (Fig. 4) after systemic delivery in the mouse. Fixed liver tissue sections taken 48 h after a single subcutaneous ASO dose were immunostained using the anti-PS and anti-MOE monoclonal antibodies independently (Fig. 5). The general positive staining pattern was identical between the clones; based on cell morphology, the vast majority of the signal occurred in nonparenchymal cells (Fig. 5A). To confirm this, multiplex costaining for hepatocytes was carried out using anti-ASGR1, where it was apparent that the immunopositive signal derived from this ASO is not detectable in this cell population at this dosing regimen (Fig. 5B). Presence in Kupffer cells was detected by adjacent costaining with anti-CLEC4F, while the remaining ASO accumulation is likely in other nonparenchymal cell populations such as sinusoidal endothelial cells and hepatic stellate cells. 30 Importantly, as a negative control for specificity, no signal could be detected in liver tissue from mice treated with PBS (Fig. 5C).
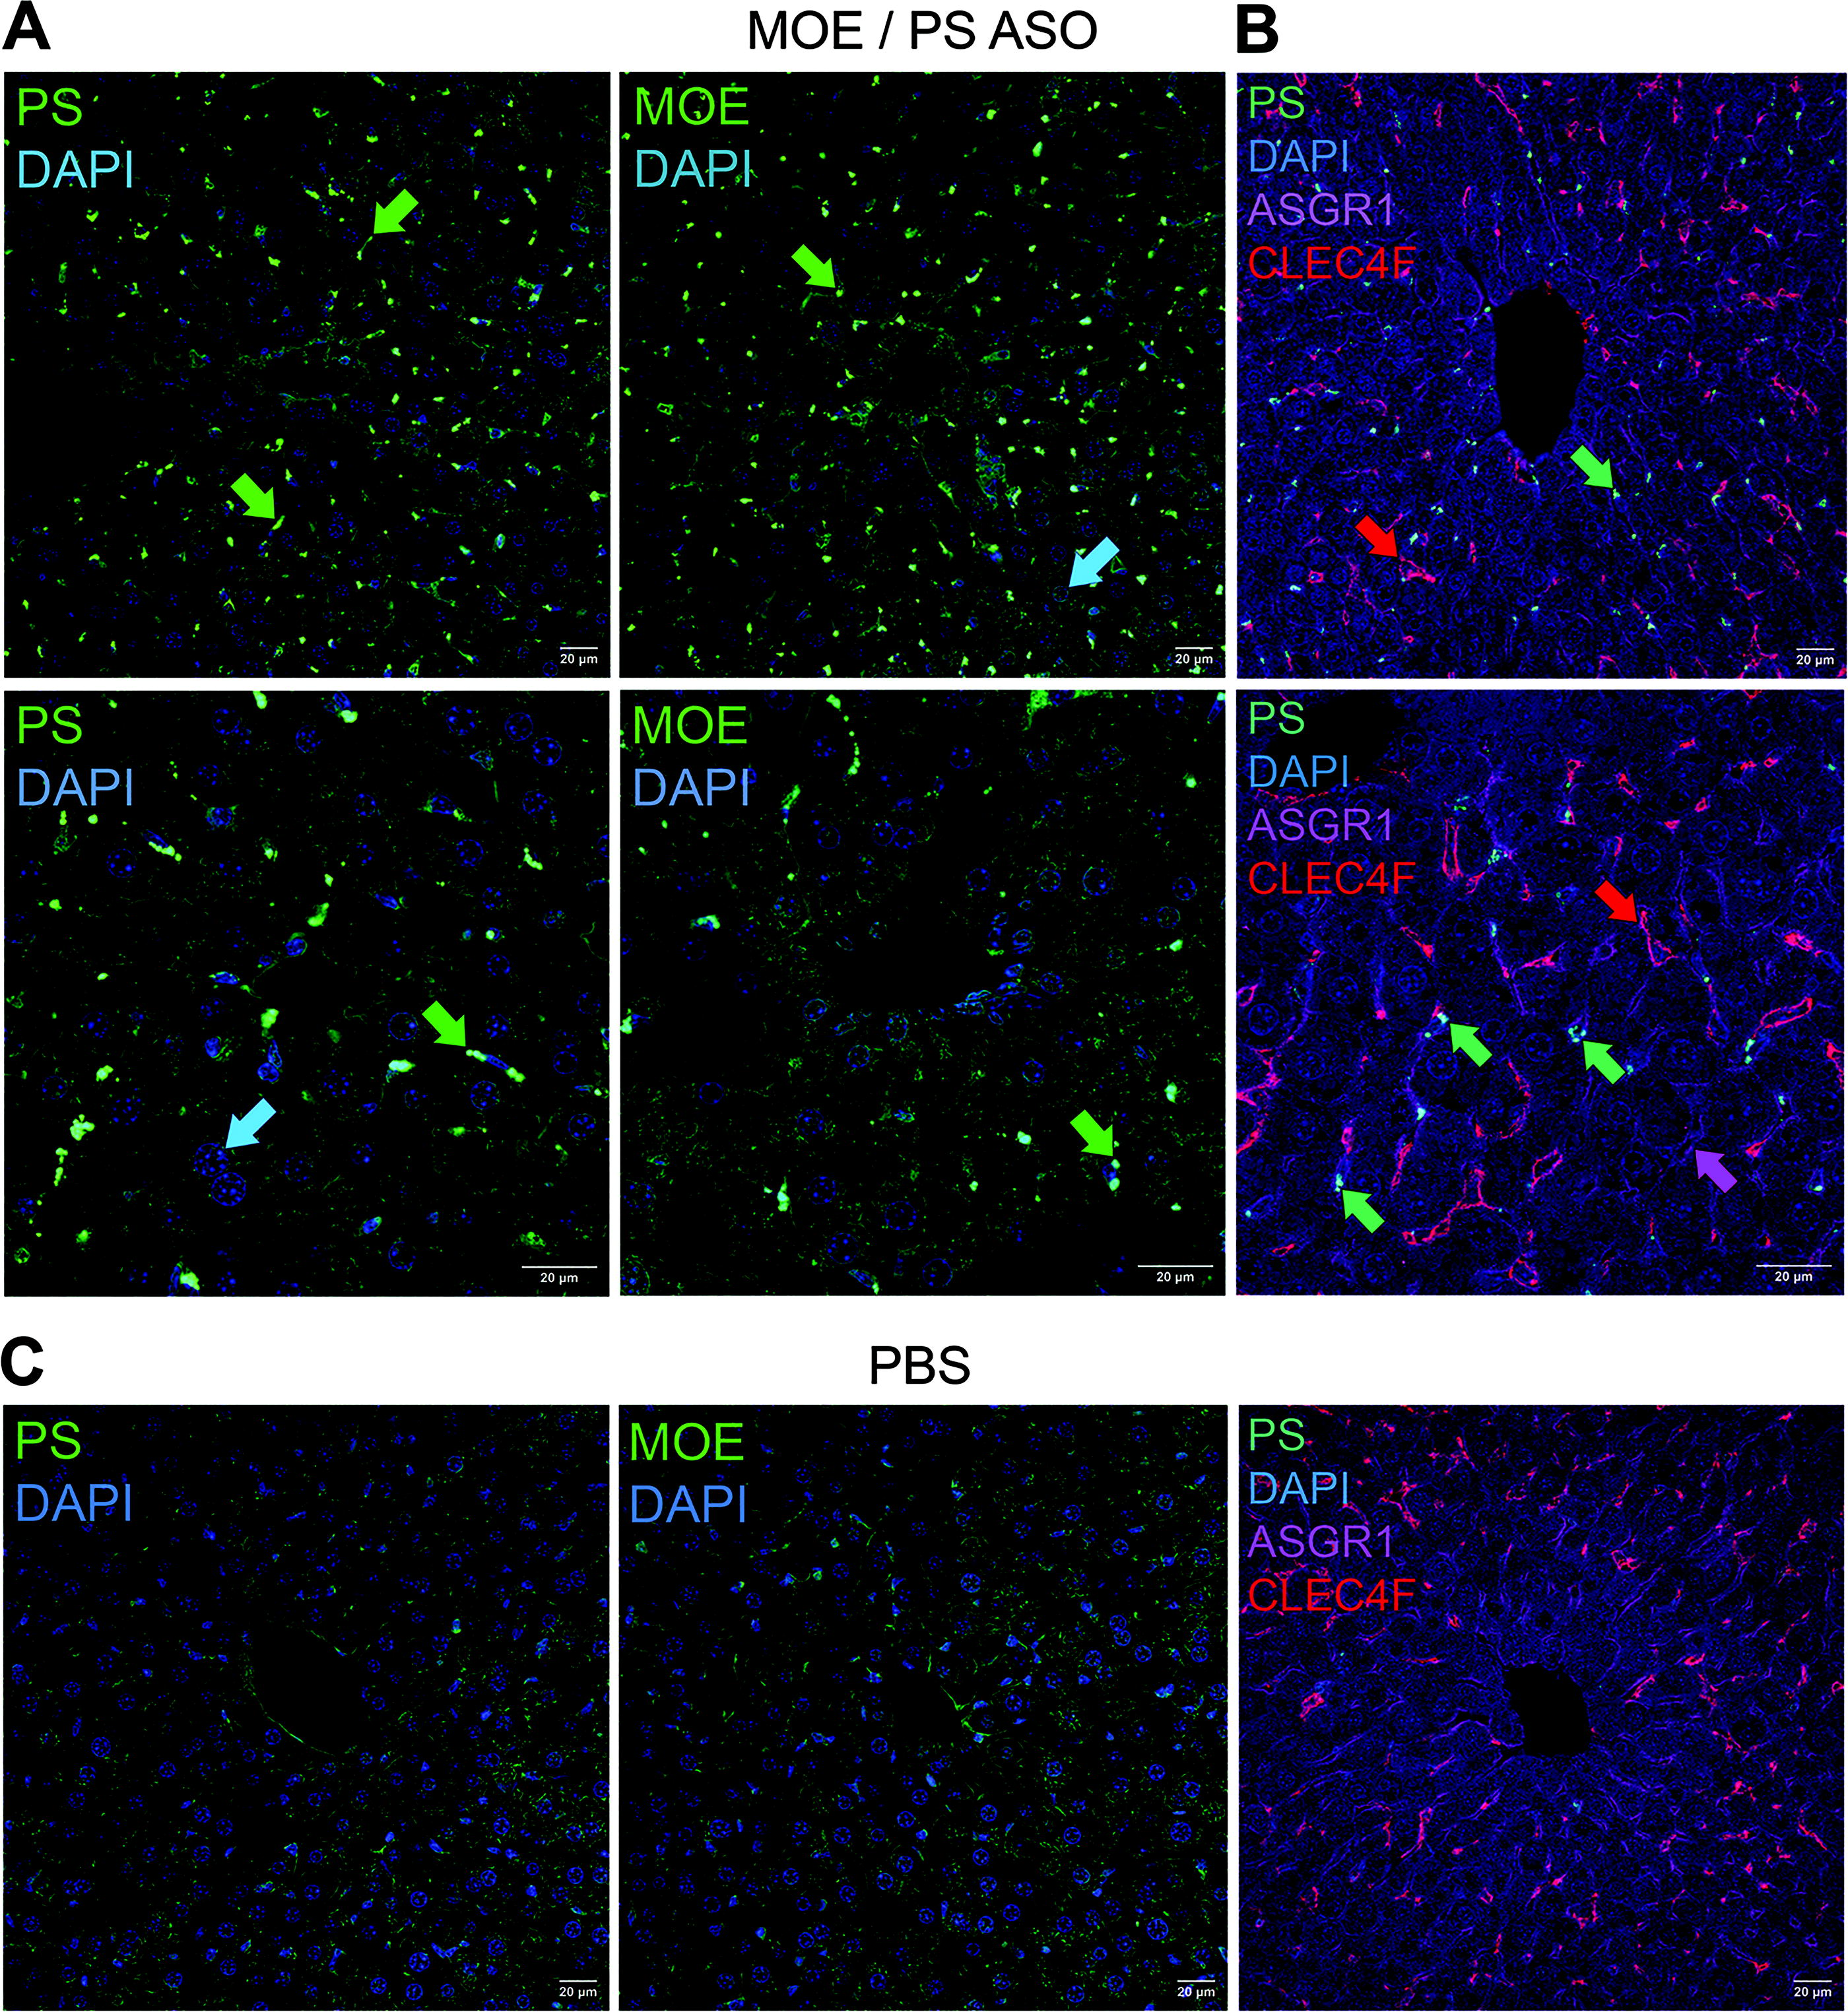
Immunohistochemistry of a systemically delivered ASO in mice.
Discussion
As an increasing number of NATs undergo clinical development, there continues to be a need to improve the quality and accessibility of analytical methods for their detection and quantification. 31 Antibody-based reagents are a critical part of the NAT toolkit, facilitating multiple immunoassay approaches with their inherent sensitivity and specificity. 8 Here, we have focused on benchmarking new antibodies raised against two well-established oligonucleotide modifications, namely PS bonds and the 2′-MOE sugar moiety. Our aim was to provide exemplars of their practical use in cellular and tissue systems and not to generate a highly detailed characterization of what are already proven control NAT reagents. 27 As such, we show consistent and specific detection of ASOs containing the respective modifications in several experimental systems by ICC and IHC. Furthermore, we provide protocols using reagents that are standard to researchers in the academic NAT field, with the added simplicity that the antibodies are not reliant on the ASO sequence itself, thus avoiding designing and optimizing individual sequence-specific probes for detecting multiple targets.
A fundamental feature of assessing NAT efficacy—especially at the early preclinical screening stages—relies typically on RT-PCR, whether for quantification of targeted gene knockdown or a specific splice-site modification. 20 Results from these assays will not only be influenced by multiple intracellular events that surround the kinetics of on-target functionality, but also by the basic efficiency of cellular uptake. 8 Here, we demonstrate that utilizing anti-NAT modification ICC is a simple approach that facilitates the interpretation of data from bulk cell RNA or protein preparations. In particular, where gymnotic delivery is used and lack of the desired efficacy could be, at least in part, a result of poor or variable cellular uptake.32,33 In 3D systems such as spheroids, the same parameters are equally relevant but are exacerbated by the necessity of the NAT to penetrate the structure and move through multiple cell types over time. As such, efficacy testing from spheroids will be confounded significantly by the infiltration of the NAT itself. 34 The data presented here show that 3D cell models are amenable for anti-PS immunostaining after either transfection or gymnotic delivery of an unlabeled ASO. Moreover, although the temporal penetration of an NAT is highly dynamic, it can still be assessed during experimental optimization. This also includes relating dose levels to NAT localization that may have important implications for cellular toxicity. Indeed, we demonstrate here that very modest on-target knockdown occurs in whole spheroids when the ASO can be detected clearly at the periphery of the structure, even after an additional transfection step, likely reflecting the number of cells that have not yet taken up the oligonucleotide. As an alternative, methods such as flow cytometry have been applied to quantify oligonucleotide uptake into spheroids; for example, in a model of Timothy syndrome using human forebrain organoids, uptake of a Cy5-labeled lead ASO was estimated using cell sorting. 25 However, despite successful splice modulation in this system, no data regarding the spatiotemporal distribution of this ASO versus on-target activity can be gained using this approach. Similarly, in a study of iPSC-derived cerebral organoids to model tau mutations, target gene knockdown is reported from bulk cell tissue, although no data regarding the uptake or distribution of the ASO itself are shown. 35 Immunocytochemical approaches in 3D systems thus have the key advantage of utilizing unlabeled NATs, with the option for multiplexing with standardized cell-type-specific markers, a critical aspect of spheroid and organoid characterization.36,37
A major criticism of using amphiphilic fluorophores—such as cyanine dyes—for localization or biodistribution studies is that the tag itself alters significantly the steric bulk and overall charge of the ASO, influencing fundamental biological parameters, including interactions with cellular membranes 12 and even the RNase H1/DNA complex required for target transcript knockdown. 38 Here we validated and quantified the gymnotic uptake of a Cy3-labeled ASO by demonstrating a significant degree of colocalized endogenous fluorescence with the anti-PS or anti-MOE antibody detection; yet it is interesting that some independently localized signals were also visible. This could reflect metabolites of the ASO that contain either modification but where intracellular cleavage of the cyanine dye alone has occurred, as steric blocking of the multiple oligonucleotide epitopes by Cy3 is unlikely. It is also noteworthy that some progress has been made in the generation of fluorescent bases that are structural and functional analogues of their canonical counterparts, with data demonstrating largely minimal effects on native base-pairing and secondary structure. 39 However, such compounds are not part of standard oligonucleotide synthesis workflows and they do not represent the NAT that would be used clinically. Moreover, these analogues still require benchmarking to the lead NATs in any quantitative assays associated with, for example, biological activity or toxicology. 40 Thus, access to non-sequence defined antibody reagents for NAT detection provides a practical solution for these caveats.
With the inherent vulnerability of nucleic acids to exonuclease degradation and the necessity to escape the endosomal system for nuclear or cytoplasmic delivery, only a very small proportion of the intracellular NAT is estimated to be productive. For ASOs, productive activity is thought primarily to occur in the nucleus and a number of studies have attempted to equate on-target efficacy with nuclear localization. 41 This is a technically challenging task, given the expected amount of nonproductive ASO uptake; this assumption is consistent with the very small amount of potential nuclear staining in our immunocytochemical assays from both nuclear and non-nuclear localized transcript targets. Indeed, a detailed cell fractionation study of a 16-mer LNA ASO in HeLa cells demonstrated that the limit of detection of the gapmer in the nucleus by ELISA, after gymnotic delivery at 1 µM, did not result in target gene knockdown. 42 Here we detected strong on-target activity at 10-fold lower concentrations using our LNA/PS ASO, suggesting that quantification of productive nuclear localization of NATs of this potency might have to rely on much higher resolution microscopy or other imaging methods. 43 Studies with fluorescently labeled ASOs show a wide range of reported nuclear distribution, from little or no detection 44 to significant sequestration in defined nuclear compartments, often related to toxicity. 45 Whether there is bias in these studies due to the detection of fluorophore-containing ASO metabolites, or even physical interactions with nuclear import mechanisms, is unclear. Yet such phenomena are also likely dependent on multiple factors, such as the ASO sequence and chemistry, the cell type assayed, and the timing and dose of oligonucleotide exposure; it will be interesting in the future to compare some of these less well-reported localization events between fluorescently labeled and unlabeled oligonucleotides by ICC.
Another key advantage to immunohistochemical methods for NAT detection is their use for in vivo biodistribution studies. Here, we show specific accumulation of a 2′-MOE-containing gapmer in nonparenchymal cells of the liver after subcutaneous dosing by multiplex coimmunohistochemical antibody staining. Of note, these data are consistent with previous studies in the mouse liver, where a considerable proportion of an unconjugated ASO remains in cells other than hepatocytes after systemic delivery. 30 A more recent, detailed study quantified biodistribution of a gapmer used clinically by RNAscope in situ hybridization combined with IHC and AI-driven image quantification. These data revealed that only 13% of this particular ASO localized to hepatocytes, with the remainder in nonparenchymal cells. 46 As such, our data are also consistent with these findings and we propose that the well-established antibody staining protocols applied here are potentially less technically challenging for researchers than optimizing and multiplexing sequence-specific in situ hybridization probes with IHC.
Conclusions
In summary, we provide data to validate antibodies against two NAT modifications commonly applied experimentally and clinically, including the first description of immunostaining results from anti-MOE reagents. Together, these data illustrate the utility of these reagents against the increasingly common number of NATs designed during preclinical optimization, or those destined for the clinic, with partially modified structures. 4 The panel of antibodies against backbone or sugar moiety modifications is being expanded currently to include 2′-OMe 16 and 2′-Fluoro, with the aim that this now proven method of monoclonal library generation could be applied to any future generation of NAT modifications; this is critical for the field as the number of advanced chemistry options and clinical approvals continues to rise.
Footnotes
Acknowledgments
The authors thank the staff in the MLC, Harwell, for animal handling and sample collection, in addition to the MLC histology group for tissue processing. They thank T. Giardiello for assistance in the preparation of ELISA figures and M. Cadeddu and A. Correa-Sánchez for technical assistance and advice. The Rockland Immunochemicals, Inc. information presented is covered under US Provisional Patent Application No.: 63/547,067. ModDetect™ is a trademark of Rockland Immunochemicals, Inc.
Author Disclosure Statement
I.F., X.W., and P.L.O. have no disclosures. S.A.F., D.P.C., and C.A.A. are employees of Rockland Immunochemicals, Inc.
Funding Information
Nucleic Acid Therapy Accelerator is supported by the Medical Research Grant MC_PC_20061.