
Abstract
This paper evaluates the impacts of income inequality on life expectancy in African countries. The empirical analysis has been performed on a panel dataset of 52 African nations covering the period of 1995 to 2018. For estimating the inequality-health relationship, I have used Two-Stage Least Squares (2SLS) technique and a Panel Error Correction Model (PECM). The long-run cointegrating relationship was estimated using a Panel Dynamic Ordinary Least Square (PDOLS) estimator. The outcomes suggest that income inequality has negatively affected life expectancy at birth in the African continent overall. Though income inequality seems to have improved health in the short-run, in the long-run, income inequality had deleterious effects. A series of steps has been followed to check the soundness of the result of the main empirical examination and it is confirmed that the results are robust.
Keywords
Introduction
“A nation will not survive morally or economically when so few have so much and so many have so little” —Bernie Sanders (US Senator)
In 2011, the World Economic Forum established that the income inequality and corruption are the two most serious challenges in front of the world (World Economic Forum, 2011). The World Social Report 2020, published by UNDESA asserts that the inequality is rising for more than 70% of the global population, thwarting socio-economic development. It has been well over four decades since Rodgers (1979) reported the associations of health outcomes and income inequality, in his seminal work. His work, along with Wilkinson’s (1992, 1996), gained traction and inspired further research on the subject matter in the following decades (e.g., Pickett & Wilkinson, 2015; Truesdale & Jencks, 2016). Apparently, one of the several channels via which income inequality proves to be detrimental to the economy is via the health facet of human capital. As mentioned by Wilkinson (1996), the distribution of income is “one of the most powerful influences on the health of whole population in the developed world to have come to light.”
Not losing sight of all these facts, Africa continues to be afflicted by overwhelmingly uneven income and wealth distributions, in spite of the impressive economic progress in the recent decades. In fact, a new UNDP report found a staggering figure that 10 of the world’s 19 most unequal countries are in sub-Saharan Africa. However, very little to no attention has been given on examining the impacts of income inequality on the health aspect of the human capital in Africa. This paper aims to empirically analyze the health impacts of income inequality in the entirety of the African continent, extensively. The empirical analysis has been performed on a panel dataset of 52 African nations covering the period of 1995 to 2018, inclusive. Life expectancy at birth has been used as the proxy for health conditions. Life expectancy at birth is a popular and frequently used indicator to describe longevity along with population health (Fazle Rabbi, 2013; Sharma, 2018). It is an important and convenient summary measure of health and mortality and more intuitive than mortality rates and other health proxies (Klenk et al., 2007). Hence, because of the summarizing capability of population health by covering a wide range of aspects, and best data availability, life expectancy at birth is chosen over other health proxies. For estimating the relationship, IV-2SLS technique and a Panel Error Correction Model (PECM) have been employed. The instrument used for inequality in the IV-2SLS estimation is agricultural land per capita and the long-run cointegrating relationship is estimated using a Panel Dynamic Ordinary Least Square (PDOLS) estimator. This study contributes to the existing literature in the following ways: (i) it covered the entire African continent, (ii) used a large dataset covering a longer period, (iii) introduced a new instrument for inequality, (iv) employed never used estimation techniques for this particular subject matter in the concerned location, and (v) provided a detailed and up-to-date literature review.
The rest of the paper is structured as follows: Section “Literature Review” reviews the existing literature; Section “Research Methods” presents the empirical analysis to shed light on the theory, Section “Empirical Results and Discussion” contains the empirical results and discussions, and Section “Conclusion and Policy Implications” draws the conclusion of the study and sheds light on the policy implications.
Literature Review
Two primary hypotheses prevail to illustrate the ecological association between population health and income inequality: the absolute income hypothesis and the contextual inequality hypothesis, also known as the “Wilkinson Hypothesis.” The absolute income hypothesis maintains that the uneven income distribution does not directly affect individual health. Instead, the association between income inequality and population health is purely an outcome of a curvilinear relation between income and individual health, that is, a diminishing return of health to income (Deaton, 2003; Gravelle, 1998). The argument is depicted in Figure 1. (The hypothesis has been explained with reference to Luo and Xie (2020).) Assume that health is nonlinear concave function of income, such that an increase in income causes diminishing returns of health and, that a hypothetical economy consists of only two equal-sized cohorts, the rich with income
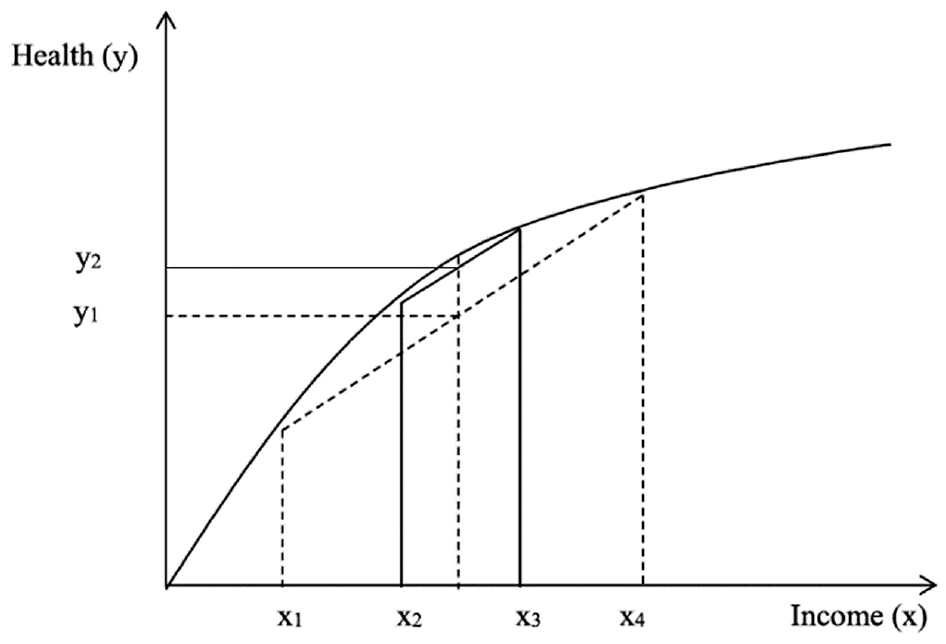
Individual-level relation between income and health.
On the other side, the Wilkinson hypothesis advances a direct, contextual and causal income inequality impacts on the health of individuals, over and above underlying individual-level socio-economic determinants of health, inclusive of individual’s income (Wilkinson, 1992, 1996, 2001). Income inequality stands as a hindrance in the path of nutrition consumption and accessing healthcare services due to disproportionate income emanating in poor households (Birdsall et al., 1995). Health conditions become aggravated in the case of income inequality even beyond the absolute poverty (or, read income) due to the psychological consequences of social and status comparisons, rise in violent crimes and murders (Pickett, Mookherjee, & Wilkinson, 2005), increased levels of obesity (Pickett, Kelly, et al., 2005), higher levels of infant mortality (Spencer, 2004) and bad self-reported health after adjusting for poverty levels and societal wealth, which in turn, reduces life expectancy in both developed and developing economies (Babones, 2008; Hales et al., 1999; Pei & Rodriguez, 2006; Rasella et al., 2013; Subramanian et al., 2003). It is posited that disparities in income distribution deleteriously impacts health outcomes of both the poor and rich via the psychosocial, structural, social capital or neo-material pathways (Aida et al., 2011; Elgar, 2010; Kawachi & Kennedy, 1997; Layte, 2012; Lynch et al., 2000; Mellor & Milyo, 2002; Pickett & Wilkinson, 2015; Ribeiro et al., 2017; Rözer & Volker, 2015; Subramanian & Kawachi, 2004; Torre & Myrskylä, 2011; Wilkinson, 1996, 1999). Psychosocial factors can be explained as the feeling of relative deprivation due to broadened gaps in financial conditions which results in frustration, stress, shame, and anxiety, which in turn, induces self-sabotaging behaviors like smoking and alcohol consumption (De Botton, 2004; Eibner & Evans, 2005; Wilkinson, 2001). Disproportionate income distribution might reduce social capital as well. Elgar (2010) discovered that income inequality was strongly associated to interpersonal trust, and that reduced interpersonal trust was linked to higher adult mortality, as well as diminished life expectancy. It has also been found that societies that condone higher levels of income inequality, tend to underinvest in wide array of physical, human, health and social infrastructures that improves population health (Detollenaere et al., 2018; Kaplan et al., 1996; Pearce & Smith, 2003; Rostila et al., 2012; G. D. Smith, 1996). Krugman (1996) and Deaton (2003) shed light on why higher income inequality causes lower social spending. They explained that uneven income distribution intensifies the divergence in interests between cohorts of different financial conditions.
However, the causal effects of income inequality on health are not unanimously agreed on. The proponents of the “Income Inequality Hypothesis” proclaimed that it was the income distribution rather than the absolute income that governed the health consequences (Runciman, 1966; Wilkinson, 1996). In fact, a lot of studies support the claim (e.g., Le Grand, 1987; Rasella et al., 2013; Rodgers, 1979). On the opposing end, doubts have been cast on the robustness of this relationship. The reason cited was that if the individual health is a non-linear function of income, then income inequality might be spuriously correlated with aggregate health measures (Gravelle et al., 2002; Judge et al., 1998). Mellor and Milyo (2002) too made their skepticism clear by arguing that it is necessary to use individual-level data and individual income in the regression models to have a clear picture of the causal effect of income inequality on health. Many researchers did not find any link between the two variables as well (e.g., Grönqvist et al., 2012; Judge, 1995; Wen et al., 2003). A multitude of empirical researches have been conducted since forever, to understand the income inequality-health hypothesis and consequently, shed light on how income distributions impact the human capital from health perspective, across countries. It can be safely asserted that, just like the takes on the subject matter by different economists are not unanimous, the empirical findings are not uniform as well. A broad spectrum of findings exists, with most conforming to the negative impacts of income inequality on health, some find no relationships and some has conclusions exactly on the opposite end. For convenience in analyzing the existing studies, the review has been presented in Table 1 below.
Empirical Studies on Health Impacts of Income Inequality.

Note. AAMR = age adjusted mortality rate; ADL = activities of daily living; BMI = body mass index; CHC = chronic health conditions; CSMR = cause-specific mortality rate; DCs = developed countries; GI = Gini index; HUI = health utility index; IMR = infant mortality rate; IRHI = income-related health inequality; LDCs = less developed countries; LE = life expectancy; MAMC = middle-upper arm muscle circumference; SRH = self-rated health; TB = tuberculosis; UMR = under-5 mortality rate; WHR = waist-to-hip ratio; WHZ = weight for height-Z-score.
As seen in Table 1 above, several researchers have attempted to find the impacts of income inequality on population health over the years. Multitude of estimation techniques, different proxies and diverse samples have been used by different authors to shed light on the issues. Almost all the researchers unanimously agree that income inequality is noxious to population health. Only a handful of researchers could not establish a link or found a weak link between inequality and health. The differences in quantitative impacts or no conclusive links could be attributed to different samples, estimation techniques, and different proxies for health and inequality and varying dynamics of certain economies.
Research Methods
Model Specification and Variable Descriptions
The impact of income inequality on life expectancy has been studied empirically for the case of African economies. Both static and dynamic analysis using panel data, were done to capture the impacts extensively.
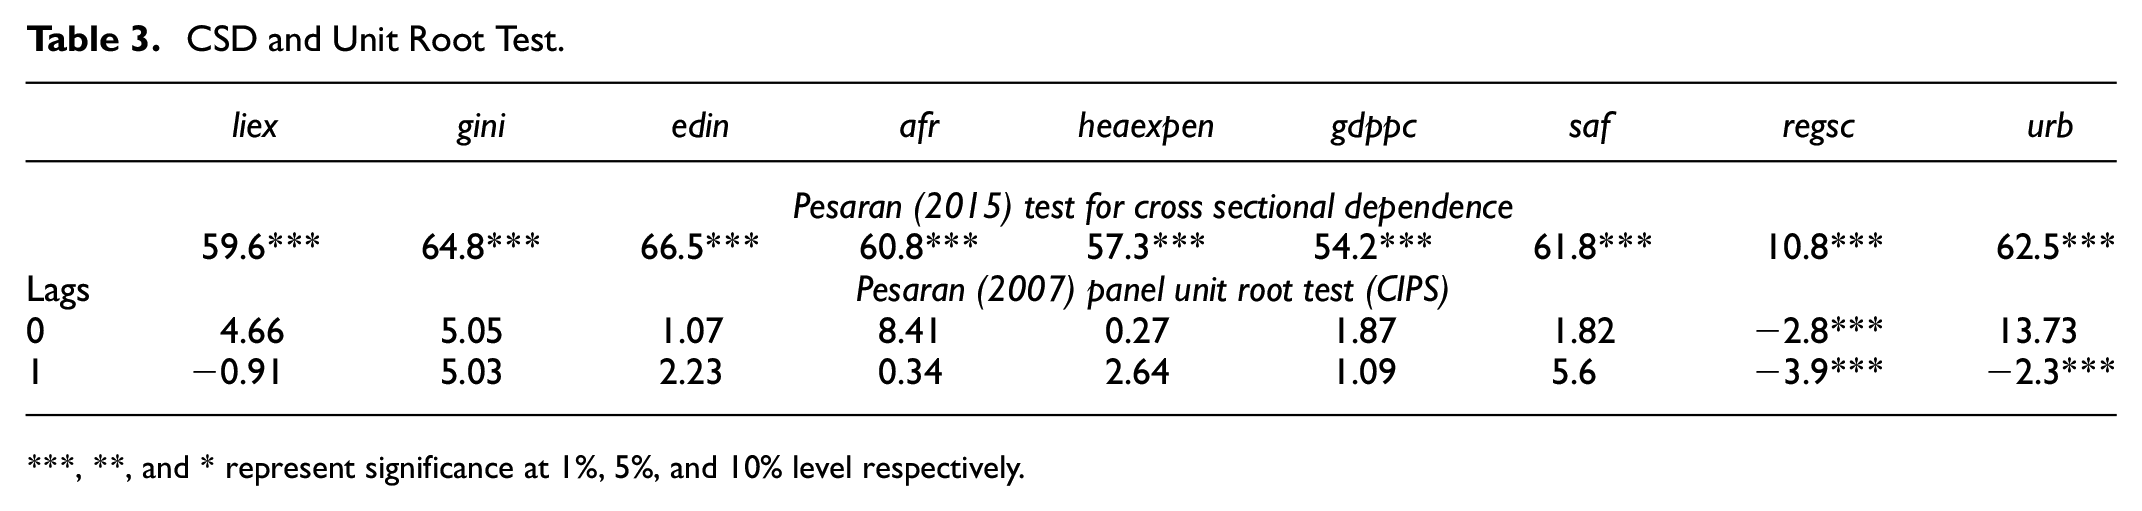
For static analysis, this article resorts to IV-2SLS estimation technique. The model used is specified as follows:


For the dynamic counterpart, the long and short-run relations between public health expenditure and growth will be estimated using a Panel Error Correction Model (PECM) of the form as follows:

where
The long-run relationship estimation implies that there exists a cointegrating relationship between the variables and that the series are non-stationarity. It is also to be taken into account that in longer panels, individual time series are probably affected by the same common factors, resulting in the presence of CSD. Hence, a couple of testing procedures are to be carried out preliminarily. I begin by testing for the presence of CSD following Pesaran (2015) and subsequently, test for the presence of unit roots. At first, the CIPS test developed by Pesaran (2007) is used for series with CSD. The CIPS test belongs to the second-generation panel unit root tests and is robust in presence of CSD. For testing the existence of cointegration, Kao cointegration test has been used and the lags were selected by AIC criterion.
The cointegration relation of equation (3) is estimated using Panel Dynamic OLS (PDOLS) estimator, the lags and leads of which were selected by AIC criterion and Fully Modified OLS estimator. By adding lags and leads to the variables in (3), these estimators control for potential simultaneity bias. The parametric DOLS is preferred to the non-parametric FMOLS in that the latter (unlike the former) imposes additional requirements that all variables should be integrated of the same order and that the regressors themselves should not be cointegrated. Hence, I will be mainly using PDOLS estimator. The FMOLS estimation outputs are provided just to observe whether there are any contradictory results. I, then estimate the PECM specification of equation (4) by using a standard fixed effects estimator.
Instrument Core Identification Strategy
Instrumenting inequality is called for because the outcome variable affects inequality in certain ways. It is an established fact that human capital is a necessary determinant of overall economic and individual well-being. Narrowing down on the health aspect of human capital, poor health can decline productivity by limiting one’s ability to work, inhibiting educational attainment and hence, lead to medical debts and bankruptcy. This, in turn, thwarts income generation and aggravates income inequality situations. Evidences exist attesting to the direction of causality from health to income (e.g., J. P. Smith, 1999). Henceforth, I propose agricultural land per capita as an instrument for inequality.
The single most crucial activity in Africa by far is agriculture. The agricultural sector provides employment to about two-thirds of the continent’s working population and for each country, contributes an average of 30% to 60% of the GDP. Provided the fact that agriculture is the main livelihood of the people, agricultural land is most likely to be the key factor behind income generation, or consequently, the income inequality. A high correlation coefficient (0.3959) between the instrument and income inequality confirmed the potential explanatory power of the instrument. However, contrary to the argument that more agricultural land available to people would generate more income and reduce income inequality, the correlation was found positive. This is entirely plausible and the explanations are; firstly, the poorer population might own too less land to generate sufficient income. The entire land produce is used up for consumption by the owners. That brings me to the second point. Even if larger land areas are available, the poor land owners might not have enough means to produce at a sustainable level. In such cases, large land areas might become a burden. Thirdly, the data on agricultural land per capita might not capture the actual proportion of land ownerships. There exist uneven distributions of land owning to poor land governance and land reform policies. Hence, a well-off section of the population generates more income from the land while the conditions of the poor remain unaltered. Lastly, increasing population, disguised unemployment, absence of well-defined labor and agricultural laws and criminal activities like land grabbing leads to available agricultural land becoming a counterproductive factor for income inequality. There also exists empirical evidence that agricultural land can actually increase inequality (Nguyen, 2013).
The suitability of an instrument crucially depends on whether the instrument satisfies the exclusion restriction. The exclusion restriction for my identification strategy is satisfied if the instrument only affects life expectancy via income inequality and not directly. In my view, the condition holds firstly because agricultural land per capita has never been used as an explanatory variable for human capital formation or life expectancy. Secondly, in the events where agricultural land might lead to closely knit protected communities and enough productions for sustenance of life, life expectancy is likely to increase, which implies results that are biased in the direction opposite to the findings. Lastly, small land possessions are most likely to yield enough to impact life expectancy in itself. Additionally, almost no correlation (correlation coefficient: −0.042) was found between the instrument and outcome variable which entrenched the suitability of the instrument.
Data Type and Source
The study involves annual data from a panel of 52 African countries, ranging over the period from 1995 to 2018. All the data have been collected from World Bank World Development Indicators (2020 Q4 Edition), Polity5, UNFAO, UNDP HDR, SWIID, and Penn World Table (version 9.1). The data for the regressions of historical context were collected from Clio Infra database.
Empirical Results and Discussion
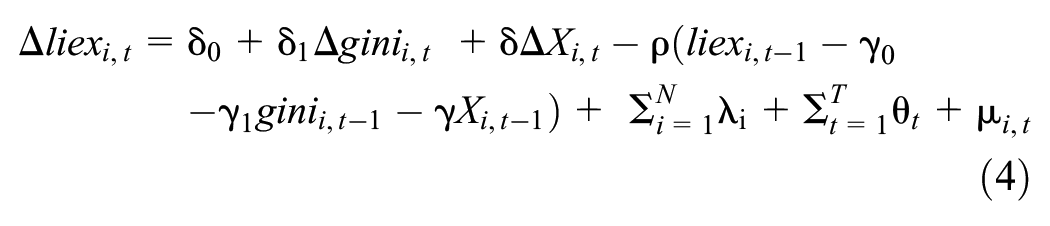
The IV-2SLS estimation outputs are plotted in Table 2 along with the first stage regression and other necessary test results.
IV-2SLS Estimation.
Note. Standard errors are shown in [].
, **, and * represent significance at 1%, 5%, and 10% level respectively.
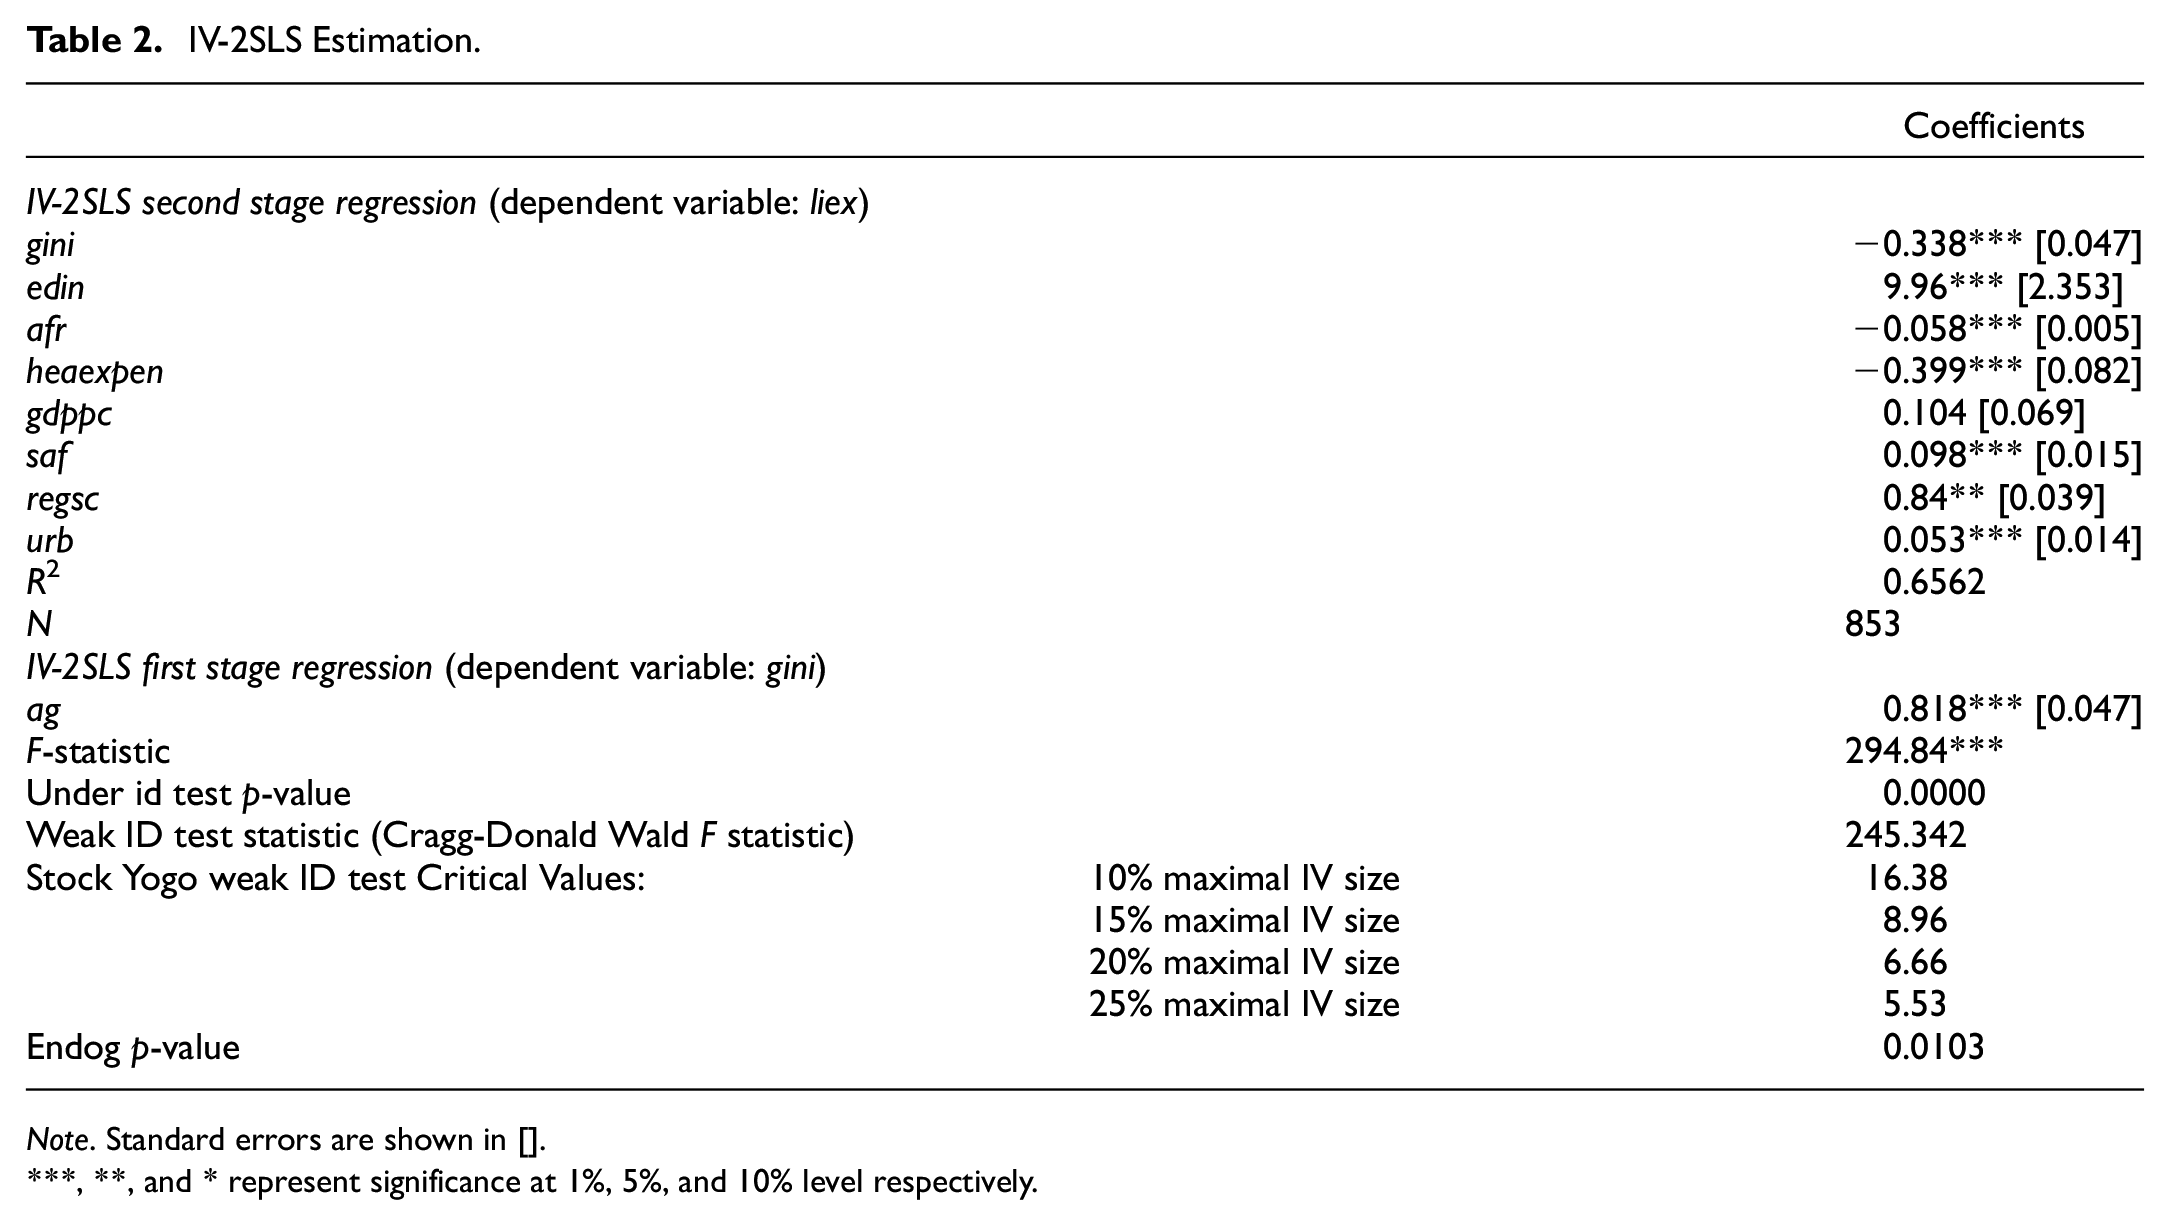
The dynamic estimation analysis is initiated by interpreting the test results of Pesaran (2015) test for CSD. From the first panel of Table 3, the outputs show that all the series display significant CSD.
CSD and Unit Root Test.
, **, and * represent significance at 1%, 5%, and 10% level respectively.
Following the CSD test, the unit root tests are done. The lag specification is ranged from 0 to 1. The null hypothesis being existence of unit root, is accepted for all series with non-significant test statistics. Hence, the variables with significant test statistics (
The IV 2SLS estimation outputs shows that, the coefficient of the Gini variable is negative and significant at the 1% level which implies that increasing income inequality has a detrimental effect on life expectancy in the African population. A unit increase in income inequality leads to 0.34 unit decrease in life expectancy. As expected, education is found to be the most crucial determinant of life expectancy and indispensable to enhancing life longevity (a unit increase in education index increases life expectancy by 10 years). The coefficient of GDP per capita is found to be slightly positive (0.104) and economically significant but statistically insignificant. This indicates that economic growth in this region is not significantly offsetting the noxious effects of income inequality on health. In addition, access to safe drinking water, regime score and urbanization are found to have causal relationships with population health. All the outcomes are as par expectations except for health expenditure which has a significantly negative coefficient. Possible reasons could be inefficient spending, poor executions or non-optimal implementation of health schemes. The test results confirm the suitability of the instrument. The F tests in the first stage regressions remain highly significant. The under-identification test statistic was found to be significant at 1% level implying no under identification. The weak identification test statistic is larger than all the stock-yogo weak id critical values implying no weak identification. Lastly, a significant endogeneity test statistic represents there is endogeneity.
The outcomes of the Kao cointegration tests (optimal lags selected by AIC criterion) are displayed in Table 4. Skimming through the test results, we see that three out of five test statistics are significant and hence, can confirm that there exists a long-run cointegration relationship in equation (3).
Kao Cointegration Test.

, **, and * represent significance at 1%, 5%, and 10% level respectively.
Estimation outcomes for (3) are shown in Table 5. The lags and leads for the PDOLS model are chosen as per AIC criterion. The model estimates a negative coefficient for income inequality and is highly significant at 1% level. The estimation output of the FMOLS model is mostly similar. The long-run estimations are qualitatively similar to the IV estimation. Hence, a causal relationship can be confirmed.
Inequality and Life Expectancy: The Long-Run Relationship.

Note. Standard errors are shown in [].
, **, and * represent significance at 1%, 5%, and 10% level respectively.
In Table 6, the estimation results of equation (4) are shown.
Income Inequality and Life Expectancy: PECM.
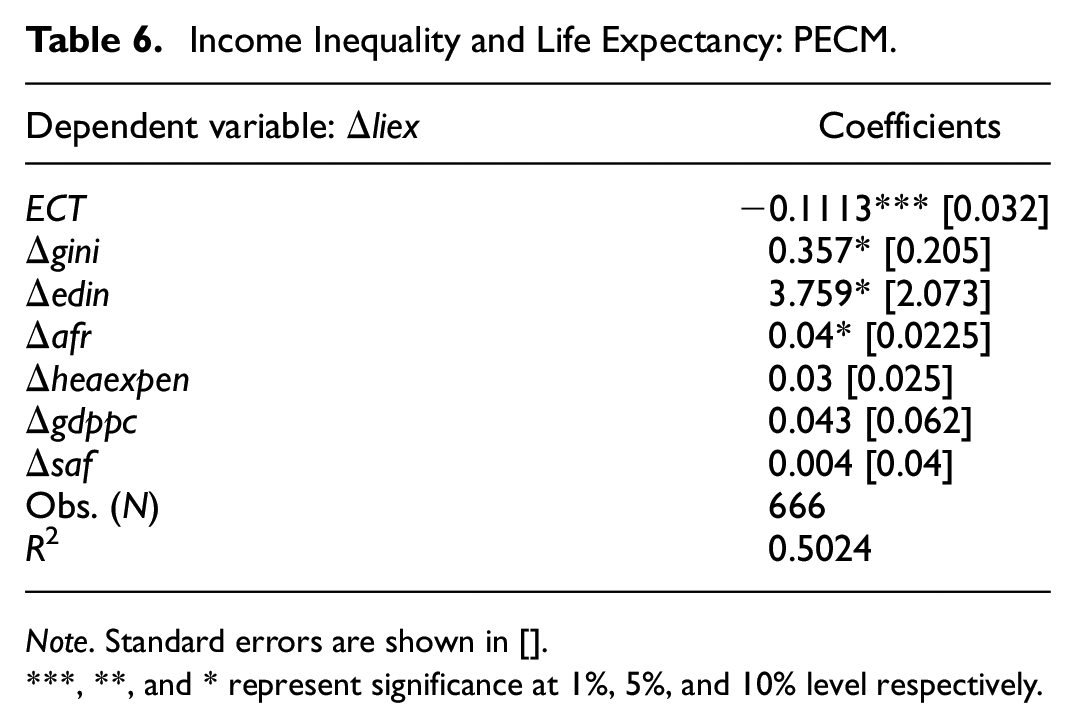
Note. Standard errors are shown in [].
, **, and * represent significance at 1%, 5%, and 10% level respectively.
From the PECM outputs, it is observed that income inequality increased life expectancy in the short-run, which is a surprising result. A potential explanation for this outcome could be that in the short-run, the effects of the well-off section of the population is stronger or that the relationship is spurious. The coefficient of the ECT is negative and significant at the 1% level indicating that the short-run disturbances are persistent and that a deviation from the long-run equilibrium is corrected by approximately 11.13% over the following years. In other words, there is long-run convergence toward equilibrium.
The empirical finding of this study converges with the general consensus that income inequality has negative health effects. The finding especially corroborates the research of Messias (2003), Odusanya and Agboola (2017), Odusanya and Akinlo (2021), Pop et al. (2013), Rasella et al. (2013), Rodgers (1979), Walberg et al. (1998), and Wilkinson (1992) who found strong evidences that income inequality reduces life expectancy in their respective samples. I find strong statistical evidence that income inequality reduced life expectancy in the African continent. The finding is in-line with the existing literature and there are no noticeable deviations. Hence, it is conclusive without doubt that income inequality is deleterious to population health in both developed and developing economies.
Robustness Check
In order to check the robustness of the empirical findings, I resorted to fixed effects, random effects and pooled OLS estimators. The pooled OLS estimations were carried out with clustered standard errors by countries, given that standard errors are correlated among countries by construction. The outcomes are mostly similar (Appendix 4). Additionally, to have a brief historical context about the life expectancy-inequality relationship, data were collected between the period of 1820 and 1990, inclusive. However, the dataset was really thin due to lack of data availability. All the available variables and observations were included. No matter the inaccuracies arising due to less available control variables and data points, the results still confirm that income inequality has been inimical to life expectancy, keeping in mind the negative coefficients of the independent variable of interest (Appendix 5).
The multiple-step checks confirmed the robustness of the empirical findings. Hence, we can safely establish the answer of the primary research question that inequality has negative impacts on human capital or precisely, life expectancy at birth in the African countries.
Conclusion and Policy Implications
Comprehending the relevance and the impacts of diminishing socioeconomic inequalities, and in particular income inequality, in developing countries is of paramount importance. Inequality is detrimental not only from socioeconomic perspectives, but also for the health conditions of a population. Bearing the poor income inequality conditions in Africa and mediocre performance to ameliorate the condition in mind, this paper investigates the impacts of income inequality on the health aspect of human capital in the African continent.
The empirical analysis was carried out on a panel dataset consisting of data from 52 African nations, covering the period of 1995 to 2018. Life expectancy at birth has been used as measure for the population health. The relationship has been estimated using IV-2SLS estimation and a Panel Error Correction Model. Agricultural land per capita was used as the instrument for the Gini index. The long-run cointegrating relationship was estimated using PDOLS estimator. The outputs of both the static and dynamic estimation models suggested that income inequality has negatively affected life expectancy at birth. Though a positive short-run causal relationship was established, in the long-run, income inequality was prejudicial to population health. The robustness of the finding was proved following a series of steps.
However, the study is not free of shortcomings. Due to lack of data availability, the dataset had fewer observations and multiples gaps in cross sections. Hence, enhanced panel cointegration tests like Westerlund could not be performed. For the same reason, I could not perform dynamic CCE estimation which is robust in presence of cross-sectional dependence, even though cross-sectional dependence was confirmed. The data availability problem also led to dropping out multiple cross sections in the PDOLS estimation. Hence, there potentially exists certain degrees of inaccuracies in the dynamic analysis. Lastly, the dynamic model wasn’t checked for endogeneity, or to be precise, the direction of causality. Further scopes on studies in this area includes finding more data, using more inclusive indices of income inequality, using household-level data for better policy formulation, checking the direction of causality and if there exists any reverse causality, more advanced estimation methods like CCE-GMM estimation should be employed finding suitable instruments.
Policy Implications
Despite years of rapid growth, Africa remains afflicted with large scale income disparities. Confirming the pernicious impacts of income inequality on population health in Africa, I suggest programs and measures that ensure sufficiency of income and guarantee equitable income distribution to be the foundational components of the economic policies of the African governments. My study also finds education, access to safe drinking water, and healthcare facilities to be the most significant enhancer of life expectancy in Africa. As per UN reports, not only is education inaccessible to a large chunk of the population but also most of Africa’s training and educational programs suffer from poor-quality learning and teaching, along with exclusion and inequalities at all level. In addition, ILO reports that Africa is lagging behind the areas concerning wages, social security, health, human resource development and education amongst other. Accordingly, policies addressing accessible educational facilities, healthcare facilities and safe water, as well as improving economic and political governance are the practical subsequent steps.
Footnotes
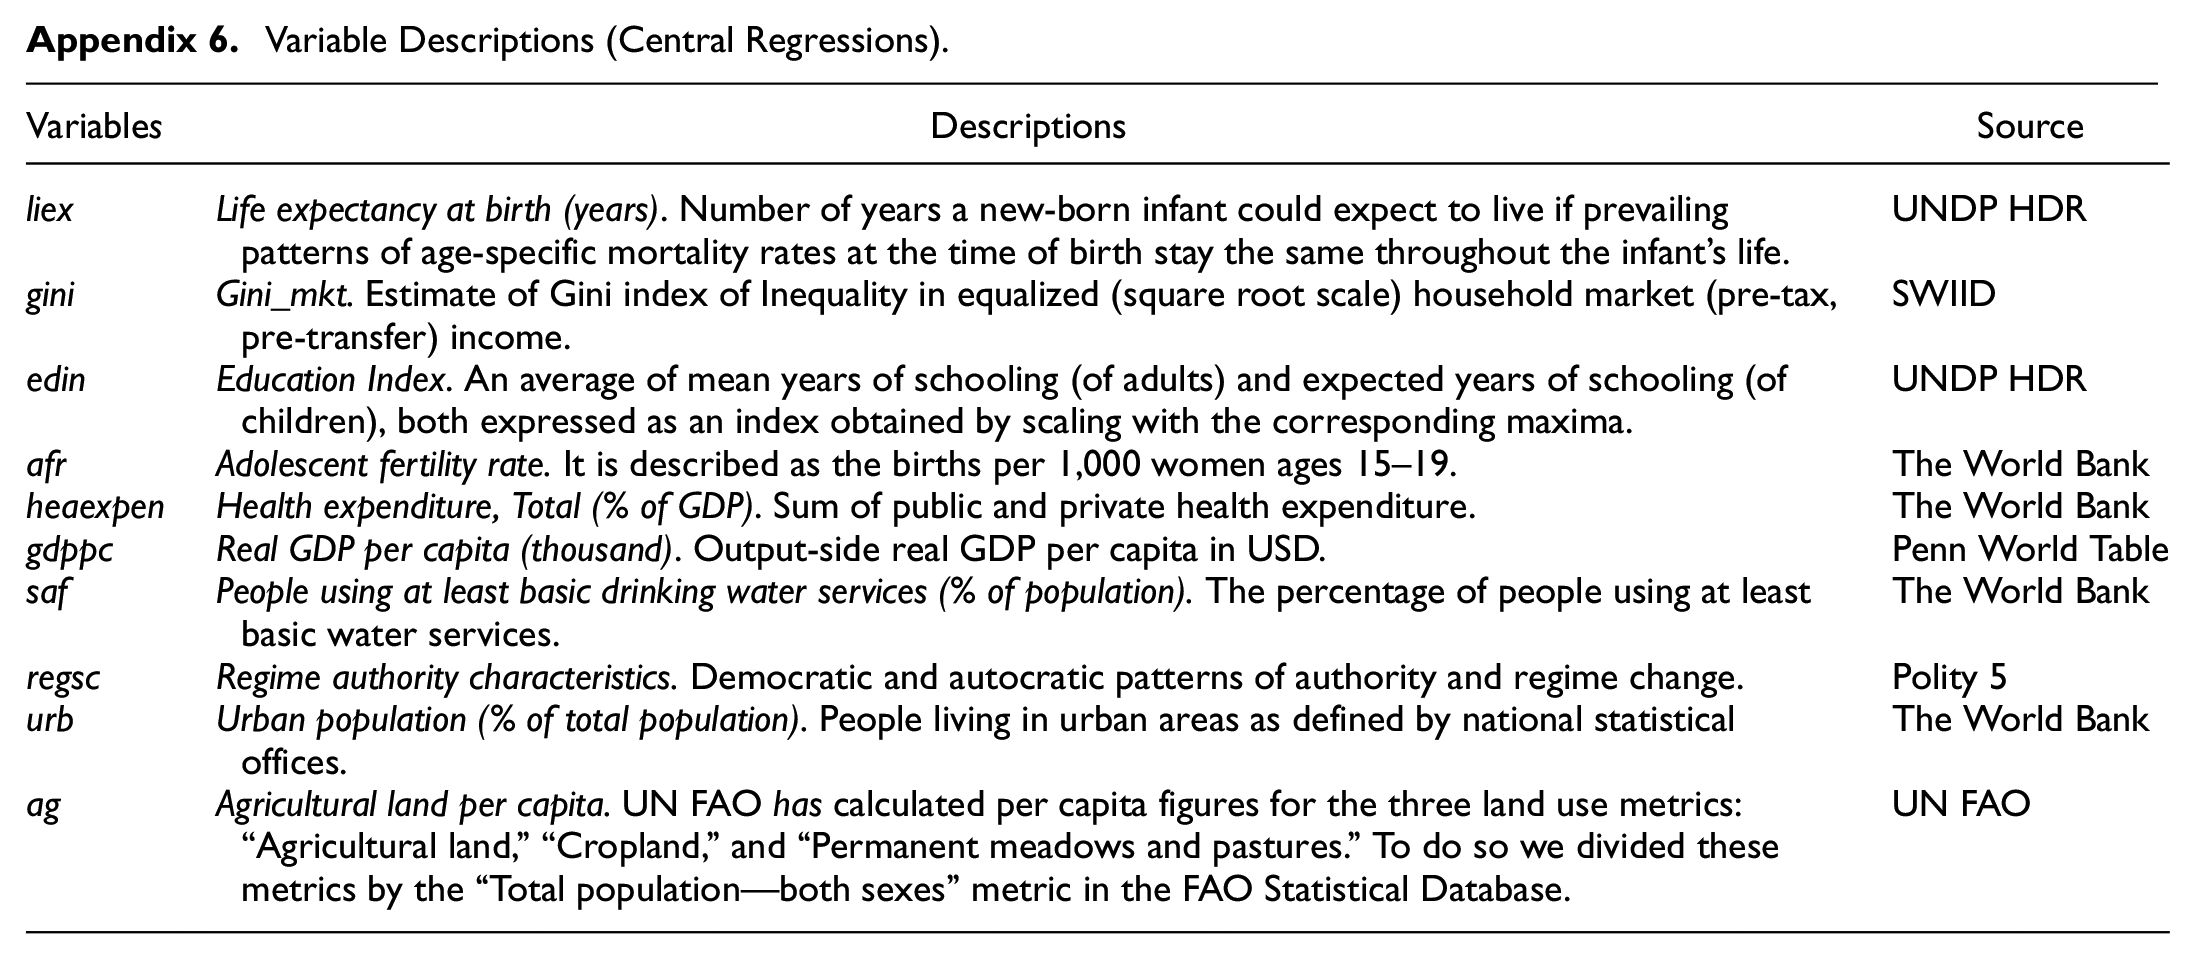
Appendices
Variable Descriptions (Central Regressions).
| Variables | Descriptions | Source |
|---|---|---|
| Life expectancy at birth (years). Number of years a new-born infant could expect to live if prevailing patterns of age-specific mortality rates at the time of birth stay the same throughout the infant’s life. | UNDP HDR | |
| Gini_mkt. Estimate of Gini index of Inequality in equalized (square root scale) household market (pre-tax, pre-transfer) income. | SWIID | |
| Education Index. An average of mean years of schooling (of adults) and expected years of schooling (of children), both expressed as an index obtained by scaling with the corresponding maxima. | UNDP HDR | |
| Adolescent fertility rate. It is described as the births per 1,000 women ages 15–19. | The World Bank | |
| Health expenditure, Total (% of GDP). Sum of public and private health expenditure. | The World Bank | |
| Real GDP per capita (thousand). Output-side real GDP per capita in USD. | Penn World Table | |
| People using at least basic drinking water services (% of population). The percentage of people using at least basic water services. | The World Bank | |
| Regime authority characteristics. Democratic and autocratic patterns of authority and regime change. | Polity 5 | |
| Urban population (% of total population). People living in urban areas as defined by national statistical offices. | The World Bank | |
| Agricultural land per capita. UN FAO has calculated per capita figures for the three land use metrics: “Agricultural land,”“Cropland,” and “Permanent meadows and pastures.” To do so we divided these metrics by the “Total population—both sexes” metric in the FAO Statistical Database. | UN FAO |
Acknowledgements
I want to sincerely thank Prof Dr J—rg Baten for his support and valuable comments during the preparation of this article.
Declaration of Conflicting Interests
The author declared no potential conflicts of interest with respect to the research, authorship, and/or publication of this article.
Funding
The author received no financial support for the research, authorship, and/or publication of this article.
Data Availability Statements
The author used all publicly available databases and mentioned the sources in the article.