
Abstract
This systematic review evaluates the application of the Unified Theory of Acceptance and Use of Technology (UTAUT) model in higher education, analyzing 162 SSCI/SCI-E articles from 2008 to 2022. It reveals a predominant focus on student participants from Asia and North America. Mobile learning tools are the most studied technologies. Surveys continue to be the top data gathering method, while structural equation modeling is preferred for analysis. The Technology Acceptance Model is combined most with UTAUT. UTAUT testing shows performance expectancy has the strongest sway on behavioral intention. Additionally, the review underscores nuanced variances in the impact of UTAUT factors between higher education and general contexts. The study calls for future UTAUT applications must promote inclusive research spanning diverse groups, mixed methodologies and theoretical perspectives. This comprehensive approach is imperative to fully understand technology adoption patterns in higher education and enable context-specific integration strategies.
Plain language summary
This review explores if the Unified Theory of Acceptance and Use of Technology (UTAUT) effectively predicts technology adoption in higher education settings. It reveals a predominant focus on student participants from Asia and North America. Mobile learning tools are the most studied technologies. Surveys continue to be the top data gathering method, while structural equation modeling is preferred for analysis. The Technology Acceptance Model is combined most with UTAUT. UTAUT testing shows performance expectancy has the strongest sway on behavioral intention. The findings provide valuable input on integrating new education technologies. The study calls for future UTAUT applications must promote inclusive research spanning diverse groups, mixed methodologies and theoretical perspectives. This comprehensive approach is imperative to fully understand technology adoption patterns in higher education and enable context-specific integration strategies.
Keywords
Introduction
In this era of rapid technological advancements, the acceptance of new technologies has become a critical field of interest. As various facets of life are increasingly influenced by new technology, understanding how users accept and adopt these innovations is essential. This has facilitated the development of numerous theoretical models that are instrumental in explaining user acceptance. These include the Technology Acceptance Model (TAM) by Davis (1989), the Theory of Planned Behavior (TPB) by Ajzen (1991), the Innovation Diffusion Theory (IDT) by Rogers (1962), and the Unified Theory of Acceptance and Use of Technology (UTAUT) by Venkatesh et al. (2003), among others. UTAUT stands out through its synthesis of key concepts from prevailing models to provide a comprehensive framework for understanding technology acceptance (Nnaji et al., 2023).
UTAUT is a predominant model extensively employed in understanding technology adoption in the educational context, especially in the realm of higher education (Granić, 2022). Despite its extensive application, there is a notable gap in the literature: the absence of a systematic review evaluating UTAUT’s implementation and efficacy in higher education.
To bridge this gap, the current study undertakes a systematic review of peer-reviewed articles, published in the SSCI and SCI-E indexes from 2008 to 2023, that have applied UTAUT in the higher education field. This review occupies a distinct niche in existing literature, concentrating specifically on UTAUT’s application in higher education, whereas previous reviews have explored its usage across various fields. From a theoretical perspective, this review not only helps deepen our understanding of the UTAUT model’s application in the unique context of higher education, but also reveals potential areas for further study and development. From a practical perspective, such research can guide the effective integration of new technologies in higher education environments, clarifying the strengths and limitations of UTAUT in higher education. Additionally, this kind of review is crucial for educators and policymakers, as it provides tailored insights and strategies for them, ensuring that the strategies and resources for educational technology align with the most effective models for technology adoption and integration.
This review aims to answer the following research questions (RQs):
RQ1: What is the distribution of research subjects in the higher education field?
RQ2: What are the most frequently studied information technology (IT)/Information systems (IS) in the higher education field?
RQ3: What research methodologies have been employed in studies in the higher education field?
RQ4: What are the most frequently used theories/models in the higher education field?
RQ5: What are the results of hypothesis testing of UTAUT internal hypotheses in the higher education field?
Literature Review
When conducting research on the adoption of new technologies, scholars are often confronted with the challenge of selecting constructs from a myriad of competing models. To address this issue, Venkatesh et al. (2003) synthesized seven competing models and proposed the UTAUT model. In the UTAUT model, Venkatesh et al. (2003) argues that performance expectancy (PE), effort expectancy (EE), social influence (SI), and facilitating conditions (FC) play a significant role as direct determinants of user acceptance and usage behavior. These four constructs have been redefined based on the existing competing models. Specifically, PE refers to the degree to which an individual believes that using the system will help them attain gains in job performance. EE denotes the degree of ease associated with the use of the system. SI refers to the degree to which an individual perceives that important others believe they should use the new system. FC reflects the degree to which an individual believes that an organizational and technical infrastructure exists to support the use of the system. Moreover, key moderators such as gender, age, voluntariness, and experience have been incorporated into the UTAUT model (Venkatesh et al., 2003). Figure 1 presents a visual depiction of the UTAUT model.

UTAUT model (Venkatesh et al., 2003).
The UTAUT model has demonstrated its broad applicability through its widespread application in diverse fields. It has been utilized in studying the acceptance of various technologies, including the internet of things (Scur et al., 2023), artificial intelligence products (Al-Sharafi et al., 2023; Terblanche & Kidd, 2022), electronic health technology (Cobelli et al., 2023; Gu et al., 2021), electric vehicles (Le et al., 2023), among others.
Accompanying the extensive use of the UTAUT model, numerous literature reviews (Attuquayefio & Addo, 2014; Chang, 2012; Williams et al., 2011; Williams et al., 2015) and meta-analyses (Blut et al., 2022; Dwivedi et al., 2011; Faaeq et al., 2013; Khechine et al., 2016; Taiwo & Downe, 2013) have been conducted in general fields. Williams et al.’s (2015) review stands out as one of the most comprehensive assessments on UTAUT’s implementation among these past works. Their analysis distinctively explored various key facets, including demographic profiles of research subjects, predominant technologies and information systems under investigation, methodological tendencies in UTAUT research, integration with complementary models, and outcomes of hypotheses testing within UTAUT-based studies. By thoroughly probing into these multiple dimensions, Williams et al.′s review substantially enriches the understanding of UTAUT’s efficacy and offers an exemplary methodological framework to empower future reviews on technology acceptance research.
Furthermore, several literature reviews and meta-analyses have explored its use across different application fields. These studies cover a wide range of topics, such as e-government adoption (Amrouni et al., 2019), acceptance of remote healthcare technology (Rouidi et al., 2022), e-banking (Malik, 2021), smartphone technology (Ahmed et al., 2023), mobile applications (Kamal & Subriadi, 2021), mobile payments (Al-Saedi & Al-Emran, 2021), information systems (Alghatrifi & Khalid, 2019), m-commerce (Imtiaz, 2018), and other areas.
In the education field, the UTAUT model has established itself as a significant model for technology acceptance, second only to TAM (Granić, 2022). Its application extends to various educational technologies, including educational chatbots (Bilquise et al., 2023), e-Learning platforms (Patil & Undale, 2023), mobile learning (m-learning; Chao & Chen, 2023), among others.
The model’s application in the education field has prompted extensive theoretical research, especially through reviews and meta-analyses. This research covers a wide range of topics, such as m-learning (Aytekin et al., 2022; Zhu & Huang, 2023), MOOC (Mendoza et al., 2017), Google Classroom (Yee & Abdullah, 2021), educators’ motivation to adopt the Flipped Classroom (Yahaya et al., 2022), among others.
The necessity of conducting a systematic review of UTAUT in the higher education field is underlined by several key considerations drawn from the above context. First, the UTAUT model has demonstrated extensive applicability across diverse fields indicates the model’s robustness. Second, while there have been numerous reviews assessing UTAUT’s implementation, there is a distinct gap in focused research specifically within the higher education sector. Furthermore, considering the maturity of research on UTAUT’s application in education, where a significant proportion of participants are sourced from higher education institutions, it becomes apparent that a specialized review in the higher education field is both timely and necessary. Such a specialized review will enhance theoretical understanding of UTAUT in higher education and offer practical recommendations for educators and policymakers.
Methodology
This study implemented a systematic review based on the Preferred Reporting Items for Systematic Reviews and Meta-Analyses (PRISMA) guidelines. The first step was specifying the exclusion criteria for the review. Following this, relevant information sources were identified. A comprehensive search strategy was then developed, followed by a rigorous selection process. The final step involved detailing the methods for data collection from the selected academic articles.
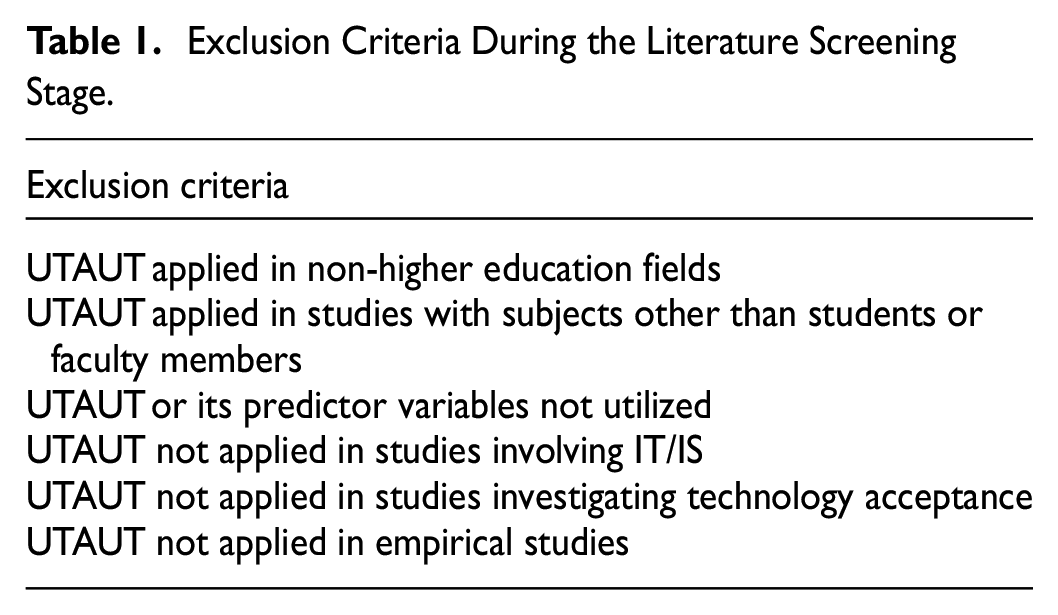
For the exclusion criteria, the review specifically excluded studies not written in English and those that were not article-type documents. Other criteria, applied during the literature screening phase, are detailed in Table 1.
Exclusion Criteria During the Literature Screening Stage.
To ensure the inclusion of high-quality literature, the search was restricted to articles in journals indexed in the Science Citation Index Expanded (SCI-E) and the Social Sciences Citation Index (SSCI). Consequently, the Web of Science (WOS) was the sole database used for this study.
Regarding the search strategy, a combination of UTAUT-related keywords with terms associated with education and educational technology was employed. This strategy involved linking terms to create a search string based on the logical expression: (Topics related to the UTAUT) AND ((WOS Categories related to Education) OR (Topics related to educational IT/IS)). The search terms for “Topics related to the UTAUT” included “UTAUT* OR “Unified Theory of Acceptance and Use of Technology”.” For “WOS Categories related to Education,” terms defined by Marín-Marín et al. (2021) were used, and for “Topics related to educational IT/IS,” the search terms followed the framework established by Oliveira Dos Santos et al. (2018).
The search, conducted on February 14th, 2023, yielded 280 records.
In the selection process, records were screened based on the exclusion criteria, resulting in 162 articles for in-depth analysis. The specific screening process is illustrated in Figure 2.
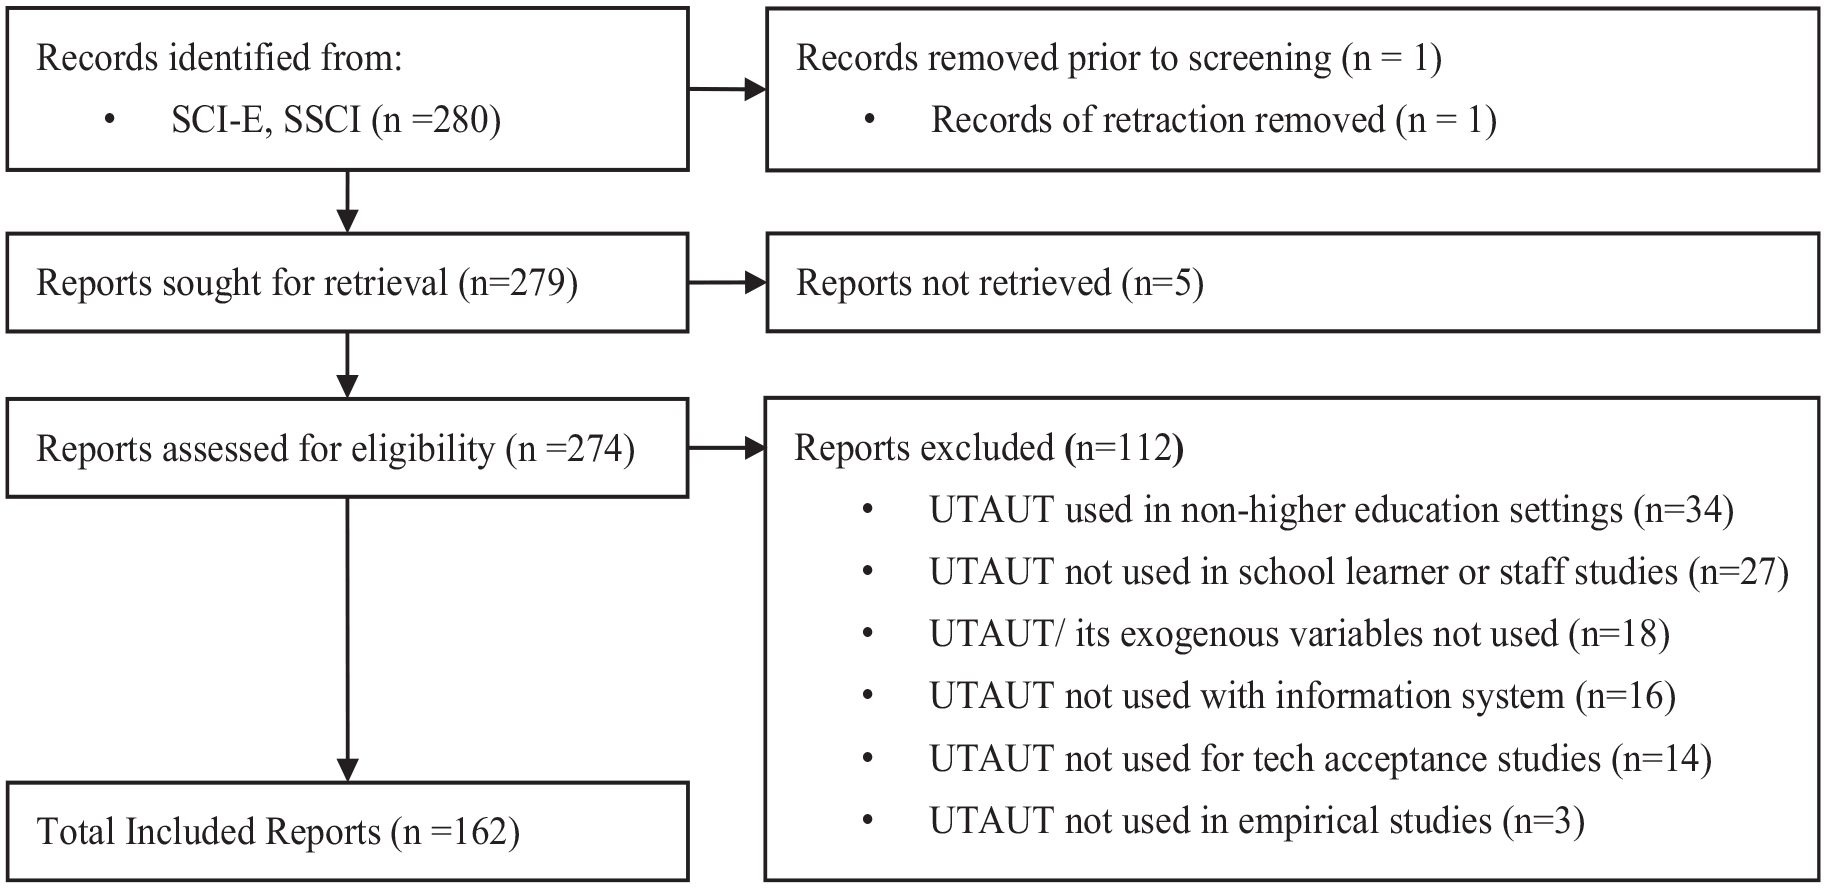
Flowchart of article selection process.
Out of the 162 articles included, except for three published in 2023, Figure 3 displays the publication timeline of the remaining 159 articles. There is an observable increasing trend in publications from 2008 (the earliest publication year retrieved) to 2022, particularly post the emergence of the COVID-19 pandemic in 2019.
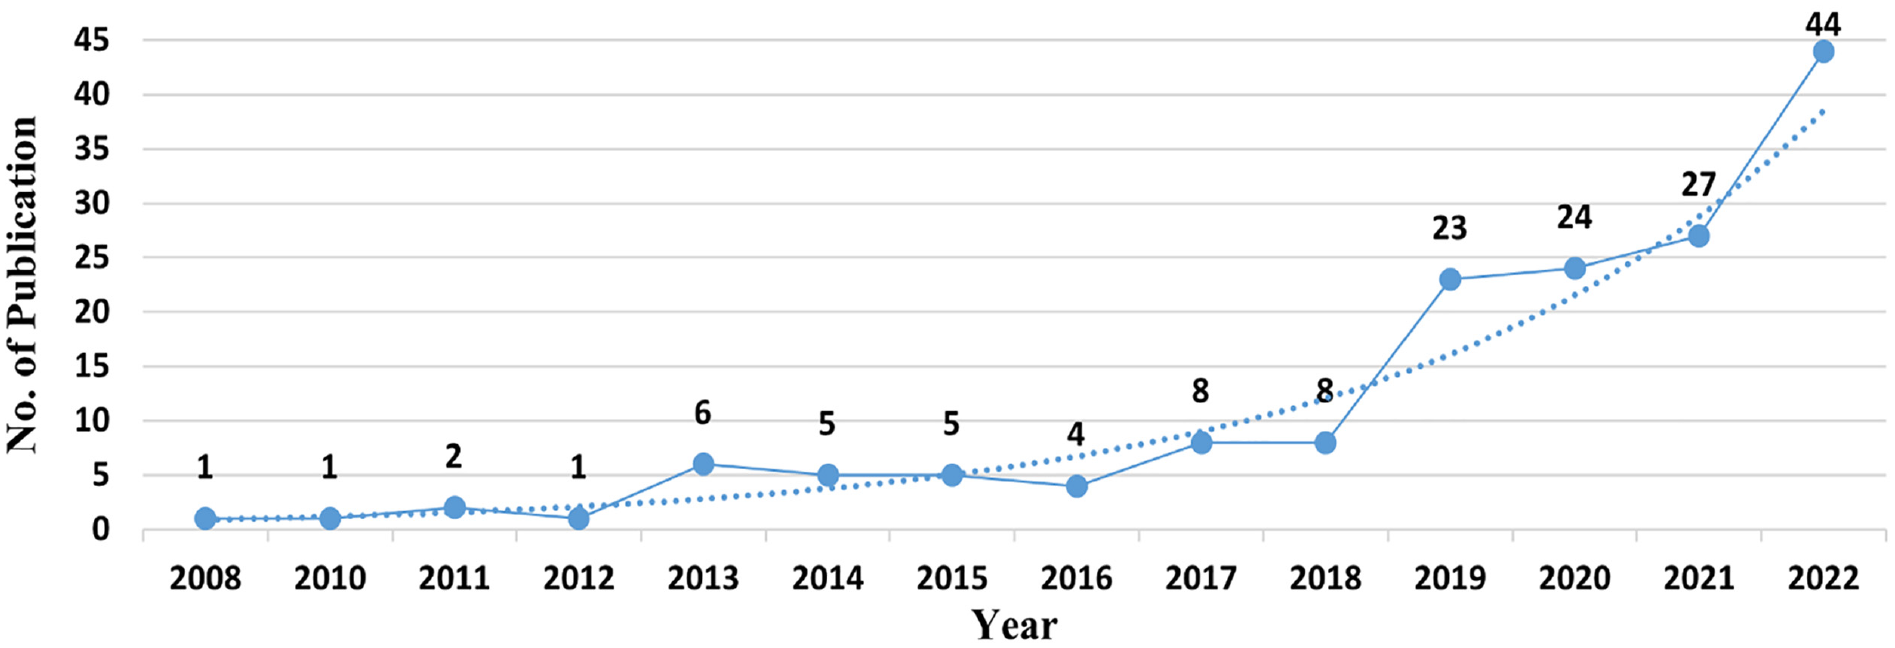
Timeline of publication.
Before analyzing UTAUT internal hypotheses statistically, further screening was performed to include only those articles with clearly defined hypotheses, quantitative hypothesis testing procedures, and reported hypothesis testing results. This resulted in 106 articles focusing on at least one UTAUT internal hypothesis. The original UTAUT model comprises five hypotheses, with three using PE, EE, and SI as predictors for BI, and two using FC and BI as predictors for UB. Additionally, the relationship between FC and BI is often tested, thus, following Williams et al.’s (2015), this study also considers FC-BI as an internal hypothesis of UTAUT.
In terms of the methods used to collect data from reports, data from reports were coded across five aspects. For IT/IS coding, the educational technology classification by Granić (2022) was employed. However, for the other four aspects—occupation and country/region of the study sample, data collection and analysis methods and tools, theoretical models used, and results of UTAUT internal hypothesis testing—the methodology used by Williams et al. (2015) in their UTAUT review in the general field was adopted. This methodological choice is designed to underscore the consistencies and variances in the UTAUT model’s application across different fields, with a special focus on its implications in higher education. Employing the coding method of Williams et al. (2015) ensures methodological continuity and robustness, thereby enhancing the comparability and overall rigor of the study. Additionally, this approach facilitates significant cross-temporal comparisons, shedding light on both contemporary and historical trends in the application of UTAUT in higher education.
Specifically, apart from the internal hypothesis testing results, the other four aspects were analyzed using quantitative frequency statistics. For the internal hypothesis testing results, three indicators were utilized: hypothesis testing rate, significance rate, and composite weighting coefficient. The hypothesis testing rate is the proportion of tested hypotheses to the total number within the statistical scope, gauging the most frequently utilized hypotheses. The significance rate is the ratio of significant results to the total tested hypotheses, indicating the likelihood of significance. The composite weighting coefficient, calculated as the product of the testing rate and significance rate, assesses the relative importance of different hypotheses. This metric addresses the limitations identified by Jeyaraj et al. (2006) regarding the exclusive reliance on testing rate or significance rate. A higher composite weighting coefficient suggests a greater importance of a hypothesis in the tested model.
Results and Discussion
This section presents key findings related to five research questions. First, it summarizes the distribution of research subjects across regions and occupations. Second, it provides an overview of the examined IT/IS. Third, it discusses the research methodologies used, focusing on data collection, analysis methods, and analytical tools. Fourth, it summarizes the theories and models utilized alongside UTAUT. Lastly, it outlines the hypothesis testing results for UTAUT’s internal hypotheses.
What is the Distribution of Research Subjects in the Higher Education Field? (RQ1)
To address RQ1, the study examines the geographical and occupational distribution of research subjects in studies that apply the UTAUT model in the higher education field.
Concerning geographical distribution, Figure 4 offers an illuminating revelation of a pronounced geographical bias in the selection of research subjects. Specifically, this bias manifests in the uneven distribution of sample recruitment across different global regions. Predominantly, Asia, North America, and Western Europe emerge as regions with heightened frequencies of sample recruitment. This is particularly evident in Asian countries such as China, Saudi Arabia, Malaysia, and Taiwan, as well as the United States in North America, where the highest recruitment frequencies are observed. Conversely, regions such as Africa, South America, Eastern Europe, and Northern Europe typically exhibit lower levels of recruitment. However, noteworthy exceptions exist in countries like Ghana, Egypt, Nigeria, and Brazil, which demonstrate relatively higher occurrences of subject recruitment within these generally underrepresented regions.

Distribution of countries/regions where the research subjects were recruited from.
This observed geographical bias in the selection of research subjects might be attributable to a multitude of factors. These could include, but are not limited to, the varying levels of technological advancement and higher education infrastructure across different regions, the accessibility of research subjects, and the historical and socio-economic contexts influencing research priorities and funding. Furthermore, the concentration of academic and research institutions with the capacity and resources to conduct UTAUT-related studies might also play a significant role in this geographical disparity. As such, this bias not only reflects the differential global distribution of technological adoption in higher education but also potentially impacts the generalizability and applicability of the UTAUT model across diverse educational contexts.
Compared to previous findings, the United States, China, Taiwan, and Malaysia remain key regions for sample recruitment, while most countries/regions in Africa and South America exhibit lower frequencies. However, there has been a decline in sample recruitment in traditionally developed countries/regions compared to the findings of Williams et al.’s (2015). This change could be attributed to the accelerated development of educational technology infrastructure in developing countries post-COVID-19, along with a greater emphasis on promoting educational technology in these regions. Notably, the recruitment frequency in China in this study is higher than that reported by Granić and Marangunić (2019), potentially linked to China’s stringent COVID-19 prevention policies which have expedited the development of the country’s educational technology infrastructure (Maksimova, 2022).
The significance of these findings lies in their revelation of a clear geographical bias in UTAUT model application research. The considerably higher recruitment frequencies in Asia and North America compared to Africa and South America might limit the UTAUT model’s generalizability. Furthermore, these results indicate the necessity of conducting more UTAUT research across diverse cultural and geographical backgrounds to ensure the model’s comprehensiveness and universal applicability. Future research should expand the geographical distribution to underrepresented countries/regions and investigate the reasons behind the lower recruitment in some areas to enhance the UTAUT model’s applicability in higher education and facilitate further optimization. This approach will not only improve the representativeness and universality of the model but also contribute to a more comprehensive understanding of technology acceptance and usage across different cultural and geographical contexts.
Regarding the occupational distribution of research subjects, this study reveals a significant discrepancy in sampling frequency, with students (approximately 81%, n = 140) being recruited much more frequently than faculty members (about 19%, n = 32). Compared to Williams et al.’s (2015) review of the UTAUT model in general fields, this higher proportion of student participants indicates a unique trend in higher education. This trend might stem from the relative ease of recruiting students (Williams et al.’s, 2015).
The significance of this finding is multifaceted. Firstly, it exposes a bias in sample selection in current higher education research, namely an over-reliance on student samples. This bias could prevent the research outcomes from fully reflecting the comprehensive application of educational technology in higher education, as faculty members’ perspectives and experiences may vastly differ from those of students. Lastly, the finding underscores the necessity of incorporating more faculty voices in research on educational technology in higher education. Faculty members play a crucial role in the adoption and implementation of educational technology, making their insights essential for understanding and evaluating the effectiveness of these technologies. Therefore, future research should pay more attention to faculty members’ acceptance and use of educational technology and how these technologies affect teaching quality and student learning outcomes.
What Are the Most Frequently Studied IT/IS in the Higher Education Field? (RQ2)
To address RQ2, the study seeks to identify the types of IT/IS that have been most frequently examined in studies that apply the UTAUT model in the higher education field.
Figure 5 presents the findings: the most frequently studied IT/IS in higher education are M-Learning/Device/Technologies (n = 39). These constitute the largest portion of the 163 instances identified in the local literature, followed by Online Learning/Tutoring System/Platforms (n = 22), E-Learning System/Technology/Tool (n = 22), and Learning Management Systems (LMS; n = 14).

The most frequently studied IT/IS in the higher education fields.
The significance of these findings lies in several key areas. Firstly, the prevalence of M-Learning/Device/Technologies in higher education research contrasts with previous studies, such as those by Granić (2022), which reported E-Learning as more dominant. This shift suggests a trend toward mobile-centric educational models in higher education, likely driven by the simplicity, affordability, and widespread use of mobile devices among university students and educators (Alsswey & Al-Samarraie, 2019). This trend is particularly notable during the COVID-19 pandemic, which accelerated the adoption of m-learning globally (Naciri et al., 2020). Secondly, the findings highlight the evolving nature of technology adoption in higher education. The rise of m-learning over traditional LMS and other IT/IS indicates a significant change in the preferences and needs of students and educators. This shift holds substantial implications for teaching strategies, curriculum development, and the integration of future technologies in higher education. Furthermore, the relatively lower focus on AI technologies in the studies suggests that whose adoption and consequent benefits in higher education are still not well understood. This gap presents an opportunity for future research to investigate how AI technologies can be effectively incorporated into educational practices, alongside exploring the applicability and effectiveness of m-learning in varied educational settings. In summary, these findings indicate a shift toward m-learning in higher education, with significant implications for educational technology strategies and research. The underrepresentation of AI in current studies also points to potential future research directions in the integration of advanced technologies into higher education.
What Research Methodologies Have Been Employed in the Higher Education Field? (RQ3)
To address RQ3, the study seeks to identify the research methodologies utilized in studies that apply the UTAUT model in the higher education field. It involves examining the data collection and analysis methods, as well as the tools that have been predominantly employed.
Regarding data collection methods, survey instruments emerged as the predominant choice (n = 159), accounting for 89% of the methods used, with interviews (n = 16) trailing at 9%. Other methods collectively contributed less than 2%.
The predominance of survey instruments in higher education research mirrors findings by Williams et al.’s (2015), who also reported that surveys were used in 87% of the cases they reviewed. This consistency across studies suggests a strong preference for surveys in the field of higher education, similar to trends observed in other academic fields. The choice of surveys is likely due to their practical benefits, including cost-effectiveness and the ability to collect extensive data efficiently. Surveys enable researchers to reach a broad audience, gather quantitative data, and analyze trends or general patterns in responses. However, the heavy reliance on surveys may also have limitations, particularly in gaining a deep, qualitative understanding of how educational technology is used and perceived in higher education settings. While surveys provide quantitative insights, they often lack the depth and nuance that qualitative methods like interviews can offer. Interviews, despite being less utilized in the studies reviewed, offer richer, more detailed insights into individual experiences and perceptions.
Therefore, the significance of these findings lies in the recognition that future research in higher education, especially concerning the adoption and use of educational technologies, could benefit from a more balanced integration of both quantitative and qualitative methods. Combining surveys with interviews would allow for a comprehensive understanding of technology acceptance and usage patterns. This mixed-methods approach would enable researchers to not only quantify the extent of technology adoption but also explore the underlying reasons, challenges, and experiences associated with its use in higher education.
In terms of data analysis methods, Figure 6 displays the findings that structural equation modeling (SEM; n = 123) and regression analysis (n = 27) are the most commonly used statistical methods. Other frequently used methods include thematic analysis (n = 13), t-tests (n = 12), and analysis of variance (ANOVA; n = 11).

Data analysis methods used in the higher education fields.
The increased use of SEM, and specifically PLS-SEM, compared to the findings of Williams et al.’s (2015) review indicates a growing reliance on this method in recent years. This growing dependence on PLS-SEM could be attributed to its suitability for structural models that contain many constructs, indicators, and/or model relationships compared to CB-SEM (Jöreskog, 1970), which has numerous restrictive assumptions (Hair et al., 2011, 2019). However, the concentrated use of SEM poses certain limitations. While SEM is effective for understanding complex models and relationships between variables, it might not always capture the finer details and nuances of the data. This is where other methods like thematic analysis, t-tests, and ANOVA can be particularly useful. Thematic analysis, for instance, is valuable for in-depth qualitative insights, allowing researchers to explore themes and patterns in rich qualitative data. T-tests and ANOVA are beneficial for hypothesis testing and exploring differences between groups.
The significance of these findings lies in the realization that a broader spectrum of data analysis methods could enrich higher education research. While SEM is undoubtedly valuable for its specific purposes, integrating a variety of methods, including qualitative analyses and hypothesis-testing techniques, would provide a more comprehensive and nuanced understanding of the data. Future research should, therefore, consider employing a diverse range of data analysis techniques to ensure a more thorough and varied exploration of research questions and hypotheses in the field of higher education.
Regarding data analysis tools, Figure 7 presents the data analysis tools used in higher education research, highlighting that SPSS (n = 64) and Nvivo (n = 4) are the most frequently utilized tools for quantitative and qualitative analysis, respectively. Additionally, SEM-related tools such as Smart PLS (n = 54), AMOS (n = 43), and LISREL (n = 5) have been extensively used, accounting for over half of all tool usage.

Data analysis tools used in the higher education fields.
The findings suggest a particular inclination toward certain data analysis tools in the field. The growing popularity of Smart PLS, almost rivaling SPSS in its frequency of use, marks a significant shift from Williams et al.’s (2015) study. This shift could be attributed to several factors. Smart PLS has become more user-friendly over time, enhancing its adoption in higher education research. Moreover, the evolution of research methodologies and an increased familiarity with various data analysis tools among researchers might have influenced the selection of tools that are better suited to the specific needs of higher education research. The increased acceptance of PLS-SEM in the higher education research community also plays a crucial role. This trend indicates that the data analysis in higher education research is predominantly quantitative. The limited use of qualitative analysis tools like Nvivo underscores a relatively minor role for qualitative methods in this field. Consequently, there appears to be a limited application of mixed-methods research in the current field of higher education. By integrating both quantitative and qualitative approaches, mixed-methods research can provide a more nuanced and comprehensive understanding of phenomena.
In summary, the findings reveal a strong preference for quantitative tools and methods in higher education research, with qualitative methods playing a smaller role. This suggests that future research, particularly in the application of the UTAUT model in higher education, could greatly benefit from embracing mixed-methods approaches. Such approaches would allow for richer, more detailed insights into the phenomena under study, offering a more balanced view that combines the breadth of quantitative analysis with the depth of qualitative insights (Venkatesh et al., 2023).
What Are the Most Frequently Used Theories/Models in the Higher Education Field? (RQ4)
To address RQ4, the study seeks to identify the theories/models utilized in studies that apply the UTAUT model in the higher education field.
Table 2 presents the findings: TAM (n = 18) emerges as the most frequently used model, significantly surpassing the Task-Technology Fit (TTF) model (n = 4). Additionally, theories such as the Theory of Reasoned Action (TRA)/TPB, Self-Determination Theory (SDT), Theory of Cultural Dimension (TCD), DeLone & McLean’s Information Systems Success (ISS) Model, Expectation Confirmation Theory (ECT), Social Cognitive Theory (SCT), and Uses and Gratification Theory (UGT) demonstrate their presence, albeit less frequently.
The Most Frequently Used Theories\Models in the Higher Education Fields.
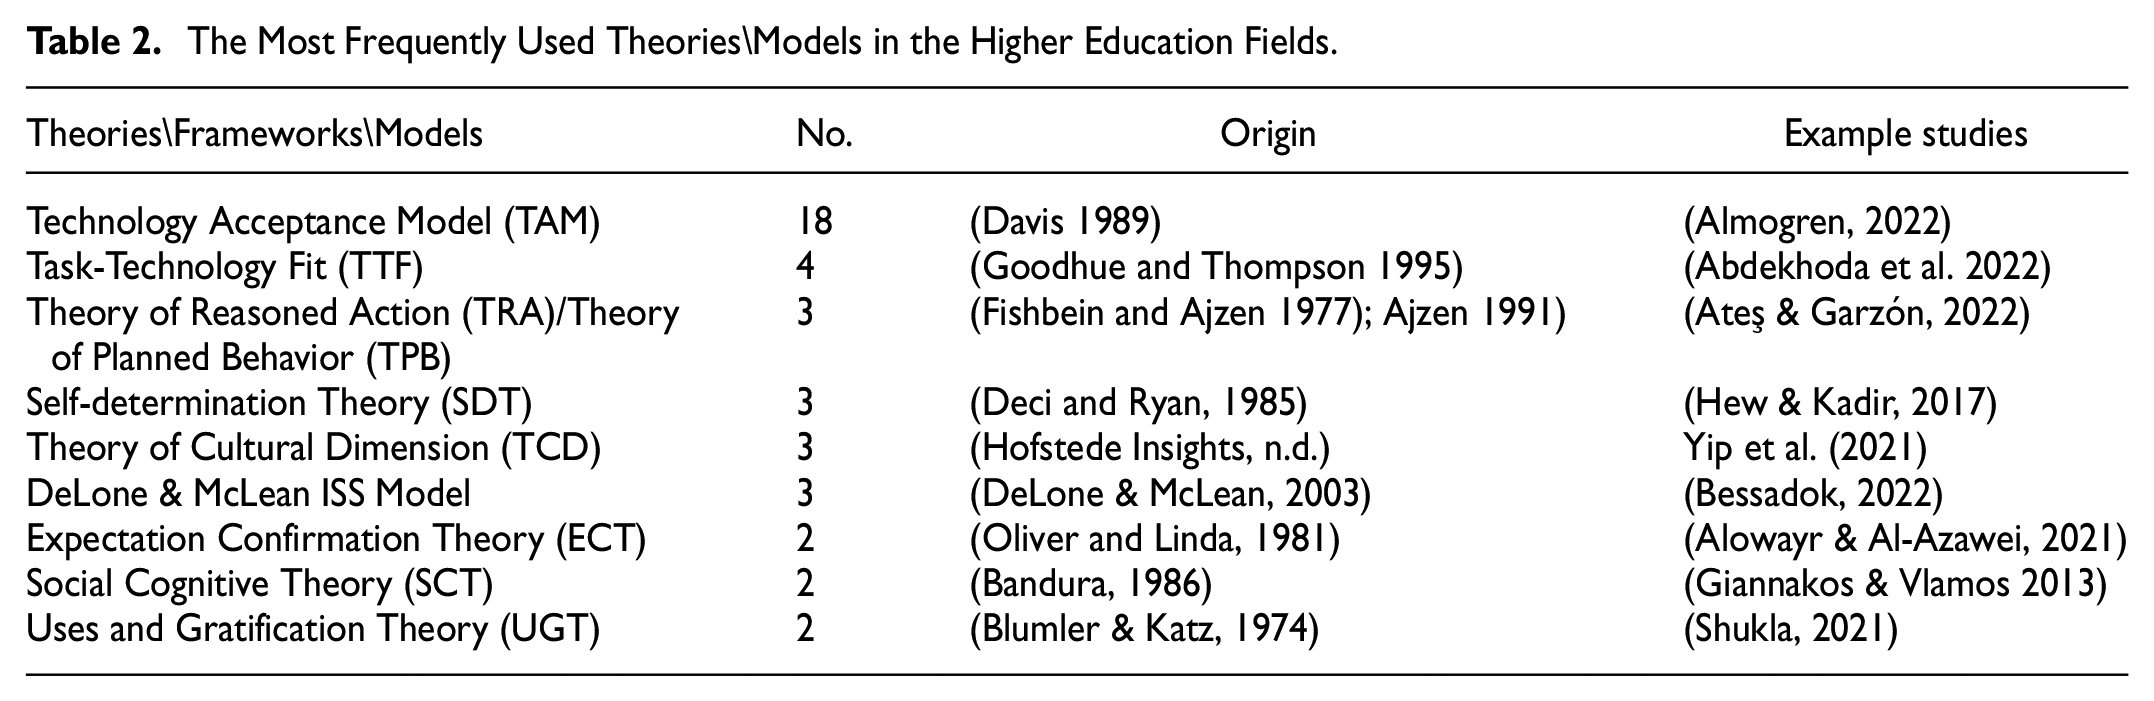
The prominence of TAM in higher education research, with its focus on perceived usefulness and ease of use, highlights a preference for straightforward and concise models in evaluating technology acceptance. Its leading position underscores the continuing importance of these factors in the field. In contrast, the TTF model, emphasizing the alignment between task requirements and technological capabilities, though cited less frequently, plays a crucial role in assessing the suitability of educational technologies. The inclusion of other theories, although less common, indicates a diversity in approaches to understanding technology acceptance and usage. Theories like TRA/TPB, SDT, and TCD offer insights into behavioral intentions, motivational factors, and cultural impacts on technology use. This diversity suggests that, while models such as TAM and TTF hold significant positions, there is an ongoing exploration of broader theoretical perspectives in the field.
The outcomes of this research contrast with findings from Williams et al.’s (2015) study in the general research field. While both studies find TAM as the leading model, differences are evident regarding TRA/TPB and TTF. Unlike Williams et al.’s (2015), TRA/TPB does not appear as a frequently used model in the context of higher education. This indicates that TRA/TPB might not be as pivotal in understanding technology adoption in higher education as in broader research fields. Moreover, the TTF model’s increased prominence in this study, compared to Williams et al.’s (2015), likely signifies a specific interest in higher education on aligning technology with educational tasks. Although the findings indicate a specificity in the choice of theories/models when applying the UTAUT model in higher education, it is noteworthy that educational technology-specific theories/models, such as Technological Pedagogical Content Knowledge (TPACK; Mishra & Koehler, 2006), are seldom utilized. This underlines an important gap: the limited use of educational technology theories/ models in the field. Therefore, future research in the application of the UTAUT model in higher education should prioritize educational technology theories/models to better understand technology adoption in higher education.
What Are the Results of Hypothesis Testing of UTAUT Internal Hypotheses in the Higher Education Field? (RQ5)
To address RQ5, the study seeks to evaluate the effectiveness and applicability of UTAUT’s internal hypotheses in the higher education field. This evaluation involves a comprehensive statistical analysis of the hypothesis testing outcomes for UTAUT’s internal components specific to this higher educational sector. The analysis encompasses evaluating the hypothesis testing rates, significance rates of hypotheses, and composite weighting coefficients for each hypothesis.
Table 3 presents the detailed results of hypothesis testing of UTAUT internal hypotheses in the higher education field.
The Results of Hypothesis Testing of UTAUT Internal Hypotheses in the Higher Education Settings.

Note. Ac = accessibility; Ca = Covid-19 anxiety; Mo = Motivation; Pr = Perceived risk; Sr = self-regulation; YES = significant test result; NO = non-significant test result; X = no hypothesis test conducted.
Table 4 summarizes the 125 hypothesis testing results included in the 106 articles, along with the corresponding hypothesis testing rate, significance rate of the hypothesis, and composite weighting coefficient.
Internal Hypotheses in the UTAUT.

Figure 8 presents the hypothesis testing rates, with the thickness of the lines between variables indicating the rates.

The hypothesis testing rates of the internal hypotheses in the higher education fields.
This study reveals that PE-BI and EE-BI have the highest hypothesis testing rates at 90%, followed by SI-BI (83%), FC-BI (59%), BI-UB (50%), and FC-BU (38%). These results underscore the significant influence of PE and EE on the intentions of both students and faculty members to adopt technology in the higher education context. While SI is also a key factor, the impact of FC is comparatively less substantial. This suggests that for both students and faculty, the direct benefits and user-friendliness of technology are more crucial than the external conditions supporting its use. This understanding of the varying impacts of these factors is vital for educational institutions to develop effective strategies that cater to the technology acceptance needs of both students and faculty members.
In comparing the hypothesis testing rates of this study to Williams et al.’s (2015) study in the general field, the calculated ratios for the six hypotheses are: PE-BI (1.16), EE-BI (1.21), SI-BI (1.08), FC-BI (1.84), FC-BU (1.04), and BI-UB (1.23). These ratios indicate a nuanced variance in the impact of UTAUT factors between higher education and the general field. Specifically, PE-BI and EE-BI are slightly more influential in higher education, suggesting a greater emphasis on performance benefits and ease of use in this context. The significantly higher ratio for FC-BI highlights the critical role of FC in higher education, likely due to the need for supportive infrastructure and resources in educational settings. SI-BI and FC-BU show a modest increase, implying their importance is relatively consistent across contexts. The higher BI-UB ratio in higher education suggests a stronger translation of behavioral intentions into actual usage, possibly due to the more structured nature of educational environments. These comparative insights underscore the need for context-specific approaches in technology acceptance strategies within the higher education sector.
Figure 9 illustrates the significance rates of hypotheses, with the thickness of the lines between variables indicating the rates.

The significance rates of the internal hypotheses in the higher education fields.
This study reveals that BI-UB (92%) has the highest significance rates of hypotheses, followed by PE-BI (82%), FC-BU (70%), SI-BI (59%), FC-BI (58%), and EE-BI (56%). Among all the internal hypotheses, only BI-UB and PE-BI meet the threshold (80%) for a good hypothesis relationship, as suggested by Jeyaraj et al. (2006), which is consistent with the findings of Williams et al. (2015). The prominence of BI-UB suggests that BI is a strong predictor of UB among both students and faculty in higher education. The significant role of PE-BI indicates that perceived performance benefits greatly influence the intention to use technology. Additionally, the substantial rates for FC-BU and FC-BI emphasize the importance of FC in shaping technology adoption and usage. Meanwhile, the notable influence of SI-BI highlights the impact of social factors on technology acceptance. Lastly, the relatively lower rate for EE-BI compared to PE-BI and BI-UB suggests that while EE is a relevant factor, it is overshadowed by PE and BI. These insights are crucial for educational institutions in developing strategies that address these key factors to effectively foster technology acceptance and integration.
In comparing the significance rates of hypotheses in this study with those in Williams et al.’s (2015) study in the general field, the ratios are as follows: PE-BI (1.03), EE-BI (0.97), SI-BI (0.78), FC-BI (0.85), FC-BU (1.05), and BI-UB (1.12). These ratios reveal distinct patterns in the influence of UTAUT factors between higher education and the general field. The consistent ratio for PE-BI and the marginally lower ratio for EE-BI indicate that PE and EE are similarly important in both contexts. The lower ratio for SI-BI suggests that SI plays a less significant role in the academic context, possibly due to a more individualistic approach to technology use in education. Notably, the ratio for FC-BI (0.85) implies that the role of FC in forming the intention to use technology is somewhat less influential in higher education compared to the general field. In contrast, the ratio for FC-BU (1.05) indicates a slightly higher significance of FC in UB in higher education. This suggests that while the initial intention to use technology in higher education may be less dependent on FC, the actual usage is somewhat more reliant on these conditions, highlighting the importance of providing adequate resources and support for effective technology implementation in educational settings. The higher ratio for BI-UB in higher education underscores the strong link between intention and usage in this context, reflecting a more focused and practical approach to technology use in educational institutions. These nuanced differences underscore the necessity for tailored technology acceptance strategies that specifically address the unique dynamics and requirements of the higher education sector.
Figure 10 illustrates the composite weighting coefficients, with the thickness of the lines between variables indicating the rates.

The composite weighting coefficients of the internal hypotheses in the higher education fields.
This study reveals that PE-BI (74%) has the highest composite weighting coefficient, followed by EE-BI (50%), SI-BI (49%), BI-UB (46%), FC-BI (34%), and FC-BU (26%). These results highlight the paramount importance of PE in driving technology usage, emphasizing that both students and faculty are more likely to adopt technology they believe will enhance their performance. The significant coefficients for EE-BI and SI-BI underscore the importance of EE and SI, respectively, in technology acceptance. Meanwhile, the lower coefficients for FC-BI and FC-BU suggest that FC, though relevant, are less critical compared to PE and EE. This hierarchy of influences suggests that focusing on demonstrating the performance benefits and ease of use of educational technologies, along with leveraging social influences, is key for successful technology integration in higher education settings.
In comparing the composite weighting coefficients of this study with Williams et al.’s (2015) study in the general field, the ratios for the UTAUT hypotheses are: PE-BI (1.19), EE-BI (1.17), SI-BI (0.85), FC-BI (1.55), FC-BU (1.09), and BI-UB (1.38). These ratios indicate significant differences in the relative importance of these factors between higher education and the general field. A higher ratio for PE-BI and EE-BI in higher education suggests a greater emphasis on PE and EE in this context. Conversely, the lower ratio for SI-BI indicates a reduced influence of social factors in academic settings. Notably, the much higher ratio for FC-BI emphasizes the critical role of FC in shaping intentions to use technology in higher education. The slightly higher ratio for FC-BU indicates that FC also play a marginally more significant role in UB in this context. The elevated ratio for BI-UB highlights the stronger link between BI and UB in higher education. These insights underscore the need for nuanced, context-specific strategies in technology acceptance within the higher education sector, tailored to its unique characteristics and requirements.
Conclusion
This study offers a comprehensive evaluation of UTAUT within the higher education context, yielding several key insights. Firstly, the geographical and occupational distribution of research subjects reveals a clear bias, with Asia and North America exhibiting higher frequencies of sample recruitment compared to other regions. This imbalance suggests a need for broader geographical representation in future studies to enhance the UTAUT model’s universality. A significant over-reliance on student samples (81%) compared to faculty (19%) is observed, indicating a gap in sample selection in higher education research. Secondly, the study also finds that M-Learning/Device/Technologies dominate the IT/IS landscape in higher education, contrasting with previous studies and indicating a shift toward mobile-centric educational models. This trend, especially notable during the COVID-19 pandemic, calls for further exploration into advanced technologies like AI. In terms of research methodologies, surveys emerge as the primary method for data collection, but the heavy reliance on them suggests a potential gap in achieving a deeper understanding of educational technology usage. Structural Equation Modeling, particularly PLS-SEM, is extensively used in data analysis, indicating a preference for quantitative approaches. Regarding the application of theories/ models, TAM emerges as the most frequently used theoretical framework alongside UTAUT, underscoring the importance of perceived usefulness and ease of use in technology adoption in higher education. However, the underutilization of educational technology-specific theories/models like TPACK highlights a research gap. Lastly, the hypothesis testing of UTAUT internal hypotheses reveals the significant influence of PE and EE on technology adoption intentions. However, the impact of these factors shows nuanced variance between higher education and general research fields, suggesting the need for tailored technology acceptance strategies in the higher education sector. In summary, the study highlights the need for a more inclusive and diverse approach in higher education research concerning geographical and occupational representation, research methodologies, and theoretical frameworks. Future research should aim to diversify geographical representation, incorporate more faculty perspectives, explore advanced technologies, employ mixed-methods approaches, and develop context-specific strategies for technology acceptance in higher education.
The findings of this study contribute to the body of knowledge surrounding the adoption of educational technologies in higher education. Theoretically, the study has enriched the understanding of UTAUT’s application by revealing nuanced trends such as the geographical biases in research and the over-reliance on student samples. It also highlights the growing inclination toward mobile-centric educational models and the crucial role of diverse research methodologies in capturing the complexities of technology acceptance. Practically, the research outcomes offer concrete guidance for implementing emerging technologies in higher education. They underscore the importance of considering regional characteristics and the need for a balanced integration of faculty perspectives in technology adoption studies. Furthermore, the findings emphasize the importance of adopting mixed-methods research approaches to capture a more holistic view of technology acceptance and usage in educational settings. Additionally, finding from Wang and Rashid (2022) demonstrated the interconnections of the learning process at the different levels within the organization in order to elevate employees’ organizational commitment and job satisfaction. These insights are invaluable for educators, administrators, and policymakers in making informed decisions about integrating technologies that enhance the quality and effectiveness of higher education.
While the findings of this study contribute significantly to the field, recognizing certain limitations in the present review methodology is imperative for guiding enhancements in future works. The first limitation of this study arises from solely including journal articles indexed in SSCI and SCI-E. This selective approach could introduce biases in several aspects: sample distribution, research methodologies, and the outcomes of hypothesis testing. Such biases occur because this method overlooks diverse research outputs, particularly those not covered in these indices. To counteract these biases, future studies should broaden their literature base. They should not only consider a wider variety of literature types but also expand their range of literature sources. This expansion will enable an examination of the potential impact that different literature types and sources may have on research findings, thereby enhancing the study’s comprehensiveness and reducing the risk of bias. The second limitation is the focus solely on English-language papers. This restriction likely skews the sample distribution toward English-speaking countries/regions, potentially compromising the representation of non-English-speaking countries/regions. This imbalance could affect the study’s findings regarding the predictive validity of key variables, such as SI on BI. Consequently, this limitation might restrict the generalizability of the study’s conclusions. Future research should thus consider removing language barriers and examining the effects of linguistic diversity on research findings. The third limitation pertains to the thematic search strategy employed, which may not capture the full breadth of relevant literature. To address this, future research should adopt more inclusive literature retrieval methods, such as citation searches and other comprehensive approaches. This expansion will help ensure that all pertinent literature is considered, thereby reducing the risk of omitting critical evidence and enhancing the accuracy and validity of the review’s conclusions.
Footnotes
Acknowledgements
Not applicable.
Declaration of Conflicting Interests
The author(s) declared no potential conflicts of interest with respect to the research, authorship, and/or publication of this article.
Funding
The author(s) received no financial support for the research, authorship, and/or publication of this article.
Ethics Statement
Not applicable.
Data Availability Statement
Data sharing not applicable to this article as no datasets were generated or analyzed during the current study.