
Abstract
The indicator “mean years of schooling (MYS)” has been one of two education indicators in the Human Development Index calculated by UNDP since 2010. In view of greatly expanded role of education in modern development, this study develops a multivariate panel regression model of socio-economic factors where changing rate of MYS becomes the dependent variable. This research develops a model of socio-economic determining factors where changing the rate of MYS is the dependent variable. The proposed model will include five independent variables to assess the impact on MYS for 97 countries from 1995 to 2017. The most important finding is that dependency with a negative impact on MYS was the most influential factor, followed by urbanization with a positive impact on MYS. The impact from income with a positive impact and population with a negative impact was the third most important factor depending on the income and urbanization subgroup. This study highlighted the offsetting impact of dependency rate and urbanization rate to length of education depending on the income and urbanization subgroups of countries. However, the general policy implications proposed here are subjected to substantial revision if the analysis of scaling results from income and urbanization subgroup analysis are incorporated, because the impact from these two offsetting factors would vary widely depending on the particular subgroup.
Introduction
In assessing the level of human development, the critical role of education together with life expectancy and income is fully recognized by the United Nation Development Programme (UNDP). The UNDP combines the three critical elements of education, life expectancy, and per capita income to calculate its annual Human Development Index (HDI). And then, the HDI with a value between 0 and 1 is used to rank countries in the world into the four tiers of human development. In recent years, some scholars view HDI as a more useful ranking of countries over the traditional ranking of countries by income alone.
The HDI uses two measures of education: expected years of schooling (EYS) of the child population, and mean years of schooling (MYS) of the adult population. MYS which will be used as the measure of educational attainment in this study represents the average number of years of education of people aged 25 and older, converted from education attainment levels using the official duration of each level (UNDP, 2018). The average MYS in 2010 for 109 countries was 7.4 years (UNDP, 2010) and increased to 8.4 years by 2017 for 189 countries (UNDP, 2018). Using an extremely simple illustration, suppose that the duration of primary, secondary, and tertiary education in country A is 4, 8, and 4 years, respectively. Further, assume that 50% of the adult population has completed tertiary education over 16 years, while the remaining 50% has not had any education. The MYS for country A becomes 8 years ((4 + 8 + 4) × (0.5) + (0) × 0.5). This calculation is complicated because people may drop out in the middle of secondary or tertiary education.
In recent years, the importance of education for development has been reemphasized when the U.N. in its Sustainable Development Goals (SDGs) included a universal secondary education for all by 2030. The elevated role of education for development, in turn, generated the need for more and better projections of future educational attainment.
For example, OECD economics department (OECD, 2012) has projected the 2060 MYS for 92 countries, which, in turn, was used as an input in projecting future GDP. Based on these estimates, they projected that the average MYS for these 42 countries in 2060 would be 12.92 years, up from 10.83 years in 2010. The top five countries with the longest MYS in 2010 were Australia, Canada, Germany, Switzerland, and the United Kingdom. However, by 2060, the projected top five countries are to be led by Korea, Japan, Australia, the United Kingdom, and Switzerland.
There were significant variations among regions and countries. For EU-28countries, there was around 30% of people with at least secondary education in 1985. By 2060, around half of the population will reach the level. By sex, the projections show 55% of women versus 47% for men will reach that level. China is rapidly catching up an is expected to reach 11.7 MYS in 2060. In Sub-Saharan Africa, the percentage of no education would drop from 12% in 2015 to 5% in 2060.
In view of the expanding role of education in modern development in recent years, it would be timely to develop an econometric model of socio-economic influencing factors where the changing rate of educational attainment measured in MYS becomes the dependent variable. This would be a major departure from the traditional literature where MYS, as the education measure, has been treated as an independent variable to explain economic growth in the past. The importance of education and human capital accumulation in the process of endogenous economic growth (Romer, 1990; Temple, 1999) has been the subject of considerable empirical research (Ahsan & Hague 2017; R. Barro, 1997; R. J. Barro & Lee, 1993, 1996, 2000; R. J. Barro, 2013;). For example, one result is that male upper school years had a positive significant effect on the subsequent rate of economic growth. The estimate of the coefficient implies that one additional year of schooling would raise the growth rate on impact by 0.44% per year (R. J. Barro & Lee, 2000). In addition, a large number of empirical studies examined the relationship between human capital accumulation with include education and economic growth (Dias & Tebaldi, 2012; Diebolt & Hippe, 2019; Fan et al., 2016; Karambakuwa et al., 2020; Qadri & Waheed, 2014; Ramos et al., 2012; Zhu & Li, 2017).
Another independent variable which can have a major impact to the level of educational attainment is total dependency rate which represents the proportion of young (less than 14 years old) and old (more than 65 years old) dependents combined over total population for a given country. The world average total dependency rate underwent a wide fluctuation ranging from 74.9% in 1970 down to 52.5% by 2010. It is expected to increase gradually to 65.7% by 2090, reflecting the so-called demographic transactional model causing these dynamic changes in population components are declining fertility and expanding life expectancy.
Expanding life expectancy will raise dependency rate and place a heavier burden of funding higher payment of welfare, healthcare, and pension for increasing old age dependents. Thus, the impact to education will be generally negative (Bloom & Williamson, 1998; Cruz & Ahmed, 2018; Kelley & Schmidt, 2005; Lee & Mason, 2006; Mason et al., 2016). On the other hand, declining fertility rate which results in a reduced youth dependency may increase educational attainment level (Becker et al., 2010; Benhabib & Spiegel, 1994; Bongaarts, 2010; Buchmann & Hannum, 2001; Cervellati & Sunde, 2005; Cochrane et al., 1990; Crespo Cuaresma et al., 2014; De Graaf & Huinink, 1992; Kuo & Hauser, 1995; Lloyd & Blanc, 1996; Lutz & Samir, 2011; Lutz et al., 2018, 2019; Maralani, 2008; Skirbekk & Samir, 2012; Steelman et al., 2002).
Another candidate for the independent variable would be the urbanization rate. The literature on the impact of urbanization on education and economic growth is nearly as old as the literature on the impact of education on economic growth (Jacobs, 1984; Lucas, 1988), which has also been the subject of considerable empirical research (Bertinelli & Black, 2004; Bertinelli et al., 2005; Bertinelli & Zou, 2008; Chen et al., 2014; Ciccone & Peri, 2006; Duranton & Puga, 2001; Henderson, 1974; V. Henderson, 2003; Ignazzi, 2014; Lutz & Samir, 2011; Moretti, 2004; Turok & McGranahan, 2013). In general, urbanization has displayed a positive role of lengthening the duration of education so that countries with high urbanization rate tend to realize longer education years for their adult population. For example, studies on the average years of secondary and higher education of the adult population for 111 countries from 1960 to 1990 estimated that a 1% increase in urbanization would generate a + 0.912% increase in the average number of school years (Bertinelli et al., 2005). One major reason is that urbanization will create more demand for jobs which require higher knowledge and skills that can be provided by more intensive education. These jobs will command higher wages and are likely to lead to future promotion. Furthermore, urbanized countries can provide more efficient and effective matching of workers to jobs leading to high likelihood of finding well-paying employment for the educated. In other words, the social return from more education will exceed the private return from education. Therefore, people will be motivated to invest time and resources for more education in urbanized countries.
To summarize, increasing the dependency rate may increase pressure to reduce the education budget, which could negatively impact MYS. However, increasing urbanization may lead to higher skill levels required in urban settings. In short, increasing the dependency rate represents shorter-term budgetary pressure, while a higher urbanization rate represents the longer-term need for more productive workers with better skills and technology. Thus, urbanization and dependency may act as offsetting factors in determining MYS. The two additional independent variables have been added in the current study to trace the impact of population changes and the increasing ratio of extensive internet users per total population on MYS. The proposed socio-economic model will include five independent variables to assess the impact on MYS for 97 countries from 1995 to 2017.
The remainder of this article is organized as follows. A brief literature review convers the same three influencing factors of dependency, urbanization, and income on MYS in Section 2. Section 3 presents the descriptive analysis on the triple relations between MYS and income, urbanization, and dependency. Section 4 explains the method and data. Analysis of the results follows in Section 5. Finally, the conclusion, implications, and limitations of our findings are discussed in Sections 6 and 7.
A Brief Literature Review of the Triple Relations
Our literature review continues to cover the impact of the three factors, dependency, urbanization, and income on educational attainment levels.
Dependency on Education
The literature containing the impact of total dependency rate on education is vast ranging from population and demographic studies, economic growth studies, sociological and educational studies. Since the world population is still undergoing a process of dynamic transition of population components due to falling fertility and increasing life expectancy, it is understandable that cumulative results of theoretical and empirical studies on the relationship between dependency and education are still in the process of consolidation.
There appears to be some consensus that increasing number of retirees from longer life expectancy is likely to be negative to longer duration of education. The major reason being that added financial burden is placed on shrinking working age population for increased payment of welfare, healthcare, and pension for the expanding old age dependency (Bloom & Williamson, 1998; Kelley & Schmidt, 2005). However, Lee (2003) and Lee and Mason (2006) cited the cases where an aging population accumulates more wealth which can be invested productively. Under the circumstances, increasing old-age dependency can have positive impact on education.
As for the impact of declining fertility, a recent empirical study (Crespo Cuaresma et al., 2014) using a panel data for 105 countries over the period 1980 to 2005 found that the improved labor productivity results from the changes in educational attainment level that takes place hand in hand with fertility decline. This idea was extended further by Lutz et al. (2019) that the so-called demographic dividend of improved productivity which was believed to have been generated by falling fertility which in turn led to relatively higher proportion of the working age population (or decrease of the total dependency rate) was incorrect. Rather, their results showed a clear dominance of improving education over age structure, thus claiming that education rather than falling fertility brings improved productivity.
The opposing view by Kotschy et al. (2020) concede an important role of education. However, they claim that the demographic dividend is more than an education dividend, specially among less-developed countries, suggesting the different impact may exist among countries with different income levels.
There is another group of studies dealing with the impact of declining fertility to education. The basic idea is that in developed economies, the fewer the number of children in a household, the higher will be the educational attainment level (De Graaf & Huinink, 1992; Kuo & Hauser, 1995; Steelman et al., 2002). On the other hand, in developing economies, the relationships can be negative, neutral or positive depending on different countries, culture, and family backgrounds (Buchmann & Hannum, 2001; Lloyd & Blanc, 1996; Maralani, 2008). In other words, the declining fertility, in general, can exercise a positive role of increasing educational attainments in developed economies.
Finally, there is still another group of studies showing that female education may be one of the key factor inducing fertility decline which results in the declining young-age dependency rate (Bongaarts, 2010; Cochrane et al., 1990; Skirbekk & Samir, 2012). For example, Lutz and Samir (2011) show that the projected 2050 world population size can decrease by 1 billion people when the lower fertility rate generated by better educated female is fully accounted for.
Urbanization on Education
In the literature covering the impact of urbanization on education. It is well-known that urbanized areas reduce transaction costs due to a close proximity among economic agents and provide economy of scale and knowledge spillover which allows for specialization among firms, thus leading to higher productivity (V. Henderson, 2003; J. V. Henderson, 2010; Kumar & Kober, 2012). Thus, human capital is highly concentrated in urbanized skill-intensive sectors. The interaction between urban areas and human capital will most likely accelerate economic productivity in these urban areas. (Flückiger & Ludwig, 2018). Thus, return to education are higher in urbanizations, as are literacy rates and average educational attainment levels: And children in urban areas are more likely to be enrolled in school (Bertinelli & Black, 2004).
In short, urbanization has displayed a positive role of lengthening the duration of education so that countries with high urbanization rate tend to realize longer education years for their adult population. One major reason is that urbanization will create more demand for jobs which require higher knowledge and skills that can be provided by more intensive education (Chen et al., 2014; Ignazzi, 2014; Turok & McGranahan, 2013). These jobs will command higher wages and are likely to lead to future promotion. Furthermore, urbanized countries can provide more efficient and effective matching of workers to jobs leading to high likelihood of finding well-paying employment for the educated. In other words, the social return from more education will exceed the private return from education (Ciccone & Peri, 2006; V. Henderson, 2003; Moretti, 2004). Therefore, people will be motivated to invest time and resources for more education in urbanized countries.
On the other hand, the traditional analysis of city size suggests that real output per worker may follow an inverted U-shape function of local scale, as measured by total urban employment (Au & Henderson, 2006; Duranton & Puga, 2001; J. V. Henderson, 1974). As cities get big, costs of commuting, congestion, and environment degradation will escalate to begin decline of real output per worker. In another study of North African and Sub-Saharan countries, the effect of urbanization on GDP per capita also follows an inverted U-shaped relationship where the peak of urbanization is around 73% to 70%. After this point, higher urbanization is associated with decreasing GDP per capita (Arouri et al., 2014).
In a related empirical study on urbanization and education, Bertinelli and Zou (2008) in their sample of 108 countries from 1960 to 1990 have also discovered a positive impact of urbanization on education. However, the range of positive impact was bounded by a lower and an upper threshold of urbanization rate. For the lower threshold, they have identified a 40% urbanization rate below which the positive impact of urbanization on education is substantially reduced. On the other hand, beyond a very high urbanization threshold, the marginal impact of urbanization on education decreased as well. In their study, the high threshold of education years in 1990 was estimated to impact only the upper 5 percentiles of countries. In short, their finding suggests that those countries with either very low or very high urbanization rate will experience less positive impact from urbanization on education.
Income on Education
A large number of empirical cross-country studies have established that the levels of educational attainment has a positive significant effect on the subsequent growth rate of income (R. Barro, 1997; R. J. Barro, 2013; R. J. Barro & Lee, 1993, 1996, 2000). However, several studies (Cohen & Soto, 2007; Hanushek & Kimko, 2000; Hanushek & Wößmann, 2007; Rogers, 2008; Schündeln & Playforth, 2014) have found an insignificant and even negative impact of human capital including education so that a big question “Where has all the education gone?” was raised (Pritchett, 2001).
In response, an interesting study by Ahsan and Haque (2017) using a dynamic panel threshold model involving 126 countries from 1990 to 2012 determined a significant capital stock per capita threshold value of 9.5. An implication was that only those countries having a capital stock per capita greater than 9.5 (include OECD and high income countries) experienced positive and significant effects of human capital, measured in averaged years of education. In contrast, the remaining countries below the threshold experienced insignificant impact from human capital. This indicates that human capital accumulation cannot assert its productive role of increasing income until the economy crosses a threshold level of development.
In short, the impact of education on income growth is, in general, positive. However, the extent of impact may vary substantially among countries in different regions such as in Sub-Saharan Africa or in different income levels.
To summarize, the results of reviewing the three relations, the growth of income and urbanization, in general, generate a positive impact on educational duration resulting in higher level of educational attainment. In contrast, increasing old-age dependency may provide a positive impact on lengthening educational duration. Another finding from the literature review indicates that these triple relations may be subjected to considerable variations depending on the levels of development such as income and urbanization. Therefore, this study will include a scaling analysis of the impact by dependency and urbanization on education by multiple income and urbanization subgroups.
Descriptive Analyses of the Triple Relations Among Education and Income, Urbanization, and Dependency
The three relationships between education and economic growth, urbanization, and dependency are complex and even more complicated because they involve multiple interactions among them. Therefore, an integrative framework of analysis is needed for a comprehensive analysis. However, we begin with a descriptive account of the past trends for these three relationships to provide relevant background information for the subsequent quantitative analysis.
For education and income, MYS for all 97 countries increased from 7.59 years in 1995 to 9.94 years in 2017 at a compounded annual growth rate (CAGR) of 1.24%. When the trend of MYS was analyzed to identify three subgroups of GDP per capita following the World Bank’s income categorization in 2017, the high-income subgroup achieved the longest MYS, followed by the upper-middle, and lower-middle subgroups throughout the period, as shown in Table 1 and Figure 1.
Mean Years of Schooling by All 97 Countries and three Income Subgroups (1995–2017).


Mean years of schooling by All 97 countries and 3 Income Subgroups (1995–2017).
The high income group includes 46 countries, with the averaged income of $29,627. The upper-middle income subgroup includes 29 countries with the averaged income of $4,687. Finally, the lower-middle income group includes 22 countries with the averaged income of $1,385.
The 1995 MYS for the high-income group was 9.13 years, followed by 7.25 years and 4.8 years, respectively, for the upper- and lower-middle income subgroups. Likewise, the 2017 MYS was 11.58 years for the high-income group, followed by 9.52 years for the upper-middle income group, and 7.06 years for the lower-middle group. The CAGR was more rapid when MYS was lower at the beginning year. For example, the CAGR for the lower-middle group was the fastest at 1.77%, suggesting that lagging groups in MYS tended to experience faster growth rates for a catch-up effect for these groups.
The second relationship between MYS and the urbanization rate was analyzed by categorizing countries into four subgroups of analysis, as shown in Table 2 and Figure 2, with varying levels of urbanization rates, as shown in Figure 3. To elaborate, the intensive urbanization subgroup had their minimum rate at 80%, followed by the minimum rate of 60%, the minimum of 50%, and the maximum of 50% for the high, middle, and low urbanization subgroups, respectively. There were 32 countries in the intensive group, while the high urbanization subgroup included 32 countries. The middle urbanization subgroup includes 16 countries and the low urbanization subgroup includes 17 countries.
Mean Years of Schooling by All 97 Countries and 4 Urbanization Rate Subgroups (1995–2017).


Mean years of schooling by all 97 countries and 4 urbanization subgroups (1995–2017).

Distribution of four urbanization rate subgroups in 2017.
The results indicated the intensive urbanization rate had the longest MYS throughout the period, followed by the high, middle, and low urbanization subgroups. The fastest CAGR of 1.51% belonged to the low urbanization subgroup, followed by 1.21% for the middle urbanization subgroup, 1.19% for the high urbanization subgroup, and 1.05% for the intensive urbanization subgroup. In other words, a faster CAGR for the subgroups with a lower (lagging) MYS suggested a catch-up effect for the lagging subgroups.
Third, the relationship between MYS and the dependency rate was examined by grouping countries into four subgroups with high, upper-middle, lower-middle, and low dependency rates, as shown in Figure 4. The high dependency subgroup contained 21 countries, while the upper-middle dependency subgroup included 25 countries. The lower-middle dependency subgroup included 13 countries, and the low dependency subgroup included 38 countries.

Distribution of four dependency rate subgroups in 2017.
The results demonstrated a negative role of dependency. The results revealed the shortest MYS of 8.25 years for the 21 high dependency countries versus the longest MYS of 10.45 years for the 38 low dependency countries in 2017. The differences among the upper-middle, lower-middle, and low subgroups were smaller compared to the results from the income and urbanization subgroup analysis, as shown in Table 3 and Figure 5.
Mean Years of Schooling by All 97 Countries and Four Dependency Rate Subgroups (1995–2017).


Mean years of schooling by all 97 countries and four dependency rate subgroups (1995–2017).
In summary, the descriptive analysis of these three relationships indicated that urbanization and income appears to play a positive role in increasing the number of educational years, while dependency appears to play an offsetting negative role in reducing the number of education years, as shown in Figures 1 to 3. However, due to multiple interactions among these three factors as well as the two additional determining factors of population size and internet users, a more precise estimation of the respective impacts of all the determining factors should be analyzed from the multivariate panel regression models.
Method and Data
STIRPAT Model
For the basic concept of analysis, we adopted the well-known environmental principal of IPAT identity (I = PAT) proposed by Ehrlich and Holdren (1971). The identity denotes I as the environmental impact from population (P), affluence (A) and technology (T). For the multivariate regression model, we used a more refined STIRPAT model, known as Stochastic Impacts by Regression on Population, Affluence, and Technology by Dietz and Rosa (1997), as shown in equation (1) as follows.
The STIRPAT model is expressed as

where a is the constant term of the equation, b, c, and d represent the parameters of P, A, and T, respectively, e represents the error term. Where the subscript i and t of each variable denotes the cross sectional unit which is the countries and time period, respectively. It is important to note that the STIRPAT model allows for the inclusion of multiple variables in place of technology (York et al., 2003). For example, several studies have included urbanization in place of technology to estimate the impact on energy, energy consumption, or emissions (Alam et al., 2007; Cole & Neumayer, 2004; Mishra et al., 2009; Poumanyvong & Kaneko, 2010; York, 2007). In addition, the STIRPAT model has been used to examine the impact of these variables in areas other than energy or pollution. Topics such as material flow, human ecological footprints, and environmental efficiency of well-being have been subjected to analysis by the STIRPAT model (Dietz et al., 2007, 2009; Haberl et al., 2011; Steinberger et al., 2012).
Although the STIRPAT model has not been used in an analysis of the length of education years, using the STIRPAT model may be conceptually appropriate. The reason is that the length of education, like energy consumption or CO2 emissions or other environmental measures, may be influenced by underlying factors such as population, income level, and technology. For our basic model, we adopted the STIRPAT model with urbanization representing technology.
To ease the task of estimating exponents, equation (1) is converted into the natural log-log form of equation (2) by taking the natural logarithm of both sides of the model. This may be because using the natural log is helpful as it converts non-linear variables to linear ones rendering the results to interpret as a percentage change. Therefore, we can use the following basic model of equation (2) for the panel data of mean schooling years:

where P denotes population size, A is GDP per capita, URB is urbanization, and a is the constant term for the equation. Y is a year dummy that captures a time-specified effect such as technology progress and other factors not captured by urbanization. C is a country dummy used to capture a country-specific effect such as the teacher’s competence and students’ intelligence level, which may affect the number of years of education. Including county and time dummies is a standard addition for panel data analysis (Woodbridge, 2006). Taking advantage of the flexibility of the STIRPAT model, we added two additional independent variables, a dependency rate and internet usage ratio, in our enhanced model of equation (3) as follows:
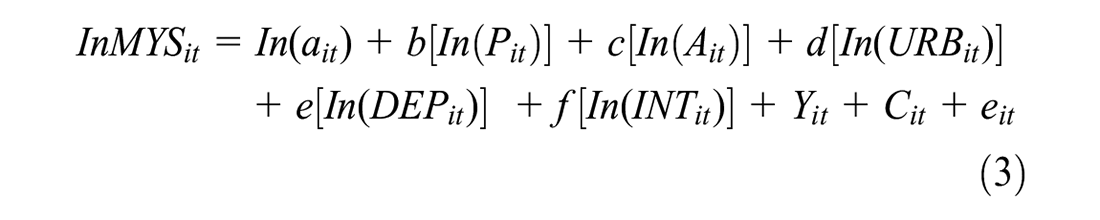
where DEP represents the dependency rate, while INT denotes the percentage of people who use the internet extensively. Another advantage from the use of equations (2) and (3) is that the coefficients estimated for the respective independent variables represent elasticities for the variables involved.
The basic and enhanced models represented by equation (1) and (2) used a balanced panel data set of 97 countries from 1995 to 2017. This data set is used to estimate the impact of the three and five independent variables on mean years of education.
This research uses three estimation methods for the basic and enhanced model for the three income subgroups and four urbanization subgroups of countries. The three estimation methods are fixed effects (FE), random effects (RE), and Prais-Winsten (PW), generating a total of 48 models. The results are listed in Tables 4 to 11.
Data Sources for 97 Countries (1995–2017).

Multivariate Panel Regression Models for All 97 Countries.

p < .10. **p < .05. ***p < .01.
Multivariate Panel Regression Models for High Income Subgroup (46 Countries).

p < .10. **p < .05. ***p < .01.
Multivariate Panel Regression Models for Upper Middle Income Subgroup (29 Countries).

p < .10. **p < .05. ***p < .01.
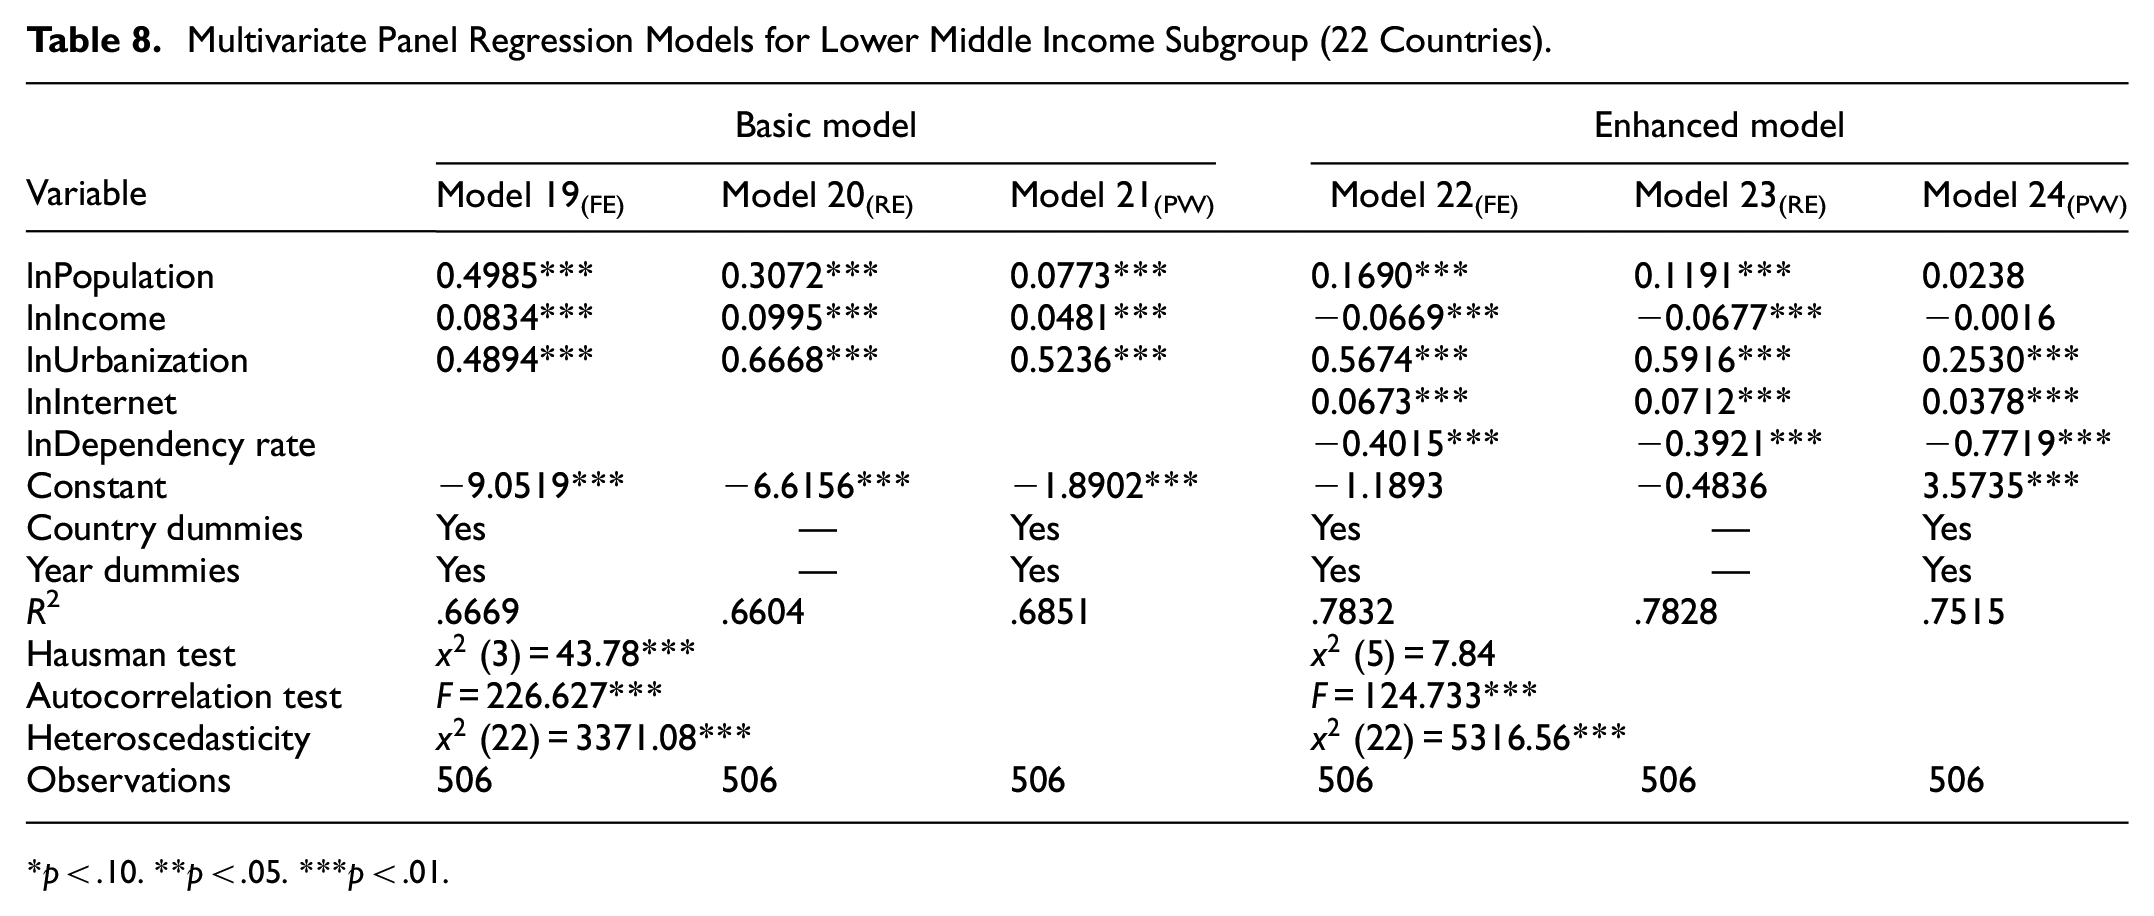
Multivariate Panel Regression Models for Lower Middle Income Subgroup (22 Countries).
p < .10. **p < .05. ***p < .01.
Multivariate Panel Regression Models for Intensive Urbanization Rate Subgroup (32 Countries).

p < .10. **p < .05. ***p < .01.
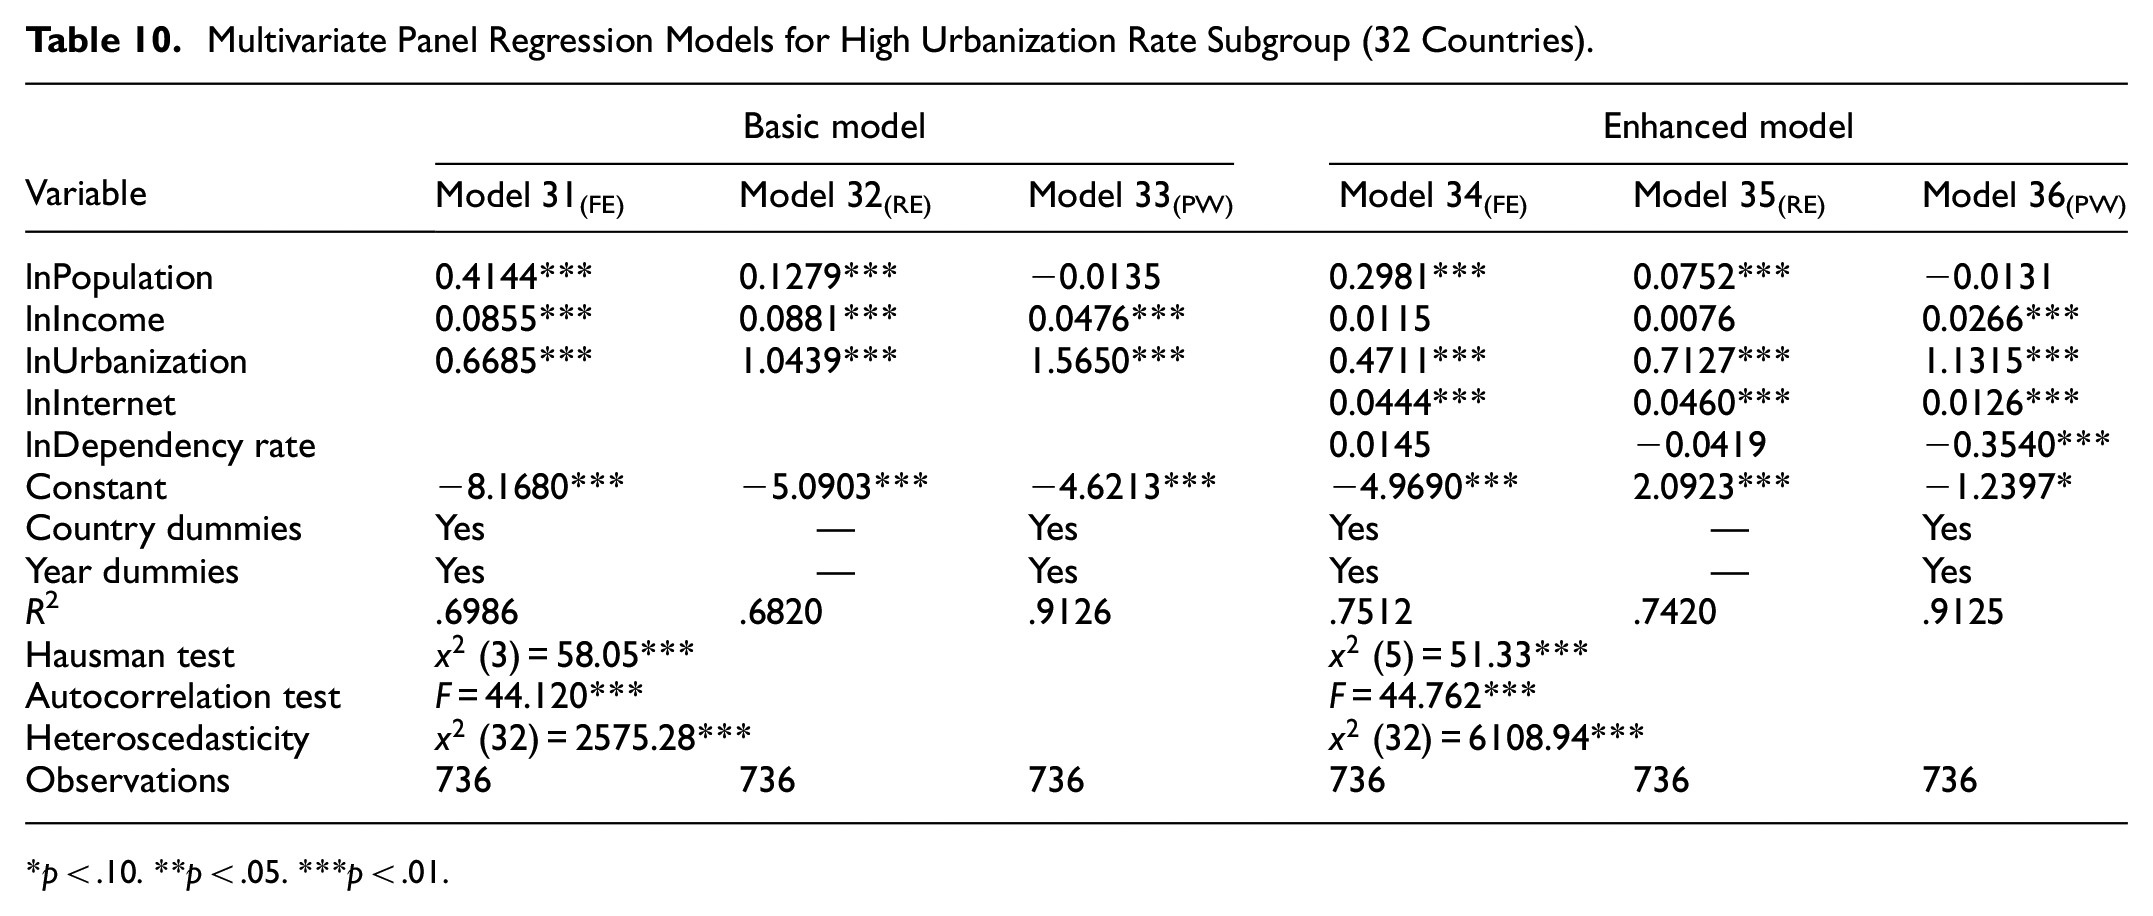
Multivariate Panel Regression Models for High Urbanization Rate Subgroup (32 Countries).
p < .10. **p < .05. ***p < .01.
Multivariate Panel Regression Models for Middle Urbanization Rate Subgroup (16 Countries).

p < .10. **p < .05. ***p < .01.
After obtaining results from the FE and RE estimation methods, we ran a Hausman test to select the appropriate method. In nearly all cases, the FE estimation method was selected over the RE method with two exceptions in models 4 and 22. Using the selected FE method, we ran an autocorrelation test (Zabel et al., 2002) and found serial correlations in all cases, as shown in models 1, 4, 7, 10, 13, 16, 19, 22, 25, 28, 31, 34, 37, 40, 43, and 46.
Based on the modified Wald test for groupwise heteroscedasticity (Greene, 2000), we also found the presence of heteroscedasticity in all the results using the FE method. To address these two issues, we used the PW estimation method with panel-corrected standard error. For this estimation method, we used a generalized least square framework that corrects for AR (1) autocorrelation within panels and cross-sectional correlation and heteroscedasticity across panels (Beck & Katz, 1995).
Finally, to check whether the data used in this study were stationary or not, we performed the unit root test of LLC developed by Levin et al. (2002). As shown in Appendix Table A1, the results indicated that there is a common unit root process, and the auto regression coefficient was identical across the cross-section. We then tested for multicollinearity among the explanatory independent variables in all of the PW methods using variance inflation factors (VIFs). The VIF values were all less than 10, as shown in Appendix Table A2, suggesting no multicollinearity (Chatterjee et al., 2000).
In sum, the coefficients derived from the PW estimation method are preferred as they are more free from possible distortion. Therefore, our analysis of results concentrated on the PW estimation method.
Data and Data Sources
First, we have downloaded data set indicating the mean years of schooling from 1995 to 2017 (http://hdr.undp.org/en/data accessed on 26th March 2020). Next, we have downloaded the population size, GDP per capita, urban population, individuals using the Internet, and total dependency rate from 1995 to 2017 (https://data.worldbank.org/ accessed on 9th April 2020). After data cleaning, which means the process eliminating missing data, we have used the final sample size of 97 countries with yearly balanced panel data for all variables. To elaborate on data sources, first, the averaged MYS during the study period was 8.85 years for 97 countries. Second, the population size of the countries was 53.7 million inhabitants. Third, the mean value of GDP per capita measured in current U.S. dollars was $15,765. Fourth, the average rate of urban population was 64.59%. Fifth, the averaged internet usage was 32.84%. Finally, the averaged dependency rate was calculated at 55.99%. Table 4 presents detailed description of theses variables, statistics, and the data sources for 97 countries during the study period.
Analysis of Results
The results from the multivariate panel regression of MYS for the 97 countries are listed in Table 5. We used models 1, 2, and 3 for the basic model, and models 4, 5, and 6 for the enhanced model. Our analysis of results primarily come from the results from model 3 and model 6 which represent the PW method of estimation. Among the three independent variables (i.e., population, income, urbanization) in the basic model, urbanization displayed the highest coefficient of 0.344, followed by the income coefficient at 0.0804, and the population coefficient at −0.0033, with R2 of .889.
When the two independent variables of the internet usage rate and dependency rate were added in the enhanced model, the relative importance among the five independent variables underwent a major change, as shown in model 6. The most influential variable was dependency at −0.3029, followed by urbanization at 0.2699, income at 0.0407, internet usage at 0.0319, and finally population at −0.0122, and all coefficients met the statistical test of significance. In other words, the two most influential offsetting factors were dependency and urbanization. Specifically, a 1% increase in dependency tended to generate a 0.303% reduction in MYS, while a 1% increase in urbanization was expected to increase MYS by 0.27%. In contrast, the impact from income was quite modest in comparison at 0.041%.
When the whole 97 countries were categorized into the three income subgroups, Tables 6 to 8 show the results of the multivariate panel regression of the basic model by high, upper-middle, and low-middle income subgroups. Once again, concentrating on the results from models 9, 15, and 21, representing the PW method of estimation, urbanization remained the most influential variable for each income subgroup. A 1% increase in urbanization generated a 0.524% and 0.216% increase in MYS, respectively, for the lower-middle and upper-middle income subgroups. However, for the high income subgroup, a 1% increase in urbanization generated an unexpected 0.107% reduction in MYS.
As for the enhanced model, the results from models 12, 18, and 24 showed that negative dependency coefficient increased substantially to −0.772 for the low middle income subgroup from −0.303 estimated for the whole 97 countries. However, for the high income subgroups the coefficient turned positive at +0.1139. In between, a somewhat smaller negative coefficient of −0.6408 was estimated for the upper middle income subgroup, indicating a pattern of declining negative impact of dependency on education, as the analysis moved from low-middle to high income subgroup.
The positive urbanization coefficient of 0.27 for the whole 97 countries remained nearly the same at 0.253 for the lower middle income subgroup. However, the urbanization coefficient decreased more than half to 0.108 for the upper middle income subgroup. The declining trend accelerated so that the high income subgroup displayed a negative urbanization coefficient of −0.134. All three dependency and urbanization coefficients met the statistical test of significance.
It is interesting to note that both dependency and urbanization coefficients displayed declining trend, as the analysis moved from lower middle income subgroup to high income subgroups. In other words, a negative impact of dependency on education diminished eventually to reach a positive impact, while a positive impact of urbanization on education also diminished to become a negative impact when the income subgroup analysis moved from low middle to high income subgroup.
The income coefficient was the third most influential variable for the high income subgroup at 0.049. However, the income coefficient was downgraded to the least influential factor for the upper-middle and lower-middle income groups. In contrast, the population coefficient was elevated to the third most influential factor for the upper-middle group at −0.074 and the fourth most influential factor for the lower-middle income group at 0.024. Internet usage maintained a moderately positive role and was the fourth most influential factor across all income subgroups.
In summary, the overall results from the income subgroup analysis tended to support the result from the whole group analysis in highlighting dependency as the most influential factor followed by urbanization as a distant second for the lower and upper-middle income subgroups. Income and population were the third most influential factor depending on the subgroup. The lower-middle and upper-middle income groups tended to emphasize population, while the whole group and high-income group tended to promote income over population.
To verify the findings from the income subgroup analysis, we used the same multivariate panel regression for the four subgroups of intensive, high, middle, and low urbanization subgroups, as shown in Tables 9 to 12. Once again, our explanation focuses on the PW method of estimation identified in models 27, 30, 33, 36, 39, 39, 42, 45, and 48.
Multivariate Panel Regression Models for Low Urbanization Rate Subgroup (17 Countries).

p < .10. **p < .05. ***p < .01.
First, the panel regression of the basic model of the three independent variables retained the same ranking order of influence of urbanization, income, and population within each of the four subgroups of intensive, high, middle, and low urbanization rate. However, the urbanization coefficients became substantially higher compared to the results of the income subgroup analysis. The coefficient for the middle urbanization group generated another high 0.867% increase in MYS from a 1% increase in urbanization. The intensive urbanization group coefficient with 0.4997 and the low urbanization group with 0.2339 followed. All these coefficients met the statistical test of significance.
Second, the four urbanization subgroups analyses of the enhanced model showed that negative dependency coefficients followed a declining trend moving from the low urbanization subgroup at −0.824 to the intensive urbanization subgroup at positive + 0.137, more or less duplicating the declining trend displayed earlier from the income subgroup analysis. In between, the middle and high urbanization subgroups displayed −0.666 and −0.354 respectively, consistently following the declining trend as the analysis moved from low to intensive urbanization subgroup.
However, positive urbanization coefficients estimated from the four urbanization subgroups produced an inverse U pattern. To explain, the low urbanization subgroup, yielded a low urbanization coefficient of +0.13, which was substantially smaller compared to +0.27 estimated for the whole 97 countries. And then, the middle urbanization subgroup’s coefficient increased rapidly to +0.553 and the high urbanization subgroup continued to follow an increasing trend yielding + 1.1315, a superlinear relation between urbanization and education. And then, the intensive urbanization subgroup containing 32 countries with very high urbanization rates unexpectedly generated the lowest coefficient of +0.0754, completing an overall inverse U shaped pattern. We will explain the possible causes for this pattern in the next section.
Once again, the third most influential factor was split between income and population. The intensive and high urbanization groups were impacted by income, while the middle and low urbanization groups were impacted by population. Internet usage again played a moderate role as the least influential factor.
In summary, the results of the analysis for both the income and urbanization subgroups tended to support each other by generating nearly the same order of influence in the context of the five determining factors. Dependency was clearly the most influential, followed by urbanization as the second most influential factor, and their effects tended offset each other. The analysis of both the income and urbanization subgroups, in general, derived negative coefficients for dependency and positive coefficients for urbanization. These findings represent the force against increasing further educational investment in a high dependency country and the force in favor of extending schooling years in an increasingly urbanized society.
The results for population, income, and internet usage, in that order, were evident for the income subgroups, while income, population, and internet usage was the general order for the urbanization subgroups. The coefficient values also varied substantially between the high versus low income subgroups as well as between the intensive versus low urbanization subgroups.
Discussion and Implications
Discussion of Data Analysis Results
There are several key findings from this research. First, for the whole group of 97 countries, the most influential variable positively impacting MYS in the basic model was urbanization, followed by income and population. For the enhanced model, however, the most influential factor was dependency, followed closely by urbanization and by the three remaining factors of income, internet usage, and population, all of which showed moderate influence. All five coefficients met the statistical test of significance, but dependency and population coefficients had negative signs, while the remaining coefficients had positive signs.
Second, dependency coefficients derived from the three income subgroups displayed the pattern of declining negative impact of dependency rate on MYS, as the income level of the subgroups increased from $1,385 for the low middle to $29,627 for the high income subgroup. To explain, dependency coefficient of −0.772 derived from the low middle income subgroup decreased moderately to −0.641 in the upper middle income subgroup at $4,687, as shown in Figure 6. And then, declining trend became much more rapid so that the high income subgroup of 46 countries reached the positive impact of +0.134, creating a wide range of 0.906(−0.772 to +1.34) between the subgroups. In other words, income scale advantage for the upper middle subgroup over the lower middle income subgroup generated a moderate 0.131 reduction of negative impact from dependency. In contrast, income scale economy for the high income subgroup over the upper middle subgroup generated a huge reduction of 0.755 (−0.641 + 0.114), as shown in Figure 6. In short, the overall scale relationship is such that the higher the income, the smaller is the negative impact of dependency to MYS. For the 46 high income countries, however, the impact of dependency on MYS turns positive, suggesting that for the rich countries, increasing dependency may not negatively impact the educational investment.

Scaling of dependency coefficients by three income subgroups.
There are several possible explanations, as mentioned in the literature review. One explanation is that in some developed economies, large amount of wealth accumulated and invested in the economy by an aging population can reduce the financial burden for public welfare payment for elderly (Lee, 2003; Lee & Mason, 2006). Another possible explanation is that smaller number of children per household typically found in developed economies often lead to higher educational attainment for children. With fewer children, parents are more actively engaged in guiding, coaching, and supporting the education process of their children (Buchmann & Hannum, 2001; Lloyd & Blanc, 1996; Maralani, 2008).
For the four subgroups of intensive, high, middle, and low urbanization, dependency coefficients displayed a similar declining pattern of scale economy where the low urbanization subgroups of 31.6% urbanization rate with the highest negative dependency coefficient of −0.824 which was followed by the middle and the high urbanization subgroups with smaller coefficients of −0.606 and −0.354 respectively. Eventually, the intensive urbanization subgroup of 86.1% urbanization rate displayed a positive coefficient of +0.137, as shown in Figure 7. The range of these coefficients was again wide at +0.961 (−0.824 to +0.137). The total group of 97 countries at 64.6% urbanization rate generated the same dependency coefficients of −0.303.

Scaling of dependency coefficients by four urbanization subgroups.
In short, similar to the results from the income subgroup analysis, the overall scale relationship is such that the higher the urbanization rate, the lower is the negative impact of dependency to MYS. However, the rate of decreasing negative impact increases rapidly, as the urbanization rate increases. Also, for the 32 intensive urbanization countries, the impact from dependency turns into positive, not negative, on MYS, as observed in the case of income subgroup analysis.
Third, the urbanization coefficient for all 97 countries with the average income of $15,765 realized a positive urbanization coefficient of +0.27. The same type of scaling analyses on urbanization coefficients by the three income subgroups displayed income scale diseconomy of declining positive impact of urbanization to MYS. In other words, the maximum positive impact on MYS from urbanization was reaped by the lower middle coefficient at +0.253, followed by the upper middle income countries with its smaller coefficient at +0.108. Finally, the high income countries ended up with a negative impact from urbanization on MYS at −0.134, as shown in Figure 8. In other words, the high income countries would experience a reduced MYS from an increased urbanization. However, the range of urbanization coefficients in the context of income subgroups was smaller at +0.387 (+0.213 to −0.134). Income scale diseconomy for the upper middle subgroup over the lower middle subgroup reduced the positive impact of urbanization to MYS by 0.145 (0.253–0.108). In contrast, the high income subgroup experienced a larger reduction of 0.242 [(0.108–(−0.134)] indicating a steeper scale diseconomy at work.

Scaling of urbanization coefficients by three income subgroups.
In scaling analysis on urbanization coefficients by the four urbanization subgroups generated the most dramatic urbanization scale economy of increasing positive urbanization impact on MYS involving the three subgroups of low, middle, and high urbanization. As shown in Figure 9, urbanization coefficients from the low urbanization subgroup was smallest at 0.13 which increased dramatically to 0.553 by the middle urbanization subgroup, and reached the largest coefficients of 1.132 by the high urbanization subgroup. One major exception occurs 32 countries where its urbanization coefficients unexpectedly dropped to +0.075 or near zero. In between the high and the middle urbanization subgroup, the total group of 97 countries with the average urbanization rate of 64.6% realized its coefficient of +0.27.

Scaling of urbanization coefficients by four urbanization subgroups.
In short, the scaling relation of urbanization coefficients discovered in this study follows an inverted “U” shape, indicating that the positive impact of urbanization on education may reach its peak at an optimal urbanization rate and begin to decline afterward.
Several past studies (Au & Henderson, 2006; Duranton & Puga, 2001; J. V. Henderson, 1974) on optimal city size have also discovered an inverted “U” function between real output and urbanization rate. Arouri et al. (2014) discovered the peak of urbanization rate from 73% to 70% between GDP per capita and urbanization from an inverted “U” shape function for African countries. Finally, the study by Bertinelli and Zou (2008) found that a positive impact of urbanization on education duration is bounded by a lower and an upper threshold, which also supports the inverted “U” shape function discovered in this study.
In summary, the most important finding is that when all five independent variables were examined simultaneously, dependency with a negative impact on MYS was the most influential factor, followed by urbanization with a positive impact on MYS. The impact from income with a positive impact and population with a negative impact was the third most important factor depending on the income and urbanization subgroup.
Implications for Research and Practice
Several policy implications can be derived from this study. The implications from the results of the whole group versus the income and urbanization subgroups should vary reflecting different results obtained between the whole versus subgroup analysis. For the whole group of 97 countries, the magnitude of a negative impact with a dependency coefficient of −0.303 was not substantially different from the positive impact of 0.27 from urbanization. Therefore, which of these two factors will play a more important role in the future depends more on the growth rate differential between the two factors. If the future CAGR of urbanization exceeds the future CAGR of dependency, an increasing MYS is more likely to occur and vice versa. Looking at distant future, it can be projected that urbanization may reach its peak sooner, while dynamics of population changes may continue. Under this scenario, the future impact of dependency may become relatively more important over urbanization.
The impacts from income and population are surprisingly modest compared to dependency and urbanization. However, the positive impact from income versus the negative impact from population provides another interesting dichotomy. Once again, the duration of future MYS will be influenced by the differential growth rate between income and population. Since the growth rate of income, in general, is expected to exceed that of the population growth rate, the net effect between these two variables would favor a longer duration of MYS. Finally, expanding internet usage will play a moderately positive role in increasing MYS.
However, the general policy implications proposed here are subject to substantial revision if the results from income and urbanization subgroup analysis are incorporated. For example, for the low-middle income subgroup of 22 countries, the net impact from combining the negative impact from dependency and the positive impact from urbanization would increase to −0.5189 (−0.7719 + 0.253) which is about three times higher compared to the results from the whole group at −0.104 (−0.385 + 0.281), as shown in Figure 10. However, the net impact from these two offsetting factors would be only slightly negative for the high-income subgroup at only −0.0204 (+0.1139–0.1343). For the upper-middle income group of 29 countries, the overall net impact would be highly negative at −0.5326 (−0.6408 + 0.1082), as shown in Figure 10. In other words, the impact from these two offsetting variables would vary widely depending on the income subgroup. Similarly, the net impact from the two offsetting factors between income and population would be affected by the income subgroup. However, the magnitude of the net impact from these two factors would be generally quite modest.

Offsetting Elasticity of Dependency and Urbanization for all and 3 Income Subgroups.
Finally, as for the policy implications based on the four urbanization subgroups, the results tended to be somewhat similar to the income subgroup analysis. The net impact from the offsetting factors of dependency and urbanization was the most pronounced in the low urbanization subgroup of 17 countries. The net negative impact from these two offsetting factors was high at −0.6933 (−0.8236 + 0.1303), followed by the middle urbanization subgroup of 16 countries at −0.1134 (−0.6662 + 0.5528), as shown in Figure 11. However, the net effect turned positive at +0.7775 (−0.354 + 1.1315) in the high urbanization subgroup of 32 countries and +0.2128 (+0.1374+0.0754) in the intensive urbanization subgroup of 32 countries. Somewhat similar but more modest net effects between income and population also exist.

Offsetting elasticity of dependency and urbanization for all and four urbanization subgroups.
Limitations and Directions for Future Research
There are several limitations that can become topics for future research. One major limitation is the omission of several other factors, such as government policy, age distribution, family background, and social factors (Buchmann & Hannum, 2001), which can influence educational attainment level. Another group of omitted variables, for example, may include interaction terms of combined influencing factors such as urbanization and population size, or internet usage and urbanization. These omitted variables when included in future studies can revise the results reported in this study. In other words, we have provided some evidences for the robust association between the five factors to educational duration, rather than evidences of causality.
In addition, the impact of legislation that determines mandatory MYS in individual countries has not been explicitly incorporated in this analysis. Another limitation is that this study is limited to an analysis of the quantity of education years but does not incorporate the quality of education. A natural extension of this study is to examine the effects of the number of education years on the quality of education. An interesting question would be to examine whether an increasing number of education years may elevate the quality level of education. Another extension of this research is to only examine the number of education years at the secondary and tertiary levels which may reveal a significantly different impact of the independent variables such as dependency and urbanization.
Conclusions
Despite these limitations, this study has verified a decreasing trend of negative dependency rate to length of education as the income level of subgroups increased reflecting the income scale economy. This study also found a decreasing trend of positive urbanization rate to educational length as income level of subgroups increased reflecting the income scale diseconomy. Similarly, this study discovered a decreasing pattern of negative dependency rate to length of education as the urbanization rate of subgroups increased reflecting the urbanization scale advantage. And this study discovered an increasing pattern of positive urbanization rate to length of education as the urbanization rate of subgroups increased reflecting the urbanization scale advantage as well.
Furthermore, this study highlighted the variable offsetting impact of dependency rate and urbanization rate to length of education for the respective income and urbanization subgroups of countries. These findings will become even more relevant as individual countries will experience variable growth rates in urbanization and dependency rate in the future. In addition, another offsetting impact from income and population to education years is also noted.
Footnotes
Appendix
(b) VIF Test for enhanced model.

| Enhanced model | ||||||||
|---|---|---|---|---|---|---|---|---|
| Variable | Model 6(PW) | Model 12(PW) | Model 18(PW) | Model 24(PW) | Model 30(PW) | Model 36(PW) | Model 42(PW) | Model 48(PW) |
| lnPopulation | 1.07 | 1.06 | 1.56 | 1.16 | 1.32 | 1.09 | 1.55 | 1.61 |
| lnIncome | 3.54 | 1.76 | 2.71 | 2.44 | 1.79 | 2.06 | 3.31 | 3.19 |
| lnUrbanization | 2.02 | 1.21 | 1.41 | 1.55 | 1.47 | 1.64 | 1.80 | 1.20 |
| lnInternet | 2.16 | 1.56 | 2.83 | 2.07 | 1.67 | 1.89 | 2.94 | 1.96 |
| lnDependency rate | 1.75 | 1.08 | 1.75 | 1.88 | 1.28 | 1.79 | 2.16 | 1.61 |
| Mean VIF | 2.11 | 1.33 | 2.05 | 1.82 | 1.51 | 1.69 | 2.35 | 1.91 |
Acknowledgements
The authors are very grateful for anonymous reviewers, who suggested many ideas to improve the quality of the paper. Competent help provided by two research assistants, Young Eun Kim and Si Yeon Jeong, at the Gachon Center for Convergence Research is appreciated.
Author Contributions
The authors contributed to the development, implementation, analysis, and writing of this study as follows: Conceptualization, methodology, and analysis—Y.S.C. and S.M.K.; original draft preparation—Y.S.C.; review and editing—Y.S.C.; M.J.K.; S.M.K, and S.J.J. All authors have read and agreed to the published version of the manuscript.
Declaration of Conflicting Interests
The author(s) declared no potential conflicts of interest with respect to the research, authorship, and/or publication of this article.
Funding
The author(s) received no financial support for the research, authorship, and/or publication of this article.
Ethics Statement
This study doesn’t have any ethical issues for animal and human studies.