
Abstract
The present article employs balance of payment constrained growth model (BPCG) to investigate the relevance of exports, capital movements as well as relative prices on growth performance of the United Kingdom from 1970 to 2018. It makes use of autoregressive distributed lag model (ARDL) for the analysis. It was found that the innovative BPCG model is suitable for the explanation of growth experience of the UK. Accordingly, Keynesian mechanism-income plays the dominant adjustment role in restoring equilibrium. More interestingly, the inclusion of relative prices and capital flows in the balance of payments constraint model tends to influence the levels of output but they do not exert any substantial effect on the balance of payment equilibrium growth rate of the UK. In conclusion, the prosperity and growth of the world (OECD countries) and the expansion of exports would help in guaranteeing the steady-state of the UK economy.
Keywords
Introduction
Contrary to the automatic adjustment mechanism of supply side economics, Thirlwall (1979) developed balance-of-payments-constrained growth (BPCG) theory—a subdivision of post-Keynesian macroeconomic model, which is focused toward explaining growth over the long-term period. The theoretical foundation of the model is constructed upon the idea that substantial number of nations tend to be restricted by balanced trade or a sustainably viable inflow of net capital over time, and it is additionally believed that this restriction puts a limit that is binding on growth of the economy in the long-run of most of these countries (Blecker, 2021).
In essence, BPCG model is a particular kind of export-driven growth framework, which principally accentuates the significance of export in easing constraints on the external account rather than other advantages of export related enterprises. Thirlwall (1979) represents one the most successful demand-driven theories to examine the long-run growth of economies. It contends that the main restriction on growth expansion and performance is the ratio of exports growth divided by income elasticity of imports:
On the contrary, recent studies have taken into consideration of “short-run” and “medium-run” periods in which long-run suppositions are not enforced; the dynamic character of the evolution to the long-term growth path; as well as the impacts of level constraints rather than in rates of growth (Blecker, 2021).
According to Blecker and Setterfield (2019), BPCG set up is comparable to other post-Keynesian frameworks because of its submission that growth of output in both long and short-run periods is driven by aggregate demand. However, potential output on the supply side tends to adjust endogenously (within bounds) in reaction generated by pressure in demand or gaps. Contrasting other models of growth by Keynesians, the BPCG perspective is differentiated by a concentration on externally rather than internally originated demand (Blecker, 2021).
The current seeming swing in attention away from a restricted focus on long run growth analysis is in tandem with the reinvigorated concentration on some variables including real exchange rate effects and capital flows in the BPCG theory. Many recent BPCG researchers tend to believe that these variables could fit into BPCG model; however outside of long-run growth situations (Blecker, 2021).
It is on this background that this study seeks to examine whether the inclusion of relative prices and capitals could play some adjustment roles in any period for the UK that is significantly confronted with trade deficits. It is important to assert that the UK external account imbalance is unusual in two ways. First, the UK has witnessed the principal post-war worsening in its export earnings; particularly manufactured trade surplus. Second, there is no any developed economy that has gone from surplus to deficit in its external trade in such a remarkable mode as the UK has done over the past six decades (Rowton & Cout, 2013). In addition, failing productivity of the oil and gas sector; upward rise in prices of energy and commodities; continued falling in net investment income; and an increasing UK transfer payments to others have also been identified as concerns to BoP stability of the country. To offset these negative developments, would it require sustained enhancement of a more competitive external sector to prevent further worsening of the country’s trade performance as well as some inflow of capital?
This study sets out to achieve the following objectives. First, to investigate whether BPCG framework is suitable for the explanation of the growth experience of the UK over the long-term period. Second, the study also attempts to examine whether these constraints are important considerations for the UK. Third, study determines the equilibrium growth rates using both the original as well as the modified versions of BPCG. It should however, be noted that this modified BPCG was initially formulated to address problems of trade deficits arising unfavorable terms of trade, with suggestion of resorting to external borrowing to support growth. However, given the persistent trade deficit in this very particular country, which has been attributed sluggish performance of visible exported oriented manufacturing, falling external competitiveness arguably necessitated by Dutch-disease, which has resulted in the decline in demand for manufactured goods produced in the UK possibly makes this adaptation fits into the peculiar case of the UK. To the best of our knowledge, while few cross country BPCG studies are available, there is no country specific studies that have discussed this subject for the UK economy. Therefore, the study contributes to existing literature and helps in ascertaining the universal legitimacy of the model based on the contextual application.
This research is structured as: Section 2 covers brief review of ex ant studies as well an overview of the economy followed by derivation of the model in Section 3. Data, empirical analysis and equilibrium growth computation are captured in Section 4. Finally, Section 5 gives the concluding remarks and policy suggestions of the study.
Theoretical Underpinning and Review of Related Empirical Literature
Theoretical Contributions
Four decades have elapsed since the emergence Thirlwall’s law; remarkable progress and adaptations have trailed this standpoint. Some of the extensions and modifications include the incorporation of capital flows-Thirlwall and Hussain (1982); sustainable deficit and debts—McCombie and Thirlwall (1997), Moreno-Brid (1999), and Bhering et al. (2019); interest rate payments on debt-Moreno-Brid (2003), North–South models-Dutt (2002), and Sasaki (2021); Multi-sectoral models—Araujo 2007; internally and externally constrained models—Soukiazis et al. (2014) and Panshak et al. (2019a); cumulative causation and alternative time frames Ribeiro et al. (2017).
Recently, BPCG studies have also extended Kaldor–Dixon–Thirlwall model developed by Dixon and Thirlwall (1975) to show among others that intensity of research is relevant for the generation of dynamic returns to scale or productivity (Romero & McCombie 2018); when related with the growth of national output (Romero & Britto, 2017) and technological gap and national innovation (Panshak et al., 2019b) tended to exert significant positive consequences on income sensitivities as well as structural change and transformation; thereby leading to robust external expansion.
Dávila-Fernández and Sordi (2021) modified their study to contend that the balance of payment equilibrium rate of growth defined by in perspective Thirlwall (1979) can be redefined to mean the epicenter of gravity as an alternative of a to the well accepted binding constraint. Originating from a novel re-interpretation of the Kaleckian model of growth of economic cycles, Dávila-Fernández and Sordi (2021) constructed a framework of asymmetrical cycles about the balance of payment equilibrium growth rate, in which (in particular condition) real growth of an economy is frequently beneath that equilibrium rate rather than above it explain short and medium run adjustments in BPCG model.
Empirical Review of Related Literature
Indeed, there has been massive study on the assessment of the authenticity of Thirlwall’s model as well as attack on the soundness of its basic and crucial suppositions. In this study, we restrict our review on investigating whether aside income, capital flows, and relative prices are also important considerations in growth process.
The original balance of payment constrained growth model
Thirlwall (1979) innovative model was first employed to investigate the long run growth experience of some selected developed countries including the UK, from 1951 to 1973 and 1953 to 1976 using OLS procedure. The result confirm that income is the most important adjustment, while relative prices play insignificant adjustment role.
Using cointegration technique for Slovenia, Beko (2003) estimated the strength of the Thirlwall’s law to show that long run relationship subsists between the variables (real GDP and real exports). On the basis of the result, it was concluded that pressures of BoP constraints on the growth of output necessitates shifts in elasticities of import and export flows.
Similarly, with the help of cointegration technique, Jayme (2003) applied the Thirlwall’s Law to the Brazilian economy using time series data spanning1955 to 1998 to show that there is a positive cointegration between growth in exports and long-term growth, which support the fact that external factors constrained the growth for the Brazilian economy.
Birkan (2017) employed ARDL econometric method to investigate the empirical legitimacy BPCG model for the Turkish economy over the past 50 years. The outcome revealed that the Turkish economy improved not only in Schumpeterian efficiency but also in the Keynesian efficiency since the past five decades. Since then, there has been growing empirical evidence that supports the idea that BoP and demand pressures perform a crucial function in the explanation of domestic income (Alonso & Garcimartin, 1998 to 1999; Hussain, 1999; see Blecker & Setterfield, 2019; Soukiazis & Cerqueira, 2012; Thirlwall, 2019).
Balance of payment constrained growth and relative prices
One of the key assumptions of the traditional BPCG model is the emphasis on the non-relevance of relative prices, premised on the hypothesis that qualitative advantage and hi-tech superiority are what matter most to external performance especially over the long-term period. The theory maintained that relative price depreciation could only influence export performance when there is continuous devaluation which is impossible. McCombie (2011) specifically observed that that even if the Marshall-Lerner requirements are met to eternally raise exports growth and to cut down the growth of imports, there would certainly be the need for nonstop devaluation of the currency, which is unlikely.
However, some studies have tried to distinguish between levels and change in relative prices and obtained positive outcome on growth. Ramzi employed ordinary least squares (OLS) general method of moments (GMM) econometric methodologies in the panel sample of 167 countries to investigate the relevance of change in relative export prices and RER devaluation at log level in growth. Even though the outcomes differ in the estimates by means of OLS, in the estimates using GMM econometric methodology to address the issue of endogeneity in the model; the series variables were found to statistically different from zero and conform to a prori expectation (negative and positive, correspondingly).
Following a different route, Boggio and Barbieri (2017) made use of evolutionary-Schumpeterian growth theoretical standpoint to assert that adjustments in relative prices have significant positive impact on export performance. Likewise, Bottega and Romero (2021) confirmed that income and technological attractiveness are more important in influencing the external performance of hi-tech manufactured products, whereas relative price devaluation is suitable for stimulating the exports of low-technological products.
In survey of new empirical evidence on the importance of real exchange rate, Rapetti (2020) and Demir and Razmi (2021), generally confirm that relative price depreciation tends to have implication on growth; however, these implications are less in the advanced economies compared to the developing economies.
Nevertheless, other economists have found insignificant effects of relative prices on trade. For example, Hussain (1999) computed equilibrium growth of African and Asian economies using the both the original as well as a modified model of Thirlwall (1979) by including both the real exchange rate and capital inflows. The result obtained did not diverge from the discovery of Thirlwall and Hussain (1982) apart from the fact that, in the later (extended version), the relative price effect is believed to have an inconsequential role.
Similar outcome was obtained by Ribeiro et al. (2020) anytime wage share and a measure of technological capabilities are incorporated into the model.
The conclusion that could be drawn particularly from Romero and McCombie (2018) and Ribeiro et al. (2020) is that relative prices are not really unimportant, nonetheless (to some extend) conduits through which the effects of deeper, fundamental determinants including the distribution of income and technical superiority.
Balance of payment constrained growth and capital flows
Following in the thoughts above theoretical underpinning, the first adjustment of the innovative law is Thirlwall and Hussain (1982). The authors put away the original BoP equilibrium hypothesis and permitted capital movement to fund the current account shortfall. They moved on to compare the growth rate determined by the extended model with the simple model and found that the former supplied more superior outcome compared to the rate determined by the later. The above extension was improved upon by studies such as Barbosa Filho (2001), McCombie (1997), Moreno-Brid (1999, 2003), and Medici and Panigo (2015).
Santos-Paulino and Thirlwall (2004) made use of panel data and times series to ascertain the implication of capital movement occasioned by trade openness or liberalization on export, import, balance of trade and the balance of payments for a sample of 22 developing countries and revealed that trade openness stimulates export growth, even though it also increases import demand, which tends to ignite crisis on the external account.
Similarly, Pacheco-López (2005) examined the relationship between exports, imports, and direct investment—a component of capital flow for Mexico using Granger causality procedure. The finding reveals that there subsists a two-way relationship connecting the series. Another implication of the study shows that even though, openness in trade improves export performance, it has also resulted in a high foreign content and the dislodgment of domestic firms, which has restricted the pace of growth of Mexico through constraints arising from the BoP.
Kvedaras et al. (2020) examined the dynamics of the BPCG model by considering its capability to perform unconditional forecasting of economic growth rates; specifically on a conventional BPCG set-up with non-zero net external loan. The authors predict the outlook of the economy by disaggregating historical expansion rates into a long-run growth section compatible with a stable external account and a cyclical growth element triggered by net movement of capital. It was found that BOP imbalances are likely in the short-term but in the medium-term, current account deficits have a tendency of adjusting, consequently conditioning output dynamics.
Darku (2012, 2018) for the Ghanaian and South Korean economies, respectively have shown the relevance of capital flows on the growth of income. Hence, besides the export growth, which happens to be the prominent preoccupation of the advocates of export-led growth development strategists, capital movements performed essential functions in the experience of these economies.
From the review of the literature, it is evident that Thirlwall law holds for several countries. While, there are numerous studies across the globe, the UK has only a handful of them: McCombie (1997) for three developed countries (UK, US, and Japan) as well as Thirlwall (1979). As an effort to improve on the above, aside country specific importance and advantage of the present study over ex ant ones, it makes use of extended version of Thirlwall’s model that captures capital movement as well as relative prices for the analysis. The choice of this extension is based on the mixed outcome of the additional variables; whether they could be relevant adjustment variables in short or long-run period for the UK.
Brief Overview and Performance of the UK Economy, 1970 to 2018
The UK economy has experienced tremendous structural changes over the past six decades. In 1950, the UK economy was a large manufacturing center and authority, which had over a third of its labor employment in the industrial sector and an additional million in coal mining. During this period, the country recorded a surplus in its trade in the manufacturing of goods equivalent to 10% of GDP. In addition, the country was unarguably a net exporter of power and energy resources in the global marketplace. As time passes, labor force working in the industrial sector shrunk radically. This unprecedented decline was even worst in the coal mining sector as it has more or less vanished. From trade surplus in the 1950s, there is at present a trade shortfall in manufactured goods identical to 4% of national income; and as result of a break the discovery of oil resources in the North Sea, the UK economy is at the moment an outsized net importer of energy resources. It should be however, noted that the hole created by the decrease in conventional manufacturing firms has essentially been compensated by a complete set of service ventures, which currently contribute for the large part job creation.
Since 1970, the performance of the UK economy has characteristically improved each fiscal year, even though there have been three major economic slowdowns. Following the slowdown of economic activities in the beginning of 1990s, the UK economy witnessed 16 uninterrupted years of expansion prior to output cut down in the wake of global financial crisis. From 2010, real GDP has been on the rise once more—salvaging the pre-slowdown points in 2013 quarter period. Even though, growth of the economy has averaged 2.28% yearly for the period 1970 to 2018; the UK real GDP growth still is below the growth rate of the entire globe (2.70%), and far below average growth of OECD countries (6.84%) for the same period (Figure 1).

GDP growth rate.
During the period of analysis, the growth of labor productivity was at 1.8% annually between 1980 and 2013. Output efficiency or productivity fell harshly in the wake of global financial crisis, 2009 in particular. A surprising scenario occurs between 2012 and 2013 where the growth productivity was in the negative trajectory and at the same time real GDP was rising. This perhaps, reflects high cost of labor market related factor input. This latest lacklustre performance of UK labor productivity comparative to its long run drift is often described as the “productivity puzzle.”
Regarding balance of payments, an unfavorable trade balance exists anytime an economy imports more than it exports (a downbeat in trade balance). Even though exports and imports have been increasing, it is clear from Figure 2 that imports bills have largely been above exports earnings. It is obvious that the current account is characteristically in the negative region with the exclusion of the downturn part of 1980 to 1984. Throughout this time imports were predominantly small, which turned the UK into a significant net exporter of oil (Nickell, 2006). Moving further, it is clear that the UK has recorded a trade deficit in goods and services in every year since 1987 apart from 1997. The UK’s current account deficit reached a peak of £84.9 billion in 2014 (Office for National Statistics, 2018). The trade deficit is even worse when it is compared the United Kingdom huge import bills and the European ever since the late 1990s. Nickell (2006) pointed out that over the past 20 years, the average annual deficit has been around 2% of GDP and shows no signs of diminishing. Indeed, the trade deficits continues to worsen and only substantial offsetting net income flows seemed to have contained the current account deficit within bounds.
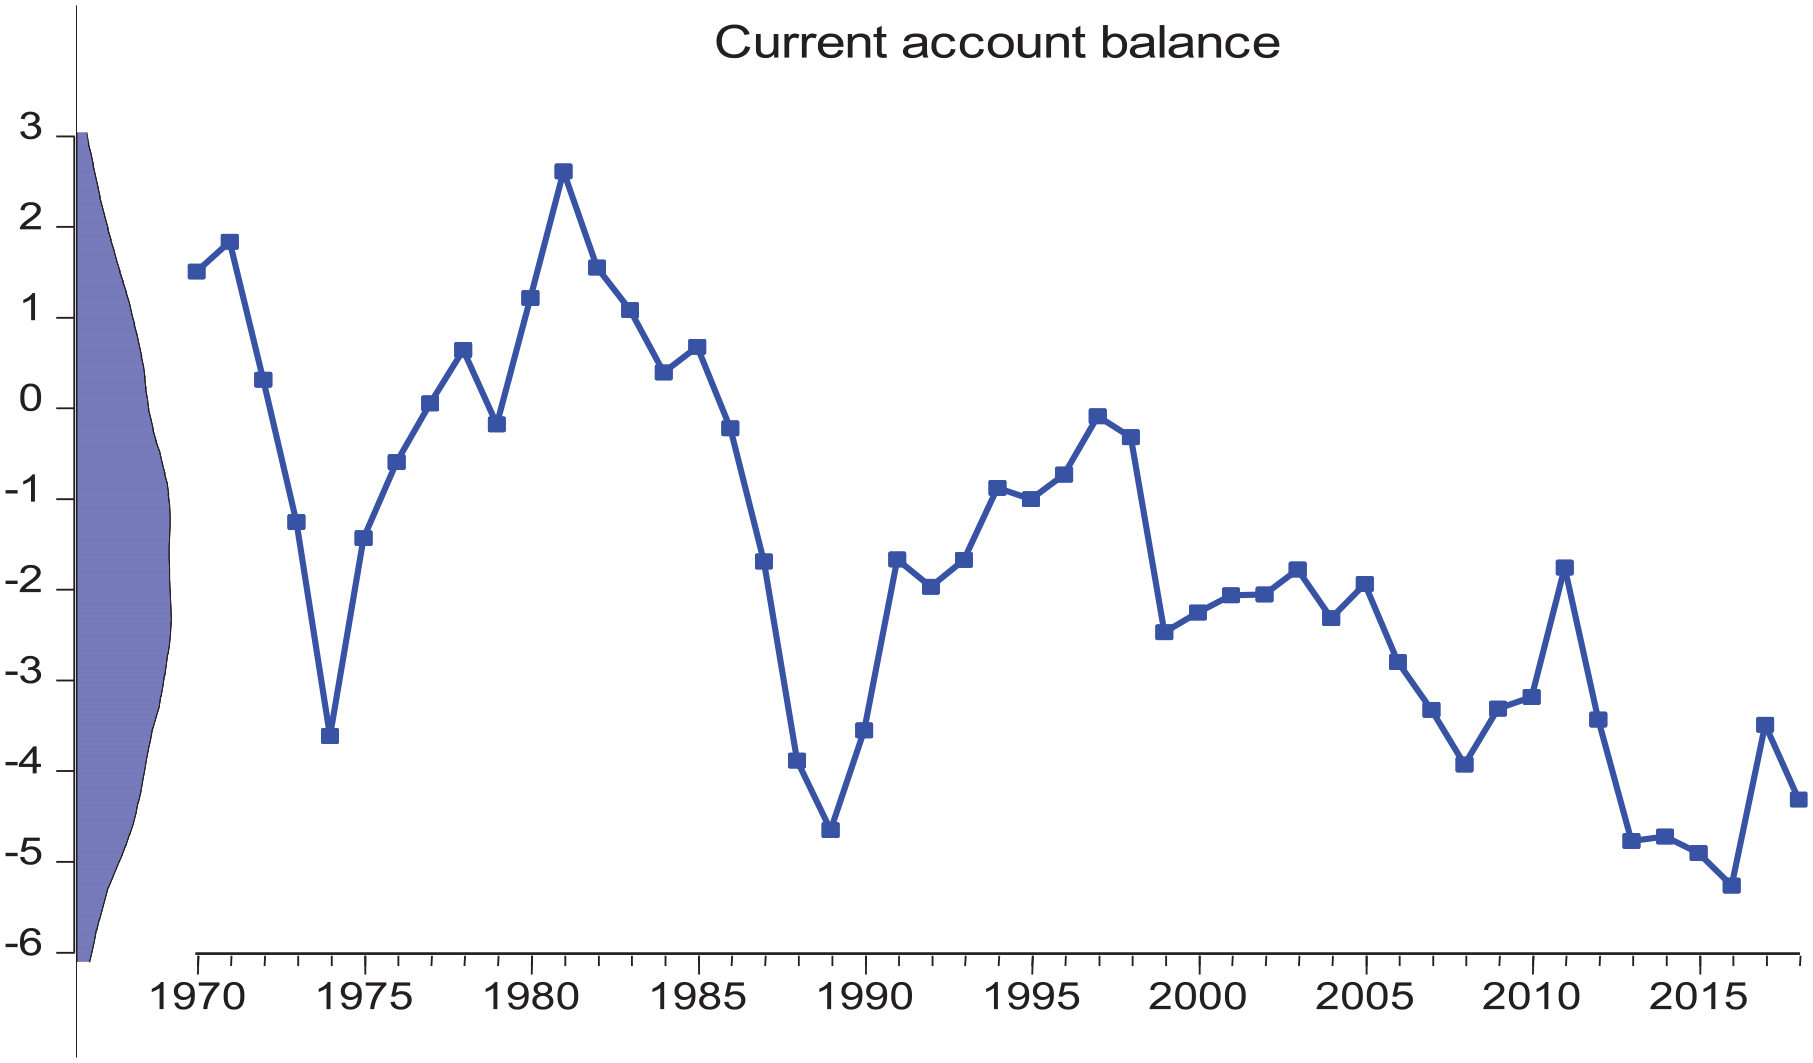
The movement of current account balance.
It is quite worrying to observe that whereas the UK tends to gradually witness some sort of deindustrialization, emerging economies including the People’s Republic of China as India have improved their share of world trade, with their manufacturing industries profiting from access to innovative technology and from large of production economics. This has reduced the possibility of small-scale manufacturing enterprises of the UK origin selling overseas, although at the same time enlarged the chances of UK households and firms importing from these economies.
Similarly, a deeper look at the UK balance of payment shows that the economy records some surpluses on its services (i e. exports of services exceed imports of services) balance of trade (Office for National Statistics, 2018). On the average, current account deficit amounted to −1.66% from 1970 to 2018. Therefore, efforts toward boosting exports goods and containing imports, especially the final components seem necessary.
Moving forward, capital flows have tremendous implications on growth performance. Theoretical economics contends that global capital movements have the potentials of boosting growth and could be a catalyst of optimism for respective countries. Whereas capital movement could supply economic and monetary solidity advantages, together with diversification from peculiar risk, they besides create financial market conditions more simultaneous crosswise jurisdictions and generate conduits for contagious occurrences. Here, the study considers overall official and private movements seen as the summation of authorized development aid, other authorized flows as well as private capital movement. Overall official capital comprises the summation of concessional and non-concessional capital flow to Southern economies, plus export credit, which have a first and foremost business-related drive. The private capital flow component is seen as flows at nominal rates and financed using private sector financial funds as well as unofficial aid (Figure 3).
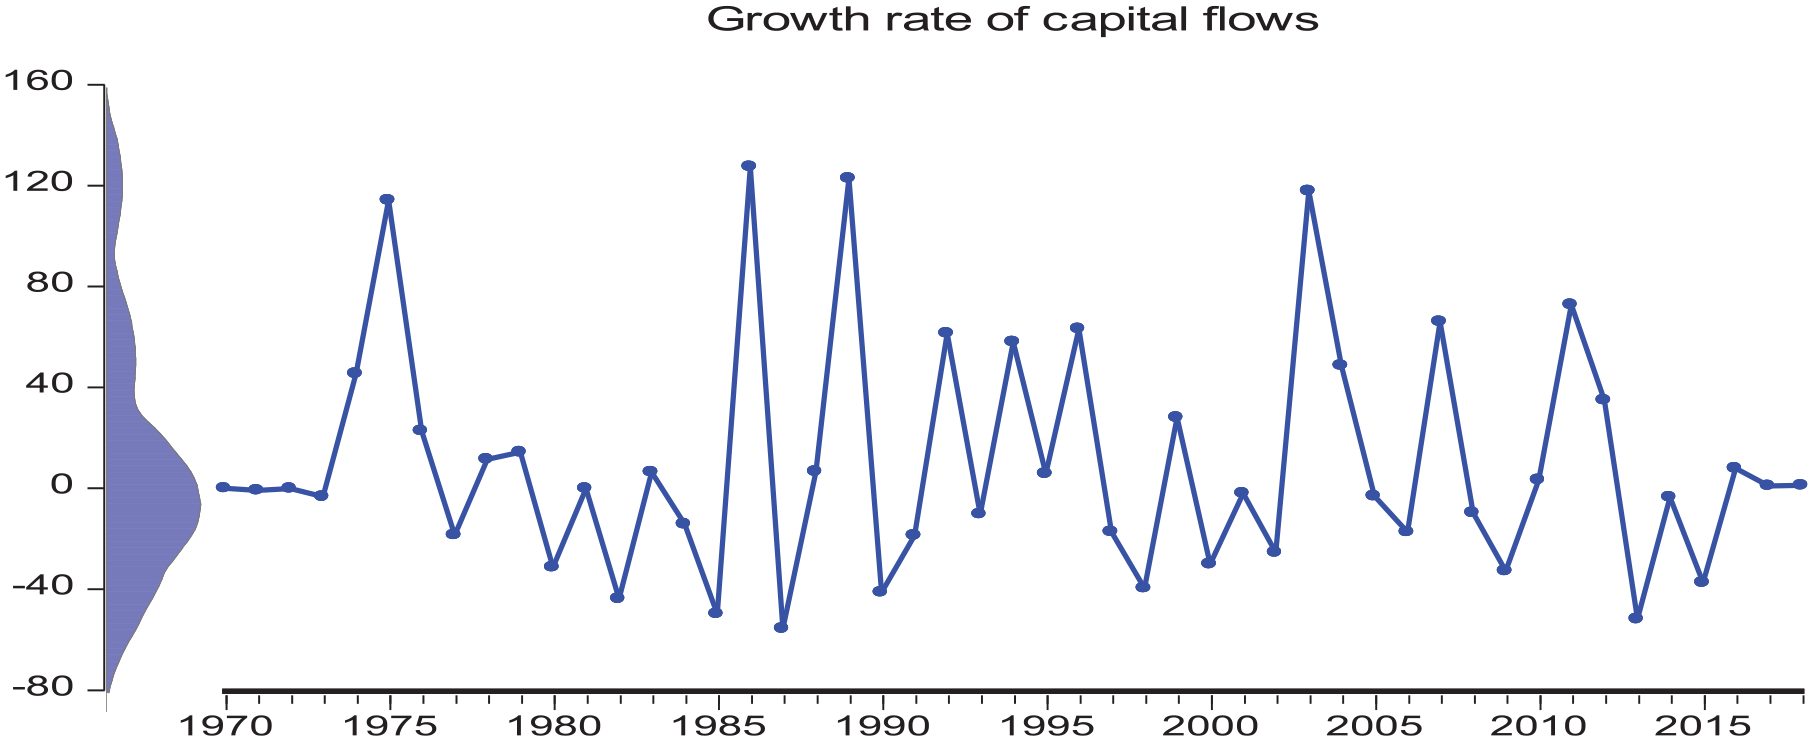
The growth rate of capital flows.
While, interest rate in the UK has been generally low (0.5% ever since 2009), which could spur domestic production, this may not be sufficient to attract foreign inflow of capital to perform some adjustment role in the dimension of recent consensus in BPCG perspective.
On the import side, it should be noted that the country arose from the Second World War in a challenging macroeconomic condition. Significant percentage of her external resources had vanished in the combat and earnings from this source were sternly worn-out. The relative prices of import of food as well as intermediate/raw materials were extremely high, and a huge trade surplus was essential to finance for the import of critical and vital items. In the 1950s, UK was still among advanced and industrialized nations nonetheless its condition looked risky. Moreover, global rivalry was about to deepen as the war-ravaged European continent improved and different challengers appeared in the Asian region. Before 1970, the nation had required an enormous trade surplus particularly from the manufacturing side, since there was no alternative means to finance for the outsized and luxurious imports of food and intermediate/raw materials products. This remains one of the major origins and drivers of UK’s excessive import demand.
The ascension of the UK into the European Economic Community (later the European Union) substantially increased the import propensity of the country in the first quarter of 1970 and more particularly after the establishment of the single market in Europe in the initial parts of 1990. During this period, imports of the UK increased from a share of merely below 14% of GDP in the first quarter in 1970 to about 20% in 1991 with a further marked increase to just under 30% in 2007—principally because of robust expansion of imported products from the of European Union. Viewing from the angle of the euro area, the imports of the UK increased as a percentage of euro area external demand, from about 12% at the time of Economic and Monetary Union in 1999 to virtually 16%—the largest single recipient—at its peak in 2006 (WDI, 2021).
The growth of import decelerated noticeably following the global interruption to global trade during the international financial crunch. UK import growth has almost halved since the global financial crisis, with the yearly growth rate averaging roughly 3% over the period spanning 2011 to 2020 compared with just over 6% between 1992 and 2007 (Figure 4).
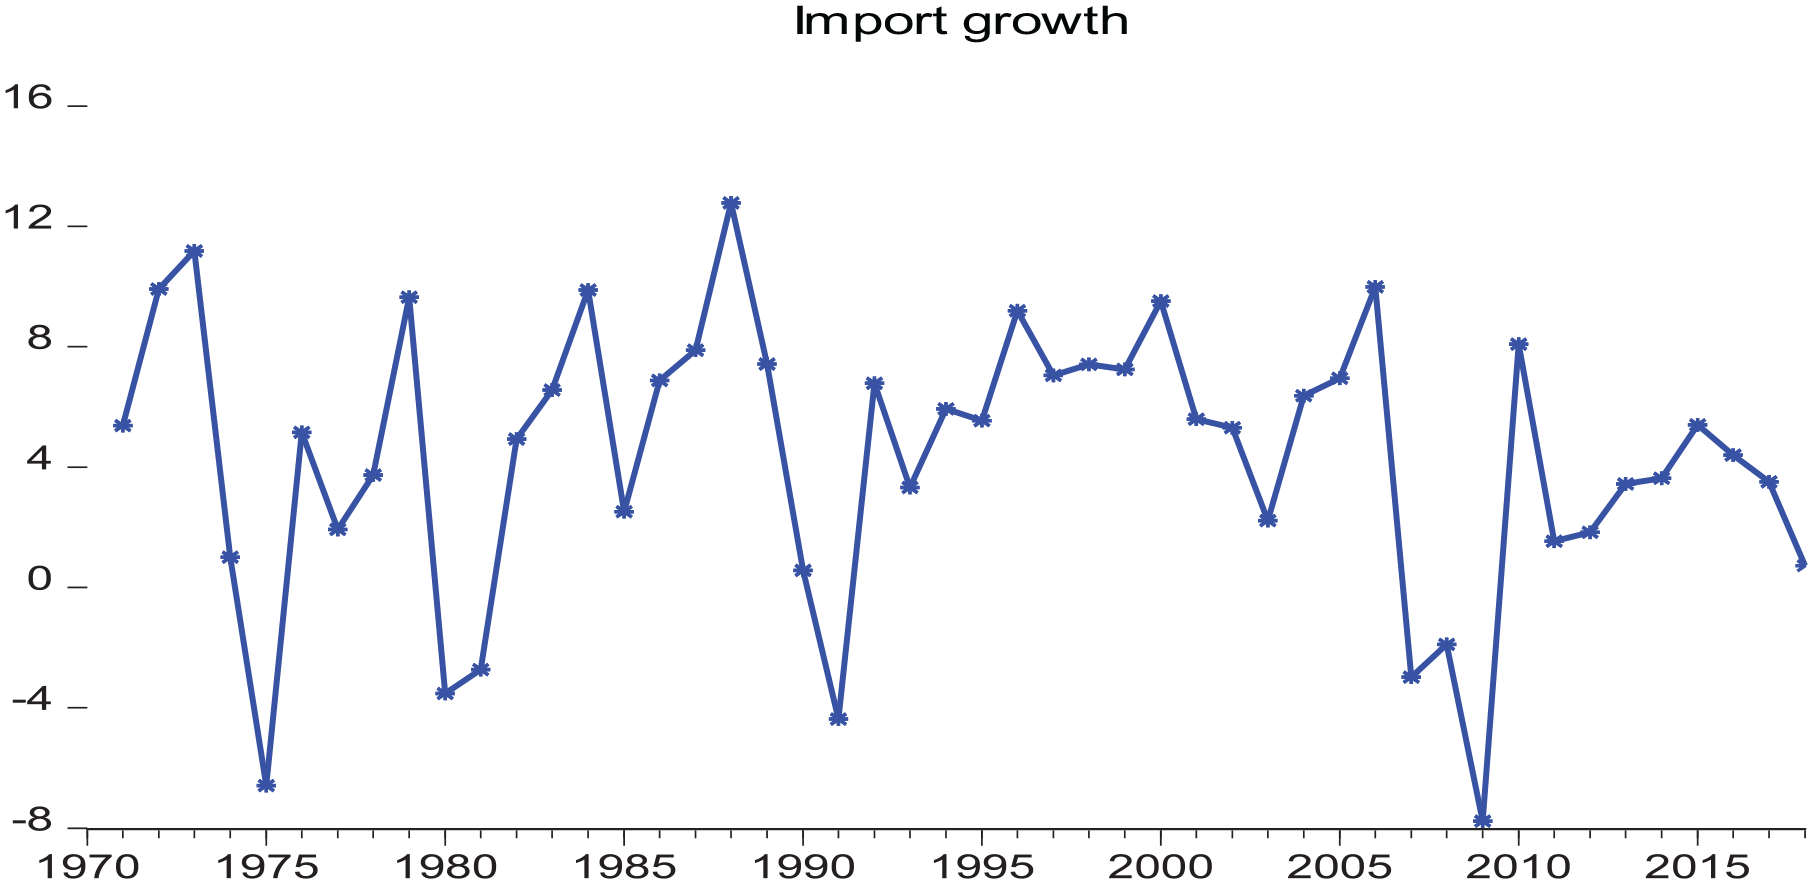
Import growth.
Consequently, at the beginning of 2020 the percentage of imports in GDP tended to remained nearly unchanged from before-crisis levels. In general, the import trend of the UK largely rests in the positive trajectory reflecting its continuous mounting import demands.
Model Specification
The mode specification of the model starts with original BPCG model, which comprises two equations and a BoP equilibrium condition as:


Here, X captures the level of exports,
The first difference of the variables in equations (1) and (2) in logarithmic form yield, equations (4) and (5).


Where

Where
The most critical question that demands answer has to do with which constraint (s) perform(s) the adjustment role to bring about this balanced condition in the long run period? From the original model, growth of world income,
Nevertheless, the BPCG theory believes that it is real income that does the significant adjustment role to bring the value of imports and exports in equality in order to maintain the balance of payments equilibrium (Thirlwall & Hussain, 1982).
Two basic ways could be used to show that the impact of relative prices is infinitesimal in the long-run. First, given the assumption of elasticity pessimism as explained in Blecker (2021), it is possible to assert that the Marshall-Lerner condition is not satisfied, and instead
Following either way, the relative price variable would be dropped out of equation (6),
which enables the solving for the balance of payment equilibrium growth rate:

Again, if change in relative prices

Equations (7) and (8) are the BPCG rates; they are also known as strong and weak versions of Thirlwall’s law, respectively (Perraton, 2003).
Moving further, Bahmani et al. (2013) in the survey of empirical studies over a decade have observed that most BPCG theorists have rather inclined toward elasticity pessimism, and have obtained varied outcomes (at the best) for whether price sensitives are sufficiently high to meet the Marshall-Lerner condition. But, if the price sensitivities are sufficiently high to meet the requirements of Marshall-Lerner condition (

It can be seen that growth can in theory be decomposed into three constituents:
(i) domestic income growth linked to changes in real TOT (terms of trade): (
(ii) domestic income growth linked to changes in terms of trade combined with the price elasticities of exports and imports: [
(iii) domestic income growth linked to exogenous adjustments in world real income
This study in agreement with recent consensus in BPCG literature assert that equation (9) is applicable to the short and to the medium-run periods, and perhaps, over the very long-term period, where the law of one price (LRR-PPP) is more probable to hold. Blecker (2021) contended that equations analogous to (9) are correspondingly employed in some investigations of the evolution to a long-run equilibrium characterized by the parsimonious Thirlwall’s law. The author further clarifies that, even though, it is imperative to highlight that short; medium as well as long runs are never particular measurements of period (on an annual basis or decades); they are investigative concepts that are well-defined by which series are assumed fixed or could change and what equilibrium states are applicable. As an illustration, real exchange rates and capital flows may be exogenous given in the short-term period; and could adjust in an endogenous manner in the medium-term, and fixed (at equilibrium levels) over the long-term period.
Equation (9) could be described as the equilibrium rate of growth that is consistent with perpetual trade balance (as in trade balance identity (3)), and the growth rate, in which the economy will inevitably incline, given that countries are reluctant or incapable of attracting perpetual net flows of capital (Setterfield, 2011).
Nevertheless, it is plausible to argue that this hypothesis is highly restraining and limiting, and that some countries (including, the US and in the present case, the UK) could and often attract (quasi) enduring net capital inflows that leads to nonconformities of equation (3) in the long-term. Note that one aspect of the underpinning of BPCG theory of Thirlwall’s Law—is the idea that, export earnings are necessarily required to finance for any import bills in the long-run period. How then long-run growth is influenced by the easing of the equilibrium state in equation (3); which is one of the fundamental postulations of the established BPCG framework—to permit for long-lasting trade deficits and (congruently) enduring net capital inflows or outflows? Providing solution to this question requires a brief re-specification of BPCG model to include capital inflow as:
Where, F represents nominal net inflows of capital from oversea. It should be realized that, by specification,
Where,
And expressing every term in growth terms and in lower cases:
Where,
Substituting equations (4) and (5) into equation (3b) and algebraically solving for domestic income (with appeal to long-run purchasing power parity) gives rise to:

Where
It is clear that we will observe

It should however be noted, that if:


And if k > x, then:

Such that:

Putting it differently, in the limit, total foreign exchange revenues will originate from net flow of capital. Nevertheless, this is hardly believable—loaning from overseas will assuredly stop earlier this extreme is attained. This, subsequentially, implies that the tendency of k > 0 to accelerate growth ought to be viewed strictly as short-run result—such that equation (10) cannot signify equilibrium growth rate of an economy over the long-term period.
Assuming that k = x =

Therefore, Thirlwall’s Law as initially obtained in equations (7) and (8) reaffirms itself, and it is found that k > 0 has no significant impact on equilibrium growth rate in the long run.
Concluding the model specification section, price effects or capital flows could impact only short or perhaps, medium run growth. Therefore; policies designed to increase productive capacity will not stimulate the equilibrium growth rate.
Data, Econometric Model, and Estimation
All series are sourced from the WDI excluding capital flow and real GDP which are obtained from OECD and Federal Reserve of Saint Louis respectively, from 1970 to 2018. World income is measured by Gross Domestic Product of OECD countries at constant prices. Growth of the UK economy is measured by GDP at constant local prices. REER measures price competitiveness and pure changes in relative prices. Capital flow is the total of both private and official inflows of capital. We made use of constant local prices of exports and imports. The series expressed in log form to help the estimation and the interpretation of the coefficients in terms of elasticities.
The study uses ARDL or bound testing procedure to evaluate the long run associations between the series as put forward by Pesaran et al. (2001). This econometric methodology is superior to conventional cointegration methods in so many ways. For instance, the procedure is suitable in testing long run relationship among variables especially when they differ on the degree of integration. Consequently, carrying out unit root test may simply be essential only to ascertain that none of the series is of any order of integration more than 1. The bounds testing approach to cointegration supplies efficient long run estimates with valid statistics. This technique is very advantageous when the sampled data is not large enough, since it a singled-equation related. Its estimated coefficients are unbiased, hence close to the long-run values, notwithstanding the tendency of some independent variables to be endogenous. Correspondingly, given that the period is comparatively long, we also observed if there are any structural breaks in the variables.


For cointegration investigation; we re-specified equations (11) and (12) such that the expected value of ΔXt and ΔMt are modeled as conditional error correction models (ECM):

And;

Where, ∆ and
Unit Root Test and Descriptive Statistics
The study establishes the stability of the variables with the use of structural break unit root as given by Perron (1989) and Zivot and Andrews (1992). While the former, specifies an a priori predetermined by break points, the later determines break endogenously from the variable.
The outcome of the Perron as seen in Table 1, indicates that the determinants are integrated of the different orders; hence the necessity of using the ARDL econometric procedure. All the variables are stationary after first differencing except world income which is stationary at level. There are structural break points in the variables, hence the need to carry out the estimation with significant dates.
Perron Unit Root Test With Structural Breaks.

Source. Own computation.
p and **p signifies stationarity at .01 and .05 significant levels, respectively.
The research confirms the result of the Perron test with Zivot and Andrew test in Table 2 that the data are of different order of integration.
Zivot and Andrew Unit Root Test.

Source. Authors’ computation.
p and **p signifies stationarity at .01 and .05 significant levels, respectively.
Moving further, descriptive statistics and covariance/correlation analysis are carried out as can be seen in Tables 3 and 4, respectively. A perfunctory glance average growth of the UK from 1970 to 2018, it is said that economy grew at about 2.28% annually. The highest and lowest growth rates are 6.50% and −4.25% corresponding to 1973 and 2009, respectively.
Descriptive Statistics.

Source. Own computation.
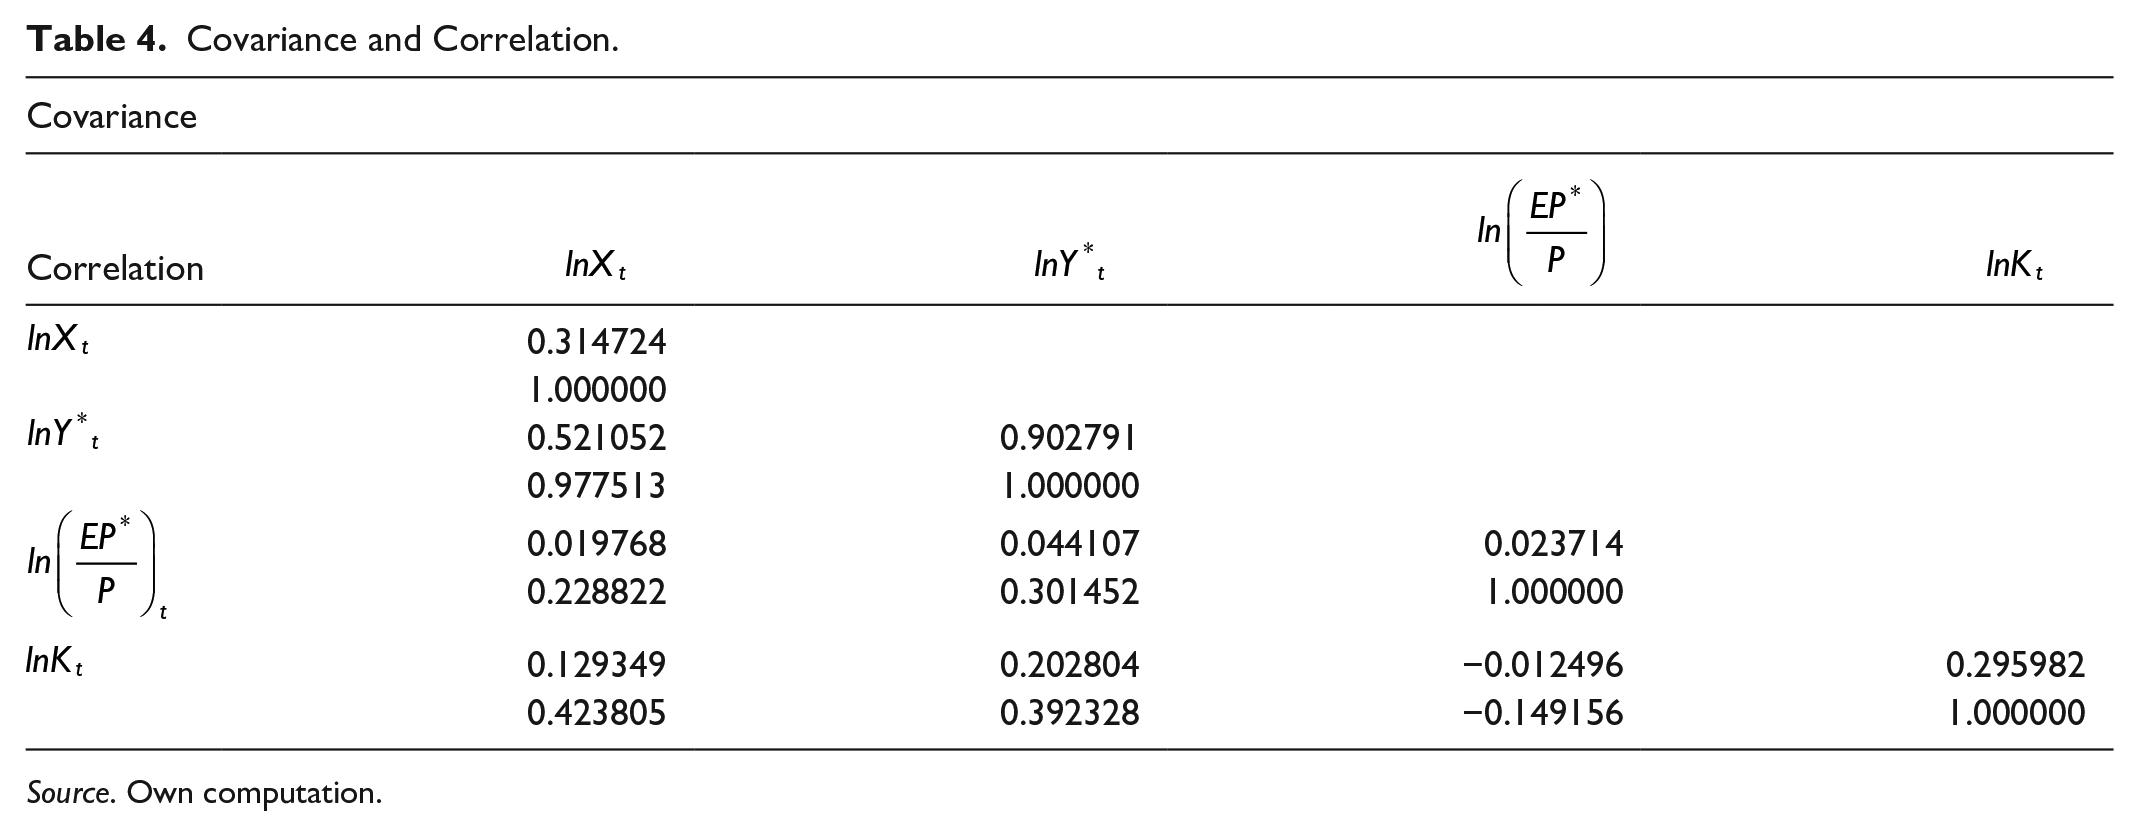
Covariance and Correlation.
Source. Own computation.
The maximum growth rate tends to corresponds to the golden age in Europe, hence, could be regarded as positive implication of Britain’s joining the then European Economic Community (European Union) in 1973. The lowest growth rate could be attributed to consequences of global financial crisis of 2008/09. In view of the value of standard deviation of about 2.07%, it is said that a substantial deviation in the variable. This conclusion is arrived at when we also consider the noticeably high coefficient of kurtosis 4.34, which demonstrates that the real growth of the domestic economy is leptokurtic in nature. The Normality test using Jarque-Bera indicates that the distribution of the variable is not normal. Three out of the four remaining variables were found to be normally distributed.
Regarding the covariance and correlation in Table 4, worthy of mention is the evidence of a strong positive correlation between exports and world income. Similarly, the capital flows and exports are directly related. While these preliminary outcomes tend to agree with apriori expectation of the study.
Estimated Results and Discussion
This section starts by the investigation of whether or not there is long run relationship between real exports, world real, REER, and capital flows over the study period. The analysis follows a logical process by alternating the forcing variables. For instance, the export equation in the first column was estimated with
ARDL Cointegration Analysis.
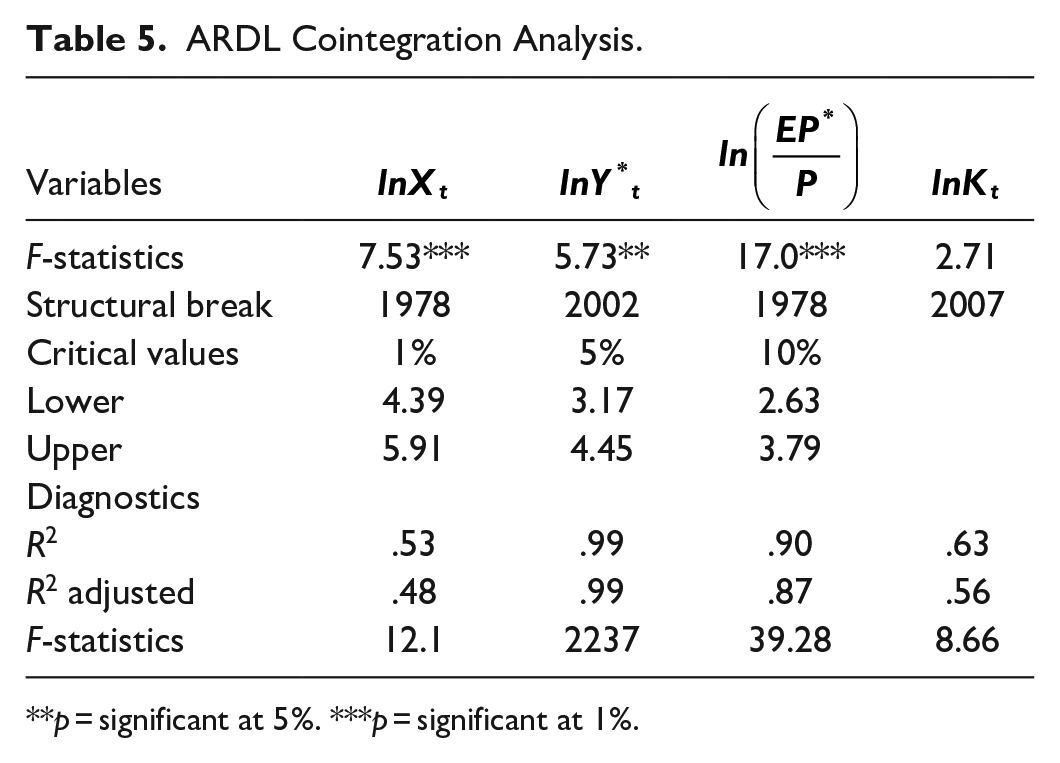
p = significant at 5%. ***p = significant at 1%.
The estimated coefficients of F-statistics, that is, 7.53, 5.73, and 17.0 all fall outside of the upper critical bound at 1% and 5% level of significance, anytime we made us of exports, world income, and REER as forcing variables in the presence of structural break points including 1978, 2002, and 2007. This means that three cointegrating equations were found; hence the null hypothesis, which indicates the absence cointegration amongst the series, is rejected. This implies that there is a relationship between exports, world income REER, and capital flows for the UK over the period of analysis.
The impacts of the regressors: log of the world income and the log of relative prices on export are shown in Table 6. The income elasticity is expected to be positive. An increase in relative price represents an appreciation of the domestic currency; hence, the expected sign of the relative price is negative. From Table 5, it could be observed that the income elasticity is correctly signed and significant at .01 level. The positive and significant coefficient of income sensitivity of the demand of exports shows that exports earnings would increase as world income increases. Accordingly, 1% increase in foreign income tends to raise exports by 0.67% for the UK. The coefficient of REER is found to be negative and achieved only significance the 10% level, with substantial deviation. Even if we accept the significance of relative prices, it does not satisfy the Marshall-Lerner │
Long and Short Run Results.
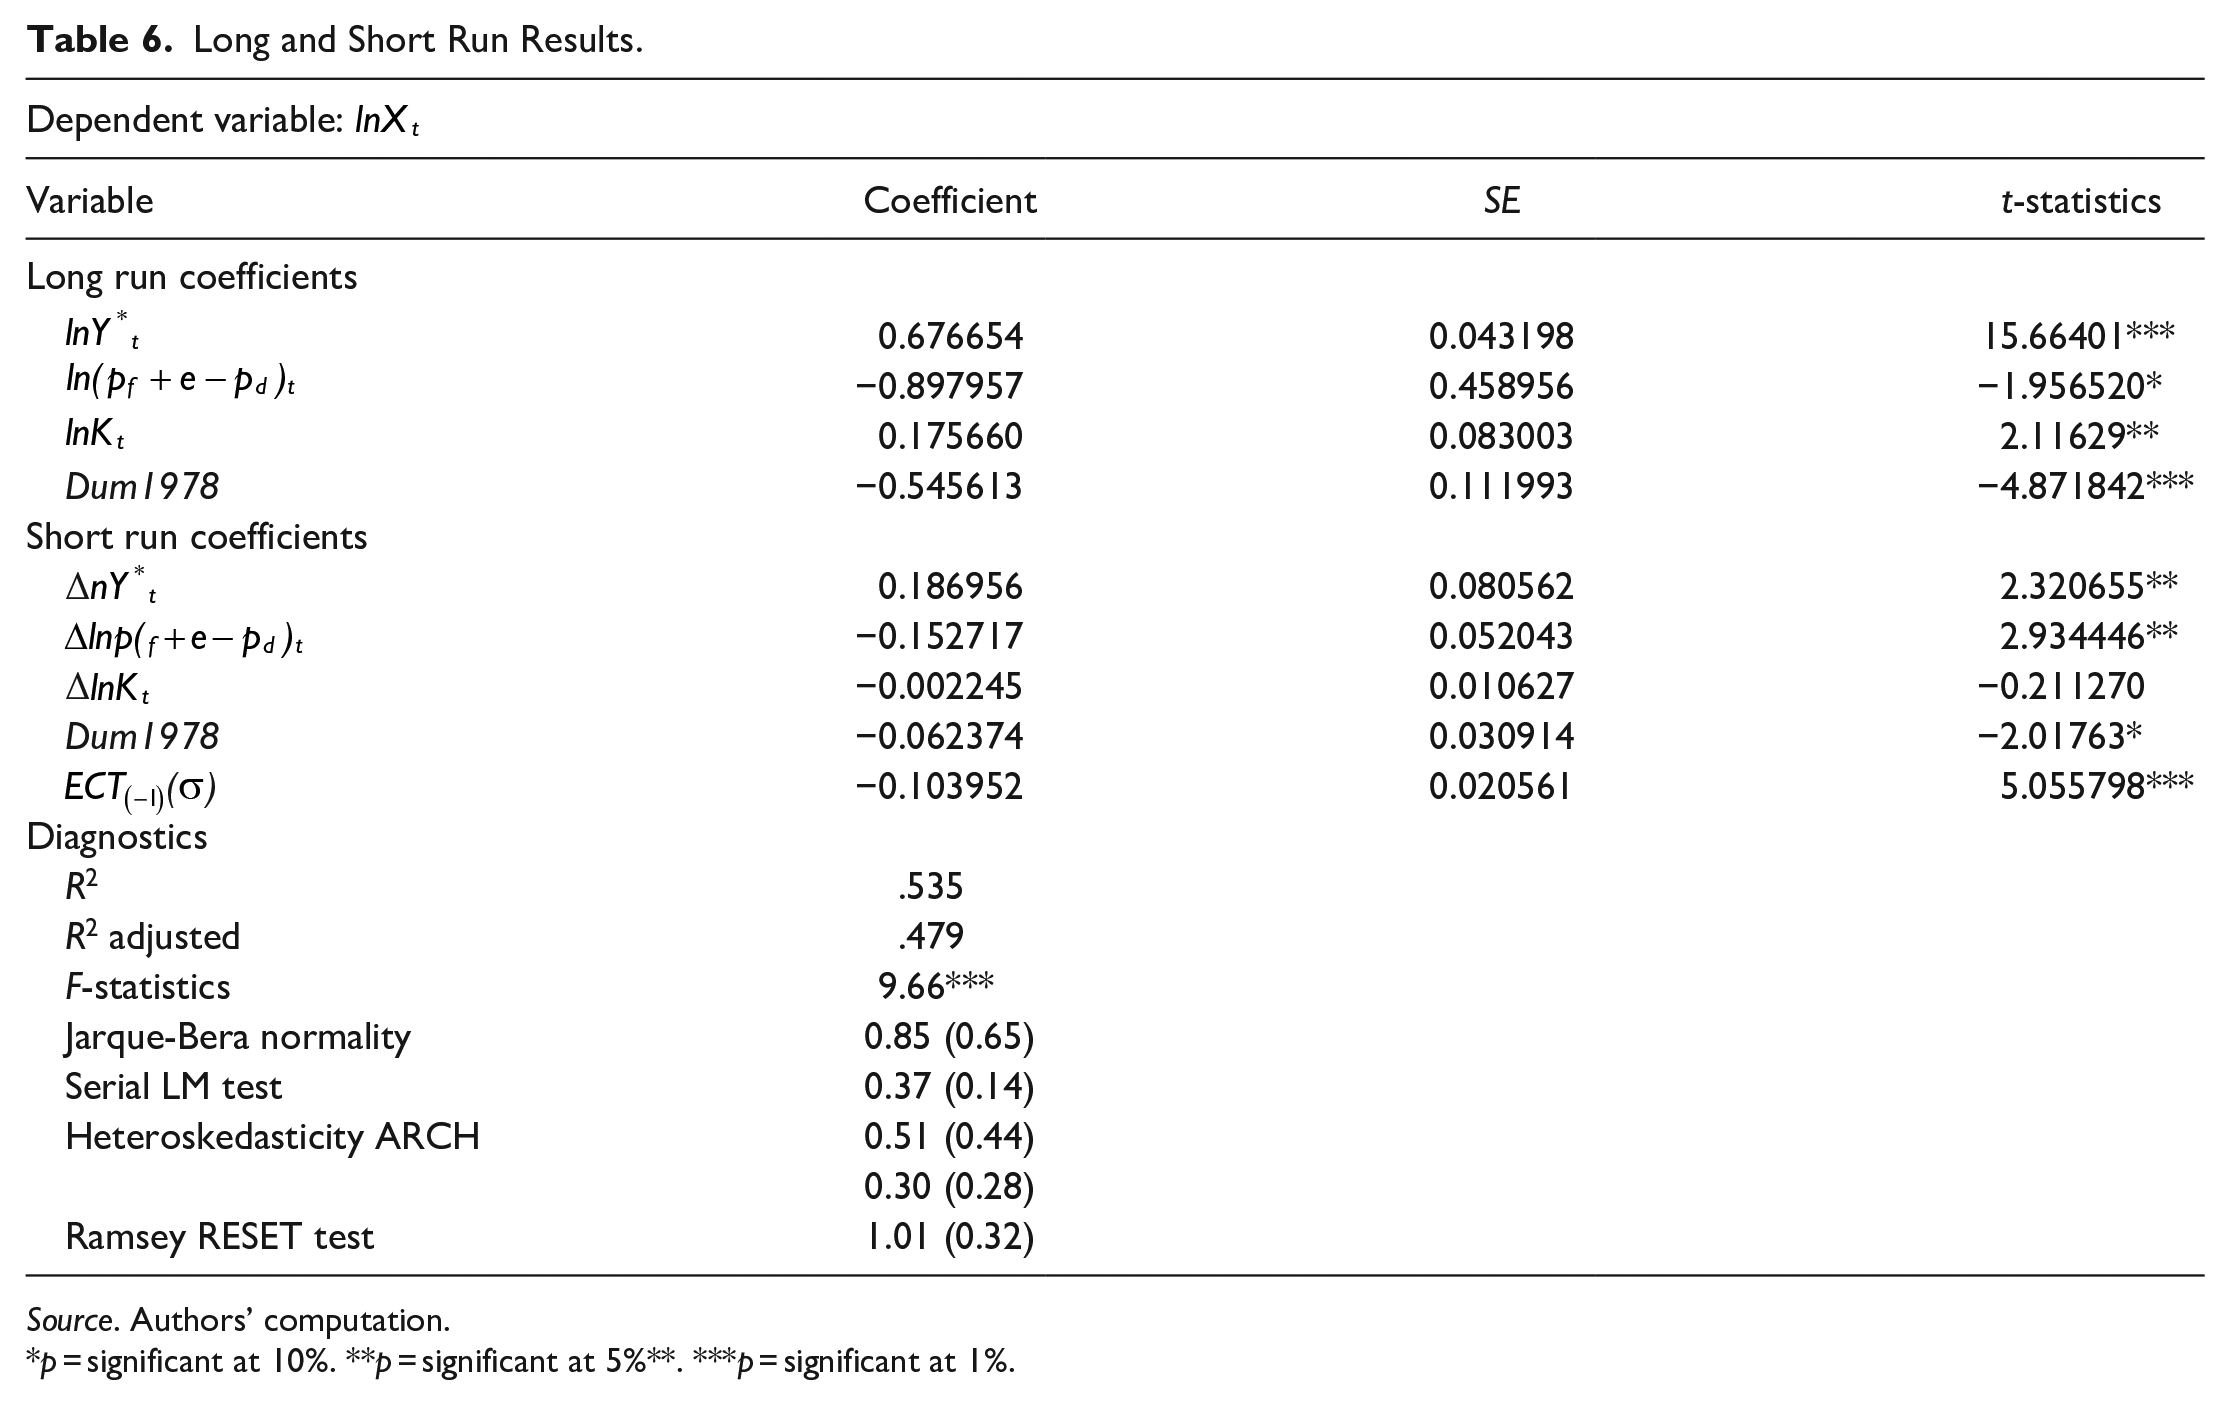
Source. Authors’ computation.
p = significant at 10%. **p = significant at 5%**. ***p = significant at 1%.
We equally examined whether of capital inflows performs some adjustment roles. Capital flows was included in the estimation of the export function only to ascertain its implication and significance given that we found cointegration among them. However, we did not use its elasticity but the growth rate and percentage share of the variable in calculation of equilibrium as required by the extended Thirlwall’s model
This implies that considerable inflow capital has some consequences on the growth process of the UK and could aid in relaxing balance of payment constraints not necessarily influencing BP-equilibrium growth; particularly when debt to export ratio is sustainable and the country’s ability to pay subsists. Hence, 1% increase in capital flows improves export growth by 0.17%. This is particularly true, when the foreign direct investment and positive implication of capital import in the form intermediate imports is considered.
The second component of Table 6 shows the short run coefficients. The coefficients of the regressors are generally significant except for capital flows, which turns out with and unexpected sign. An additional thing to consider is that the estimated coefficients of the variables are smaller relative to their coefficients in the long run. The correctly signed and significant value of the error correction coefficient obtained from ARDL (1, 1, 1, 1, 1, 1) undoubtedly corroborates the presence of long run relationship between the variables. This suggests that any deviation in exports into disequilibrium is immediately adjusted with the speed of 10% yearly.
Moving further, sensitivity examination reveals that all of the short run parameters pass the diagnostic checks including the test for normality; LM test for serial correlation; heteroskedasticity test; autoregressive conditional heteroskedasticity (ARCH) test. The outcome shows that the model residual terms are distributed normally. LM indicates that the errors are not correlated with exports over the time period. There are no evidence of ARCH effects and no heteroskedasticity. Ramsey RESET is carried out to give more elucidation to the outcome of the analysis. The finding of the test presented in Table 6 reveals that no errors of specification exist. This is because the the estimated elasticity on the power of fitted regressand is above all significant levels (0.10, 0.05, and 0.01). In conclusion, the equation estimated in this study is deviod of any specification error or bias.
Moving further, the stability of the parameters are tested by applying the CUSUM and CUSUMSQ, which are shown in Figures 5 and 6, respectively. In making decision, the estimated value ought to fall within a .05 level of significance shown by two straight curves whose functional form is specified in Brown et al. (1975), for long run stability to be established.

Short run cumulative sum (CUSUM) and cumulative sum of squares (CUSUMSQ).

Long run cumulative sum (CUSUM) and cumulative sum of squares (CUSUMSQ).
Eventhough the statistics of the CUSUM testin the short run appropropraitely situated inside the .05 level of significance, CUSUMSQ test barely meets acceptable condition. Therefore, an impulse dummy is included as fixed regressor corresponding to the year—2012 to perfectly enable the stability of our coefficients in the Long run, which could be seen in Figure 5.
Computation of the Equilibrium Growth Rate
Before determining equilibrium growth for the UK economy, the estimation of import function is necessary. Here, ARDL(1, 1, 1) is used:

Here, log of real imports
Given that the required elasticities, shares, and the growth rates are obtained (see Table 7), the study proceeds to estimate the output growth rate consistent with the balanced trade equilibrium condition. Afterwards, the predicted or the equilibrium growth rate is compared with the real growth for the entire period of analysis.
Balance of Payment Growth Rate.

Source. Own computation.
First, attempt is made to compare equilibrium growth obtained using the original model (7 and 8) with the extended versions (9 and 10). Given the equilibrium growth
From the extended version with capital flows equations (9) and (10), the models tend to marginally predict a surplus balance for the UK economy
Conclusion
The present study employs demand led growth model to investigate the variables that determine the growth of the UK over time. This is done by highlighting the relevance of export demand, capital inflows, and real effective exchange rate in growth process. It makes use of ARDL econometric approach to cointegration to examine the importance of the variables from 1970 to 2018. The objectives set out by this study were achieved. First, it was found that balance of payment constrained growth is suitable for the explanation of growth experience of the UK. While, Keynesian mechanism-income plays the dominant adjustment role in restoring equilibrium; relative prices and capital flows seem to be relevant in short term period for the economy. This indicates that balance of payment conditions are significant restrictions on growth process of the economy; because it sets the frontier on demand in which supply could adjust. Regarding the equilibrium growth rates, it was found that the original model comparatively approximate closer to the actual growth of the economy. More interestingly, the inclusion of relative prices and capital flows in the balance of payments constraint tends to influence the levels of output but do not exert any substantial effect on balance of payment equilibrium growth rate of the UK.
The major implications of the study include (i) Expansion of exports could trigger higher rate of growth real GDP. This is essential because it supplies the needed foreign exchange earnings required in financing any import demand related with domestic income growth. Accordingly, policy efforts toward making domestic products more attractive to oversea buyers. (ii) Expansion in global Keynesianism (growth of world income, measured by the GDP of OECD countries) is necessary for the steady state growth of the UK. (iii) As a short run measure, the inflow of capital could help in relaxing BoP contraints.
In the light of the research outcomes, the present paper recommends that the UK ought to focus on policies toward improving external account. At the same time carefully making interest rate attractive to connect the financial sector with the global financial marketplace in order to attract more overseas capital. Hence, there is the need for policy actions as well as institutional adjustments that would guarantee a more superior long run growth of export as well as measures tailored toward raising capital inflow efficiency.
Footnotes
Appendix
Long and Short Run Results of Import Demand Function.

| Dependent variable: |
|||
|---|---|---|---|
| Variable | Coefficient | SE | t-statistics |
| Long run coefficients | |||
| 1.847 | 0.032 | 56.99*** | |
| −0.055 | 0.035 | −1.547 | |
| Dum2009 | −0.026 | 0.013 | −1.981*** |
| Short run coefficients | |||
| ∆ | 1.585 | 0.141 | 11.18*** |
| −0.047 | 0.027 | −1.733* | |
| (Ω) | −0.8583 | 0.070 | −12.16*** |
| Diagnostics | |||
| R2 | .775 | ||
| R2 adjusted | .760 | ||
| F statistics | 50.76*** | ||
| Jarque-Bera normality | 0.57(0.76) | ||
| Serial LM test | 0.57(0.51) | ||
| Heteroskedasticity | 0.17(0.17) | ||
| ARCH | 0.91(0.91) | ||
| Ramsey RESET test | 0.81(0.63) | ||
Source. Own computation.
p = significant at 10%. **p = significant at 5%. *** p = significant at 1%.
Acknowledgements
I hereby declare that this research is new and has not been sent for publication elsewhere
Declaration of Conflicting Interests
The author(s) declared no potential conflicts of interest with respect to the research, authorship, and/or publication of this article.
Funding
The author(s) received no financial support for the research, authorship, and/or publication of this article.