
Abstract
The aim of this study was to develop a scale to measure the attitudes of the university academic and administrative staff and students toward sexual harassment and assault, and examine its psychometric properties. After the development of the item pool and examination of the content validity of the intended items, Exploratory Factor Analysis (EFA) and parallel analysis was conducted and Cronbach’s alpha reliability coefficient was calculated collecting data from 150 participants (54.7% of female and 45.3% of male) for the initial version (comprised of 12 items) of the Attitudes Toward Sexual Harassment and Assault Scale (ATSHAS). In the second phase, Confirmatory Factor Analysis (CFA) was conducted with 354 participants (54% of female and 46% of male) for the revised version (10 items) of the ATSHAS. Additionally, Cronbach’s alpha reliability coefficient was calculated with second sample. After developing the item pool, the completion of the first phase of the study took 5 months, and the second phase took 4 months. The final version of the ATSHAS consisting of nine items demonstrated sufficient psychometric properties for measuring attitudes toward sexual harassment and assault in the university environment.
Introduction
Sexual harassment and assault are the issues that should be discussed openly and honestly because of their prevalence on university campuses. Sexual harassment is defined as any unwanted sexual advance, a request for sexual favors, or other electronic communication or verbal conduct of a sexual nature that creates a hostile or offensive environment while sexual assault is defined as any sexual contact with another person’s body without the person’s consent, including sexual penetration and sexual touching (Cantor et al., 2015). Sexual harassment and assault are the forms of abuse experiences with long and short term effects on the victims. The victims can experience different types sexual harassment including unwanted discussion of personal or sexual matters, crude sexual remarks, unwanted sexual attention. On the other hand, rape, child sexual abuse, unwanted sexual touching, domestic violence, groping are the examples of sexual assault. As for the physical, psychological, behavioral, and cognitive effects of sexual harassment and assault, stomach cramps, insomnia, lowered self-esteem, fear, anger, feeling of helplessness, isolation, irritability, and depression can be named (Equal Opportunities Commission [EOC], 2013; Kaufman et al., 2019; Thurston et al., 2019). One effect of the sexual harassment and assault that is ignored by the above effects is its impact on academic life (Hill & Silva, 2005; Jordan et al., 2014). For example, research by Mengo and Black (2016) found that students of sexual victimization left university more often than the ones suffered from physical or verbal victimizations. A study by Cortina et al. (1998) revealed that women who were subjected to harassment were less likely to return to university than those who were not, even if they were given an opportunity.
When it comes to the incidence of this experience which has traumatic effects on the individual, it is observed that the rates are not very low on university campuses. Women, whether they are students or administrators, are treated differently on campuses and the term popular term “chilly campus climate” underline that women are subjected to sexual harassment and discrimination (Britton, 2017; Rosenthal et al., 2016). In a campus, sexual assault survey conducted with 5,446 female and 1,375 male undergraduates in two major public universities in the Midwest and South United States, 19% of female students reported being sexually harassed and/or sexually assaulted at least once upon entering college (Krebs et al., 2007). According to another survey conducted by the Association of American University with 15,000 college students, 47.7% of respondents stated that they had been sexually harassed at least once since they started college (Cantor et al., 2015). Although sexual harassment mostly occurs toward women, it can also be toward men or non-heterosexual individuals. For example, in her research Paludi (1996) revealed that sexual harassment was often seen in a campus setting, and that 30% of female students are sexually assaulted within 4 years of education, and she also made a classification of the types of harassment. In another study, it was found that 75% of female students and 62% of male students were subjected to harassment, while the majority of male students who said they had been sexually assaulted were non-heterosexual and black students (Rankin & Reason, 2008). However, the experiences and ways women and men perceive sexual harassment and assault are different (Paludi, 1996).
There are also studies on sexual harassment from student to student (Pinchevsky et al., 2020), from teaching staff to student (Whitley & Page, 2015). In a survey conducted with senior students at the faculty of education in Turkey, 78.9% of students stated that they were exposed to one or more of these experiences when asked to mark how often they encountered experiences involving sexual harassment (Durmuş, 2013). DeSouza and Solberg (2003) compiled all the studies on the frequency of sexual harassment and assault experiences of university students in nine countries, including Turkey. The results showed that the frequency of sexual harassment in all countries were quite high. Sexual harassment and assault within the university must not be treated as a problem experienced only by students. In a study on the frequency of sexual harassment and assault by students and faculty members by DeSouza and Fansler (2003), 52.2% of the faculty members surveyed stated that they were sexually assaulted by students at least once.
The number of the universities doing prevention and awareness work on sexual harassment and assault experiences on college campuses increased over the past decade. Many universities publish their policy papers on this issue on their websites. The study by Fusilier and Penrod (2015), on comparing the policy documents on sexual harassment and assault of different universities, however, revealed the differences in the attitudes of the universities.
Although the rates of sexual assault are lower than the rates of sexual harassment, these rates are still high. Research data from Krebs et al. (2007) show that 13.7% of college students became victims of sexual assault at least once since entering college. A survey conducted by Yiğitalp et al. (2007) in Turkey found that 1.2% of female students were raped. When evaluating the rates of sexual harassment and assault, it is necessary to consider that these rates are actually the visible part of the iceberg. Only less than 5% of college student women who were sexually assaulted filed legal complaints (Hatch, 2017). In another study conducted in Turkey, 96% of the respondents stated that they did not react to sexual harassment because they were afraid of being misunderstood by their environment and 92% thought they would be accused despite being victims (Durmuş, 2013). Among the factors that prevent filing legal complaints are the victims’ fear that the police will not take their situation seriously enough, that they will be prosecuted by the police or other judicial systems and/or feeling that they have deserved it (Bachman, 1998; Krebs et al., 2007). Stereotypes and attitudes about sexual harassment and assault prevent victims from reporting it (Sable et al., 2006).
In fact, these concerns of victims are not unwarranted. Unfortunately, stereotypes about sexual violence, victim or bully can affect decision-making even in the judicial process (Temkin & Krahe, 2008). In a UK study, 26% of respondents think that sexy clothing is partly or entirely responsible for the rape of women. A study in Turkey showed that 19% of women and 36% of men think that women’s clothing is effective in sexual harassment (Aydemir, 2019). The prevalence of such thoughts led to the emergence of the concept of rape myth acceptance (RMA). RMA is used for attitudes and beliefs that ignore or deny male sexual violence toward women, which is, despite being false, largely accepted. In RMA, victims are accused, while the stereotypes increase their power (Matusitz, 2012; Temkin & Krahe, 2008).
There is a consistent relationship between these attitudes supporting violence and committing these crimes on both an individual and social level. In other words, people who tolerate sexual violence and assault or who tend to blame the victim are more likely to engage in such behavior (Flood & Pease, 2009). Most of the work on sexual harassment and assault myths have been conducted with college students in the USA. In spite of all the awareness campaigns and legal practices in American universities, attitudes toward sexual harassment and assault still hold true (Temkin & Krahe, 2008). According to an intercultural study on sexual harassment and assault myths in the university settings, Turkey is among the countries where such stereotypes are common (Ward et al., 1992). Also, a study conducted with women academics at two universities in Turkey found that myths about sexual harassment and assault are common, and that risk groups are associated with socioeconomic conditions (Kalaca & Dundar, 2010). It is therefore very important to evaluate attitudes toward sexual harassment and assault in the university setting and to determine the factors that affect these attitudes.
Attitudes toward sexual harassment and assault influence not only the victim’s behavior, but also the reactions of their family members, friends, institutions, professionals or, in other words, viewers (Flood & Pease, 2009). Since the patriarchal perspective puts women in a weak and powerless position, it makes possible all kinds of violence, hence sexual harassment and assault. As long as the language used and attitude taken at the individual or institutional level carry masculine patriarchal codes, rape myth acceptance becomes normalized (Yüksel Kaptanoğlu, 2018). Formal (e.g., family, school) and informal (e.g., peers, media, pop culture, gender roles) socialization forces have a significant effect on shaping attitudes toward sexual harassment and assault (Flood & Pease, 2009).
Kayacı (2014) also states in his study that academics who were subjected to harassment did not feel safe on campus, which caused lower participation rates to the campus life. Victims of abuse and assault often share these experiences with their friends. When faced with a situation of harassment and assault, people tend to react according to their own personal beliefs, understanding of gender relations, and norms for sexual relations. For this reason, the attitudes of the victim can increase the effects of their trauma. In this respect, taking attitudes toward sexual harassment into consideration is crucial as well. Measuring the attitudes of individuals who are quite likely to encounter or witness this social problem validly and reliably is important in planning interventions to prevent this social problem. Rejecting attitudes toward social problems can play a preventive role.
When the literature is reviewed, it is seen that various measurement tools have been developed to determine attitudes toward sexual harassment and assault. Rape Myth Acceptance Scale (Burt, 1980), Sexual Harassment Attitude Scale (Mazer & Percival, 1989), Perceived Causes of the Rape Scale (Cowan & Quinton, 1997), Acceptance of Modern Myths about Sexual Aggression Scale (Gerger et al., 2007) are some of the examples. However, the validity and reliability studies of these measurement tools were conducted only with university students. Studying on sexual harassment and assault in the university environment only through students is less than satisfactory. The attitudes of academic and administrative staff are also very important in both determining the limits of the relationships they establish with students and evaluating legal applications. Therefore, it is believed that a measurement tool, in which validity and reliability studies are conducted with larger groups, is needed.
There are also intercultural differences in the evaluation of sexual harassment and assault. Gender imbalance is one of the predictive factors on negative attitudes toward sexual harassment and assault (Temkin & Krahe, 2008). According to the Global Gender Gap Report (The World Economic Forum [WEF], 2018), Turkey ranks 130 among 149 countries that are benchmarked by their progress in gender equality. There are research findings that Turkish women show more tolerance for sexual harassment due to cultural factors (Luthar & Luthar, 2002). In an intercultural comparison study, it is reported that compared to Anglo American women, Turkish women, who have “white-collar” or “pink-collar” jobs, develop more avoidance and denial behavior and do not seek social support as much after sexual harassment and assault (Wasti & Cortina, 2002). In collectivist cultures such as Turkey, social support seeking is one of the important coping strategies in crisis situations (Triandis et al., 1985). However, the attitudes toward sexual harassment and assault may also be an obstacle in accessing this support. For this reason, it is believed that a culture-specific measurement tool will make an important contribution to the literature. The aim of this study is to develop a scale to measure the attitudes of the academic and administrative staff as well as students toward sexual harassment and assault in universities. To this end, three studies were conducted.
Study 1: Development of the Item Pool and Examination of the Content Validity
The aim of Study 1 is to develop the item pool that will measure attitudes toward sexual harassment and assault and examine their content validity. The procedure recommended by De Vellis (2003) was followed in developing the item pool. For this reason, the item to be measured (attitudes toward sexual harassment and assault) has been clearly defined on the first stage. In the literature, although they overlap with each other, different definitions are given for sexual harassment and assault (McKinney, 1990). In this study, sexual harassment is defined as “unwelcome, disturbing and sexually explicit behaviors, attitudes, verbalization, or other forms of behavior that do not involve body contact and are not consensual” and sexual assault is defined as “violation of someone’s body immunity through behaviors aimed at satisfying non-consensual sexual desires on one’s body.” In the writing of the items, it was taken into account that attitudes consist of two dimensions: cognitive and affective (Reece et al., 2010). The items were written by the authors doing an in-depth literature review and taking the stereotypes against sexual harassment and attacks in Turkey into account at the same time. On the second stage, 21 items written by the authors for the item pool were evaluated by discussing them according to the criteria of functionality of the measured structure, comprehensibility, involvement of a single proposition, and similarity of the items (Hinkin et al., 1997). As a result of this, it was agreed that the item pool should consist of 12 items. On the third stage, the use of 5-point Likert-type scoring (1-strongly agree, 2-agree, 3-undecided, 4-disagree, 5-strongly disagree) as the measurement method was decided upon.
The first of the psychometric properties to be examined in the developed measurement tool is the content validity (Schriesheim et al., 1999), which is the examination of the degree of representation of each item in the measurement tool (Byrne, 2010). In this study, Davis (1992) technique was used for the content validity of ATSHAS. For this, firstly, the scale items were sent to seven experts (1 public health expert, 1 sociologist, 3 psychological counselor, 2 measurement evaluator), and they were asked to evaluate and/or write suggestions (a = “appropriate,” b = “item should be slightly revised,” c = “item should be seriously revised,” d = “not appropriate”) for each item over expert opinion forms. Then, the number of experts who marked a or b in the expert opinion form was divided by the total number of experts, and the content validity index (CVI) was calculated for each item. Accordingly, CVI for 11 of the 12 items was found to be 1, while the CVI for a single item was calculated as 0.85. According to Davis (1992), items whose CVI is below 0.80 should be removed from the scale. As CVI is >0.80 for all items in ATSHAS, all the items were decided to be kept.
Study 2: Construct Validity, Convergent Validity, and Reliability
The aim of Study 2 is to examine the factor structure and internal consistency of ATSHAS.
Method
Participants
A two-stage stratified random sampling technique was used for the selection of participants. Considering academicians/administrative staff/students on the same campus forming a homogeneous group compared with the ones on other campuses forming a heterogeneous group, the first-stage sampling unit was made up of four different campuses of the university. On the other hand, the second-stage sampling unit was constituted from the academicians, administrative staff, and students in the same campus. Since the number of academicians, administrative staff and students on each campus was different, the sample was chosen by proportional sample allocation of campuses using two-stage stratified sampling. The number of academicians/administrative staff/students was drawn from each campus by simple random sampling technique. As a result, 150 participants (32 academicians, 38 administrative staff, and 80 students) in a state university with 22 faculties western part of Turkey participated in the survey. Of academicians, 66% (n = 21) are female and 34% (n = 11) male. Seventy-four percent (n = 28) of administrative staff are female and 26% (n = 10) male. While 41% of students are female (n = 33), 59% (n = 47) of them are male. The academicians are in the 27 to 51 age group (M = 35,97, SD = 7.05), the administrative staffs are in 25 to 60 age group (M = 41.67, SD = 9.21) and students are in 18 to 38 (M = 22.13, SD = 3.34) age group.
Data collection instruments
The purpose of Sexual Assault and Harassment Attitude Scale, ATSHAS, is to evaluate attitudes toward sexual harassment and assault. The scale involves 12 items, 3 of which are reverse-coded ones. Participants rate each item via a 5-point Likert scale (1 = Strongly agree to 5 = Strongly disagree). Higher scores indicate healthy attitudes toward sexual harassment and assault, which is the ultimate goal of the interventions to prevent sexual violence.
Personal Information Form: A demographic questionnaire was included to gather information on participants’ sex and age.
Data collection
After obtaining the ethical permission from the ethics committee of a state university and an application permit from the faculties, the data collection process started. The data from the students were collected in the classroom, and the data from the academicians and administrative staff were collected in their office. Informed consent was obtained from the participants by giving general information about the purpose of the research before the data were collected. The participants were informed that the data obtained would be kept confidential during the research and publishing process. Data collection took approximately 10 to 15 minutes.
Data analysis
Exploratory factor analysis was used to assess the construct validity of the scale. Principle axis extraction method which provides opportunity to figure out the latent factors or constructs that explain shared variance among items when data set is non-normality (Costello & Osborne, 2005), was chosen as an extraction method in EFA. The suitability of the data for EFA with the Kaiser-Myer-Olkin (KMO) measure of sampling adequacy and the Bartlett test of sphericity was examined. These criteria are considered in determining a preliminary factor structure: (a) retaining factor loadings over 0.40, (b) retaining all factors whose computed eigenvalue is greater than 1 (Tabachnick & Fidell, 2007). Also, parallel analysis was used for determining the number of factors to retain in EFA (Matsunaga, 2010).
For discriminant validity, upper and lower distinct group based t-tests were conducted and the mean difference between the upper 27% and the lower 27% was calculated. Internal consistency reliability was assessed using Cronbach’s alpha coefficient and corrected total-item correlations.
SPSS 23 statistical software package has been executed for Exploratory Factor Analysis, Cronbach’s alpha, and item analysis, then Monte Carlo PCA for Parallel Analysis is performed by Parallel Analysis software developed by Watkins (2008). In data analysis, significance level is considered as p < .05.
Results
Construct Validity
Kaiser-Mayer-Olkin (KMO) measure of sampling adequacy and Bartlett’s test of sphericity were performed to test the suitability of the data set for factor analysis before conducting exploratory factor analysis for the construct validity of ATSHAS. KMO criterion of 0.86 indicated that suitable common variance for factor extraction, and Bartlett test of Sphericity indicated that the intercorrelation matrix was appropriate for analysis, χ2(66) = 589.16; p < .00). KMO criterion is higher than 0.80 and a p-value for Bartlett’s χ2 is less than .001, so, these findings indicate that the data are appropriate for EFA (Field, 2009; Tabachnick & Fidell, 2007).
According to the results of EFA, the factor loadings of 12 items ranged between 0.19 and 0.83 and the total variance explained by the single factor was 33.96%. As the items (“The individual’s dressing style does not justify sexual harassment/assault” and “There is nothing to require the embarrassment of victims of sexual harassment/assault”) had factor loadings <0.4, they were excluded (Costello & Osborne, 2005), and EFA was repeated.
As a result of EFA, it was determined that factor loads in component matrix ranged between 0.50 and 0.84 and the total variance explained was 38.88%. The Scree plot in Figure 1 shows that the slope of curve is leveling off after the first factor.

Scree plot graphic.
In order to make a definitive decision on the number of factors, parallel analysis technique was used with the software developed by Watkins (2008). In parallel analysis, each eigenvalue (which represents the size of the factor) is compared against an eigenvalue for the corresponding factor in many randomly generated data sets that have the same characteristics as the data being analyzed (Field, 2009). One thousand random data sets were produced, each with 10 variables and 150 participants for each PCA. The eigenvalue determined by EFA (4.46) is higher than the eigenvalue determined by parallel analysis (1.42). Since the eigenvalue determined at the end of the EFA should be greater than the eigenvalue obtained from the data set randomly generated by parallel analysis (Matsunaga, 2010), the single-factor structure was confirmed.
Discriminant Validity
t test for independent groups was conducted for the 27% upper and lower group’s mean scores. The mean difference between upper and lower group’s CTSTS mean scores was significant t(78) = 8.11, p < .05. When the means were examined, lower group’s mean score was found as 41.55 (SD = 6.59) and upper group’s as 50.00 (SD = 0.00). These results show that ATSHAS has discriminant validity.
Internal Consistency Reliability
Cronbach’s alpha reliability coefficient for ATSHAS with 10 items was calculated as .85. Corrected item total score correlations for ATSHAS ranged from .52 to .76. Since the Cronbach’s alpha reliability coefficient is over .70 and the item total score correlations are over .30, which means ATSHAS meets the reliability criteria (Tabachnick & Fidell, 2007).
Study 3: Confirmatory Factor Analysis and Internal Consistency Reliability
In the scale development studies, it was suggested that the factor structure determined by EFA be tested by confirmatory factor analysis (CFA) with a distinct sample (Cabrera-Nguyen, 2010). Hence, the aims of Study 3 were; (1) to confirm the factor structure identified in Study 2; (2) to evaluate the reliability of the ATSHAS in another sample.
Method
Participants
In determining the participants, the same way used in determining Sample 1 was followed in study. Sample 2 consists of 354 participants (74 academicians, 91 administrative staff, and 189 students) in a state university western part of Turkey. 54.1% of the academic staff is female (n = 40), 45.9% (n = 34) is male; 70.3% of the administrative staff are female (n = 64), 29.7% (n = 27) are male; 46% of students are female (n = 87) and 54% (n = 102) are male. The age range of academic staff is between 26 and 62 (M = 40.63, SD = 8.44), the age range of administrative staff is between 24 and 62 (M = 41.22, SD = 8.53), and the age range of students is 18 to 45 (M = 23.15, SD = 5.00).
Data collection instruments
In this study, ATSHAS and Personal Information Form explained in Study 2 were used.
Data collection
The same method in Study 2 was used to collect the data.
Data analysis
Confirmatory factor analysis (CFA), based on the covariance matrix and used for maximum likelihood estimation, was performed to confirm the hypothesized factor structure that were identified through EFA. In the evaluation of the adjustment indexes relating the model, Absolute fit indices (The ratio χ2 statistical test/degrees of freedom [χ2/df], Goodness fit index [GFI], Standardized Root Mean Square Residual [SRMR], Root mean square error of approximation [RMSEA]), Relative fit indices (Comparative Fit Index [CFI], Tucker-Lewis Index [TLI]), and Parsimonious fit index (Adjusted goodness fit index [AGFI]) were used (Brown, 2006; Kline, 2011; Meyers et al., 2012).
In the research, convergent validity was also examined within the scope of construct validity. Convergence validity examines the level of shared variance between implicit structures in the model (Hair et al., 2014).
For reliability analysis, on the other hand, Cronbach alpha reliability coefficient, inter-item correlation, and item-total correlation were calculated. The analysis of the data was carried out using SPSS 23 and AMOS 24 packages. In data analysis, significance level was considered as p < .05.
Results
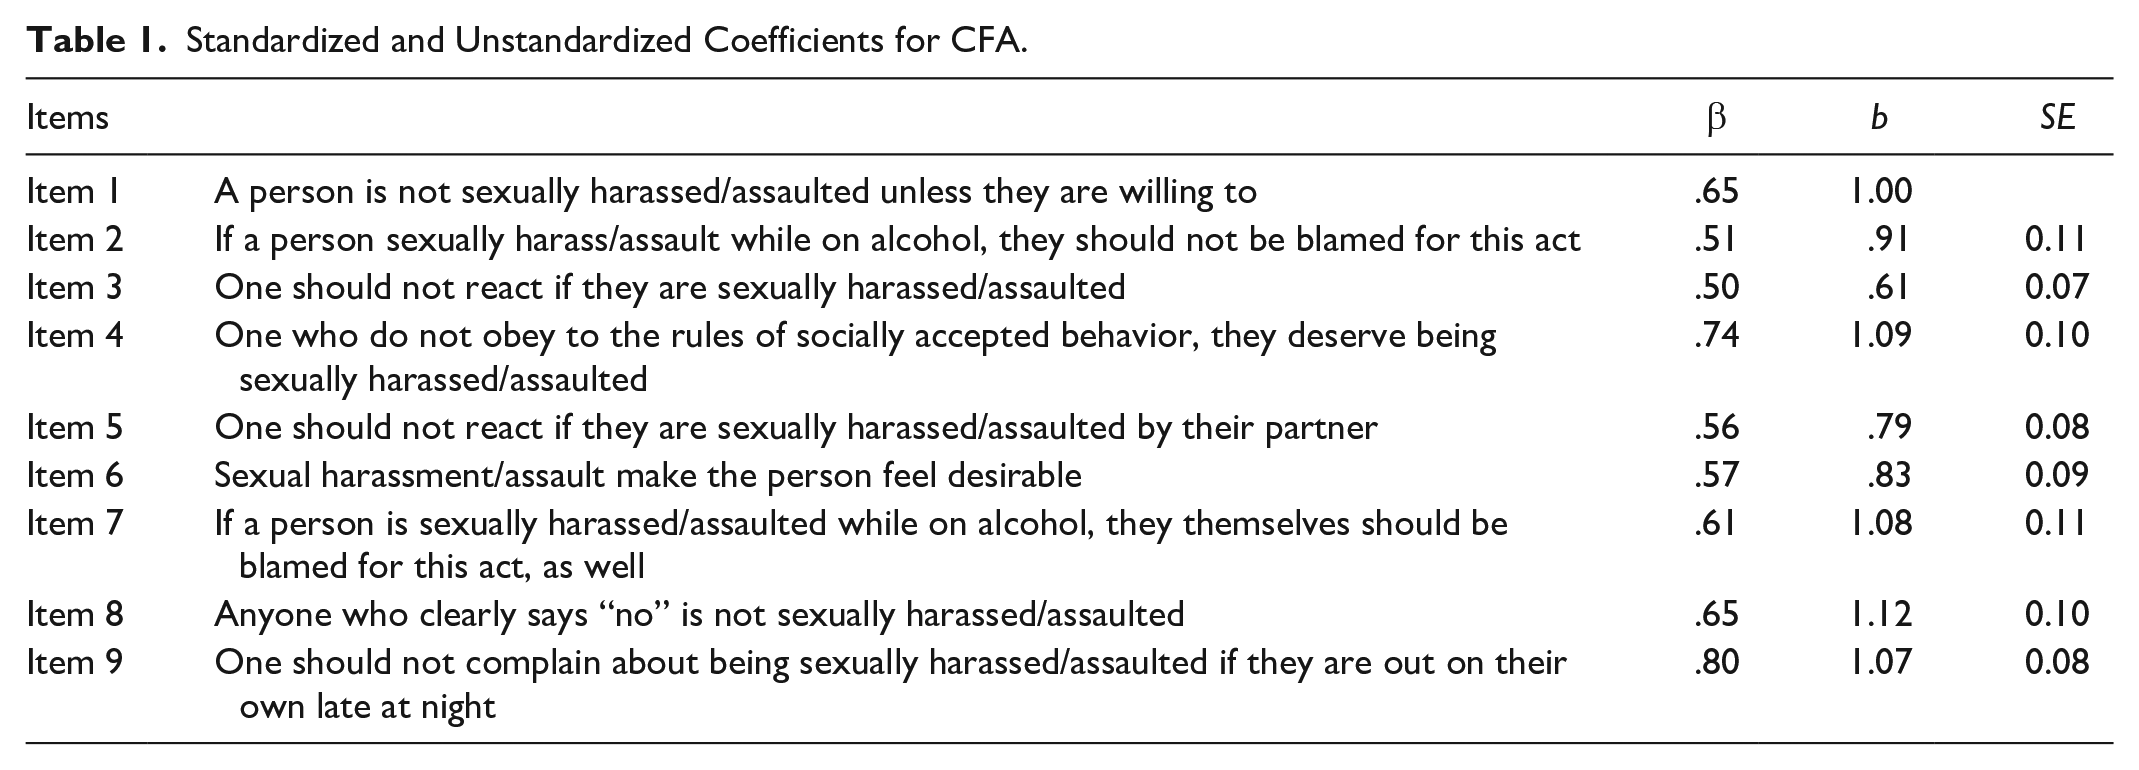
As a result of Study 1, which involved the application of CFA to ATSHAS containing 10 items, fit indices was found as follows: χ2 = 134.46, df = 34, χ2/df = 3.84, GFI = 0.93, SRMR = 0.05, RMSEA = 0.09, AGFI = 0.89, CFI = 0.91, TLI = 0.88. Cut-off values used for model fit evaluation were: χ2/df < 3, GFI ≥ 0.90, SRMR ≤ 0.05, RMSEA ≤ 0.08, AGFI ≥ 0.90, CFI ≥ 0.90, TLI ≥ 0.95 (Brown, 2006; Kline, 2011; Meyers et al., 2012; Schreiber et al., 2006). It was determined that the standardized factor loads of the items ranged between 0.37 and 0.73. CFA was re-performed since the fit indices other than GFI, SRMR, and CFI were not good enough, the factor load for an item (item 1) was low, and the model showed that the model would improve if the modification index was deleted. The fit indices obtained from the second CFA indicated perfect fit (Brown, 2006; Kline, 2011; Meyers et al., 2012; Schreiber et al., 2006) χ2 = 66.96, df = 26, χ2/df = 2.57, GFI = 0.96, SRMR = 0.04, RMSEA = 0.06, AGFI = 0.93, CFI = 0.96, TLI = 0.95. Table 1 contains standardized and unstandardized factor loads and standard errors.
Standardized and Unstandardized Coefficients for CFA.
Convergent validity was also examined as part of construct validity in this study. Composite reliability (CR) value was calculated as .97 and average variance extracted (AVE) 0.51. Since CR value is higher than .60 and AVE value is higher than 0.50, and CR > AVE, it might be concluded the model has convergent validity (Bagozzi & Yi, 2012; Byrne, 2010).
Internal Consistency
Cronbach’s alpha reliability coefficient of ATSHAS consisting of nine items was found as α = .85. Inter item correlations range between .26 and .61, while item total score correlations range between .51 and .70 (Table 2).
Descriptive Statistics, Internal Consistency, and Item Total Correlations for the Scale.

Discussion
The aim of this study is to develop a tool of measurement to evaluate the attitudes of academicians, administrative staff and students to sexual abuse, and assault and investigate its psychometric characteristics. Following the formation of the item pool and testing the content validity from two sample groups, the data were collected and the psychometric characteristics of ATSHAS were examined. Conducting EFA with the data derived from the first sample group, a single-factor structure has been acquired. In determining the factor number as a result of EFA, Eigen values over 1 (Hair et al., 2006) was accepted and the Scree Plot (Cattell, 1966) was examined. Although the strategy of holding the value of factors greater than 1 is often used to determine the factor structure, this method is not the most optimal strategy in defining the correct factor structure (Matsunaga, 2010). The reason for this is the fact that the number of implicit factors is overestimated (Hayton et al., 2004). Therefore, the single-factor structure was also supported by the results of parallel analysis (Zwick & Velicer, 1982). CFA was conducted to the data derived from the second sample group, as well and the single-factor structure was verified; however, one item with insufficient factor load was removed from the analysis on this stage.
To test the reliability of the ATSHAS, internal consistency, inter-item, and item–total correlation values were computed. The results obtained from this sample showed that the ATSHAS demonstrates good reliability (George & Mallery, 2003). Carrying out related studies is not sufficient for cutting down on the number of the sexual abuse and assault cases on university campuses (Hennelly et al., 2019). On the contrary, such studies might create boomerang effect and lead the abuser to engage in more aggressive behavior (Malamuth et al., 2018). Therefore, with a holistic approach involving the audience also, while abating the tolerance to sexual abuse and assault, increasing the level of the readiness to help, responsibility, and empathy of the audience is proven to be more effective in preventing these acts (Fenton & Mott, 2018; Foubert et al., 2010). Among the strengths of this study can be argued that the validity and the reliability of the measurement tool was verified not only with the students but also the academic and administrative staff.
The selection of the participants from different campuses is another strength of the study. In addition, constructing a short and easy-to-use tool of measurement can be cited among its strengths. However, besides its strengths, the study also has some limitations. One of the limitations is that test-retest reliability has not been examined. Another limitation of the study is that the measurement invariance has not been investigated. The studies in the related field indicate that the attitudes of men and women to sexual abuse and assault are different (Schwartz & DeKeseredy, 1997). The data’s being collected from only one university might be among the limitations of the present study. However, because the university where the study carried out has students from different parts of the country, quite a few faculties and technical schools with great number students, and the sample groups were randomly chosen, this particular limitation is believed to be significantly minimized.
Implications and Future Research Directions
The measurement tool developed in this study can be used for awareness studies on sexual harassment and assault. In the National Action Plan on Combating Violence Against Women, whose preparation and implementation is coordinated by the Directorate General of the Status of Women, affiliated with the Turkish Ministry of Labor, Social Services and Family, it is required to conduct studies on men to raise their awareness and transform their mentality (Minister of Family, Labour and Social Services, 2016). The fact that attitudes can be measured separately in line with the gender variable before these studies to be carried out by the institutions is one of the strengths of ATSHAS that will increase its implementation areas. Besides, since lower scores according to the measurement tool indicate negative attitudes, studies on the factors which determine higher or lower ratio of sexual harassment/assault might be carried out. It is thought that the developed attitude scale can be used in sexual harassment and assault prevention/intervention studies aiming at developing rejecting attitudes to determine the target individual/groups and to assess the effectiveness of them. It is also believed that this scale can be used to examine the effect of different variables (gender, sexual orientation, educational background of the parents, participating in gender equality programs or not, etc.) on attitudes toward sexual harassment and assault. In the above mentioned National Action Plan, the sections on “awareness-raising and mentality transformation” and “protective and preventive service delivery” demand carrying out studies to determine the attitudes toward sexual harassment and assault and related research (Minister of Family, Labour and Social Services, 2016). The implementation of ATSHAS can be recommended to achieve these objectives. Besides, the fact that the scale was developed in a sample that includes students, academic, and administrative staff enables a reliable evaluation of the differences in the attitudes of individuals in these groups. In future studies, it can be examined whether there are differences in the attitudes of students, academic, and administrative staff toward sexual harassment and assault.
It is quite possible that the individuals who do not see sexual harassment and assault as a bad act learn this conceptual and intellectual attitude from their parents or friends, elders, or role models in the environment in which they were raised. In order to prevent these attitudes to transform into behaviors and/or acts, programs to change these attitudes are needed (Sözer & Clevenger, 2010). Therefore, this scale can be used to evaluate the effectiveness of such programs. When the relevant literature is examined, it is seen that most of the scales measuring attitudes or myths toward sexual harassment and assault were developed in countries with dominant western culture. This scale, on the other hand, was developed in Turkey, a country that has a more collectivist culture. Thus, it is believed that the scale can be adapted for use in countries with similar cultural characteristics.
The majority of the studies on sexual harassment and assault are conducted on victims, and the number of such studies is limited (Pina et al., 2009). Therefore, ATSHAS can also be used to determine the attitudes of abusers and non-abusers.
Conclusion
As far as researched, ATSHAS is the first measurement tool in Turkey developed in a sample with university academic and administrative staff as well as students. Findings obtained from this study indicate that despite some limitations, ATSHAS is a short, valid, and reliable measurement tool that can be used to measure attitudes toward sexual harassment and assault. As a result, considering the ease of application and scoring, it is believed that the scale will meet the needs of mental health professionals working at universities, and researchers from the field of education and psychology.
Footnotes
Declaration of Conflicting Interests
The author(s) declared no potential conflicts of interest with respect to the research, authorship, and/or publication of this article.
Funding
The author(s) disclosed receipt of the following financial support for the research, authorship, and/or publication of this article: This study was part of the project entitled “DEVELOPMENT OF PRIMARY PREVENTION STRATEGIES AGAINST SEXUAL HARASSMENT AND ASSAULT” which supported by Dokuz Eylul University Department of Scientific Research Projects [grant number 2017.KB.EGT.004].
Informed Consent
Informed consent was obtained from all individual participants included in the study.
Ethics Statement
The Ethics Committee of Institute of Educational Sciences at Dokuz Eylul University approved the study.