
Abstract
As natural disasters cause significant damage, many countries have developed disaster mitigation plans to reduce losses. Because China has frequent natural disasters in its geographically diverse territory, over the past few decades, the Chinese government has promulgated regulations and developed plans to mitigate the loss of life and property in natural disasters. To analyze the natural disaster mitigation efficiency in 27 Chinese provinces, this article employed a modified Epsilon-Based Measure (EBM) Data Envelopment Analysis (DEA) model. It was found that while Sichuan, Guangdong, Hebei, Shandong, and Chongqing had good efficiencies, there were significant variances across the provinces, and, in general, significant improvements were needed. Previous natural disaster efficiency research has examined disaster management and performance evaluations, employed static DEA models, and tended to ignore the radial and non-radial characteristics. Therefore, this article is the first comprehensive examination of recent natural disaster mitigation efficiencies in Chinese provinces.
Introduction
China is a large territory with complex landforms. In particular, Southwest China, which is located on the junction of the Indian and Eurasian tectonic plates, has suffered from many natural disasters, which have resulted in a significant loss of life and property (National Development and Reform Commission, 2016). Even though there have been major investments and regulatory promulgations, such as the Regulations on the Prevention and Control of Geological Disasters, Decisions of the State Council on Strengthening the Prevention and Control of Geological Disasters, the 13th Five-Year Plan for the Prevention and Control of Geological Disasters in the Country, and the National Plan for Land Subsidence Mitigation and Control, China’s natural disaster mitigation and control capabilities remain weak.
Whereas the effects of disaster mitigation policies are generally uncertain because of the random nature of natural disasters, three main natural disaster governance problems have been identified in China: (a) no comprehensive analysis has been conducted to identify the natural disaster–influencing factors, the uncertainties, or the possible expected losses; (b) the disaster mitigation/prevention mechanisms are insufficient; and (c) because of the lack of effective disaster management mechanisms and systems, disaster mitigation/prevention expenditure is high but the benefits are low.
Therefore, to mitigate the natural disaster damage on life, property, the economy, and the society, it is necessary to comprehensively evaluate the economic benefits of the current mitigation and control projects to determine the possible economic losses and determine appropriate funding levels, assess natural disaster mitigation and control project efficiencies, and make decisions on and improve the effectiveness of future government natural disaster mitigation and construction project interventions.
There has been significant research focused on the impact of natural disasters on economic growth, corporate finance, and risk (Albala-Bertrand, 1993; Benali et al., 2018; Carrera et al., 2015; Freire-González et al., 2017; Keerthiratne & Tol, 2018; Klomp, 2014; Klomp & Hoogezand, 2018; Kousky, 2014; Marto et al., 2018; Noth & Rehbein, 2019; Noy, 2009; Oliva & Lazzeretti, 2018; Songwathana, 2018), on natural disaster risk assessments and resilience (Brown et al., 2018; Chen et al., 2018; Erdik et al., 2011; Fang et al., 2018; Ilo et al., 2018; Khazai et al., 2018; Kusumastuti et al., 2014; Liu, 2008; Oliva & Lazzeretti, 2018; Rakib et al., 2019; Wijegunarathna et al., 2018; Wu & Chiang, 2008), and on disaster mitigation and governance efficiency factor analyses (Kawamoto & Kim, 2019; Park et al., 2018; Ren, 2016; Sun & Yang, 2017).
However, there have been more studies on the economic impact of natural disasters and risk assessments, with significantly fewer studies having focused on disaster mitigation and treatment efficiencies. The studies that examined these efficiencies tended to use Data Envelopment Analysis (DEA) radial methods (Charnes-Cooper-Rhodes [CCR] or the Banker-Charnes-Cooper [BCC]), non-radial (Slacks-Based Measure [SBM]) methods, or Directional Distance Function (DDF) models, which either ignored or did not fully consider the radial and non-radial characteristics.
However, as current methods are unable to accurately evaluate natural disaster prevention and management efficiencies, it has not been possible to identify the primary governance problems in China’s provinces. Therefore, to fully address these concerns, this article proposes a modified Epsilon-Based Measure (EBM) DEA model to explore the natural disaster mitigation efficiencies in 27 Chinese provinces from 2011 to 2016.
The main contributions of this article are to comprehensively assess and compare the effectiveness of China’s provincial natural disaster management programs using an EBM DEA model to overcome the radial and non-radial DEA issues in previous studies, in which the disaster mitigation expenditure is the input, and the number of mitigation and control projects, the number of disasters, and the direct economic losses are the outputs.
The remainder of this article is organized as follows. The next section provides the background through a literature review; the section “Model Development” details the research method. The “Empirical Results” section discusses the empirical results, followed by the conclusion of the article, which provides policy directions.
Literature Review
There have been three main natural disaster research directions, each of which is discussed in the following subsections: the impact of natural disasters on economic growth, corporate finance, and risk; natural disaster risk assessments and countermeasures; and disaster mitigation and governance efficiency factor analyses.
Impact of Natural Disasters on Economic Growth, Corporate Finance, and Risk
Disaster and economic loss have been widely discussed in relevant research. For example, Albala-Bertran (1993) used two-decade microeconomic empirical data from Peru, Nicaragua, Honduras, Guatemala, Ecuador, and the Dominican Republic to study the relationships between natural disasters and output growth, finding that natural disasters had a negative effect on the domestic economic growth rate. Noy (2009) used panel data analysis to compare the impact of natural disasters in developed and developing countries from 1970 to 2003 and found that natural disasters had less adverse domestic production impacts in countries with higher domestic credit levels but lower capital account openness, and had a greater impact on developing country output than developed countries because the higher literacy rates, better institutions, higher per capita incomes, higher trade openness, and higher government spending in developed countries better resisted the socioeconomic effects of the disasters. Klomp (2014) used 1997–2010 data from more than 160 countries to explore the impact of large-scale natural disasters on commercial bank defaults. Klomp found that natural disasters caused commercial defaults that stressed and threatened bank solvency. In other studies, Kousky (2014) reviewed research that assessed direct natural disaster damage, indirect natural disaster damage, natural disaster economic impacts, and natural disaster measurement problems and provided information on possible future climate damage models and policies. Carrera et al. (2015) used the computable general equilibrium (CGE) global model to research the impact of floods on the North Italian economy and found that flood events resulted in greater indirect losses than direct losses. Freire-González et al. (2017) examined the economic impacts of drought and gave suggestions for drought-related economic loss estimations.
Oliva and Lazzeretti (2018) estimated the negative effects of earthquakes on the Japanese regional economy from 1970 to 2000 and found that they significantly impacted regional employment. Marto et al. (2018) used dynamic small open economy models to assess natural disaster damage, finding that the rebuilding costs and debt brought problems to the economy and that a good policy could reduce disaster losses. Noth and Rehbein (2019) investigated German company performances after the 2013 floods and found that turnover, leverage, and cash on hand increased in the disaster regions. Benali et al. (2018) studied the relationships between natural disasters, budget deficits, public debt, and economic growth in nine middle-income countries (Argentina, Colombia, Morocco, Malaysia, Mexico, Peru, Philippines, Thailand, and Tunisia) from 2000 to 2014 and found that there was a one-way causal relationship between natural disaster measures and budget deficits and a two-way causal relationship between public debt and budget deficits. Songwathana (2018) used cross-country data from 168 countries from 1990 to 2016 to explore the relationships between natural disasters and economic development in developing and developed countries, finding that higher incomes and larger urban populations might suffer more from greater natural disaster damage. Keerthiratne and Tol (2018) explored the relationships between natural disasters and income inequality in Sri Lanka, finding that natural disasters reduced the inequalities in non-seasonal agricultural and non-agricultural incomes, but increased the inequalities in seasonal agricultural income. Klomp and Hoogezand (2018) used data from 76 countries to explore the impact of natural disasters on agricultural protection and found that natural disasters usually promoted agricultural trade controls and benefited domestic farmers.
Natural Disaster Risk Assessment and Resilience
Natural disaster risk assessment and disaster resilience have been widely examined in disaster research. Wu and Chiang (2008) established a “Natural Disaster Statistics Index System” (NDSIS) as an important reference for central and local governments to strengthen future disaster management, with the research design becoming the main statistical indicator for Taiwanese disaster loss and management. Erdik et al. (2011) analyzed earthquake reaction systems—Taiwan’s earthquake rapid reporting system, Yokohama’s real-time seismic assessment disaster system, the Tokyo Gas Company’s instant earthquake mitigation system, and Istanbul’s earthquake rapid response system—and found that after a catastrophic earthquake, timely actions were able to reduce the earthquake impact on cities, critical facilities, and infrastructure. Brown et al. (2018) studied the impact of Cyclone Evan on Fijian families and the expected natural disaster impact in the subsequent 20 years, finding that the impact of extreme events could significantly change risk perceptions. Rakibac et al. (2019) investigated coastal climate change vulnerabilities in Southwest Bangladesh, finding that flash flood areas were the most vulnerable, followed by saltwater, drought, and flood areas and that local residents had inadequate competences to deal with disaster risk. Rakibac et al. recommended that public spending be increased on sanitation, drinking water, and rural infrastructure especially in disaster-prone areas that had high poverty rates. Kusumastuti et al. (2014) assessed Indonesia’s resilience to natural disasters, such as earthquakes, tsunamis, and volcano eruptions, finding that while two of the observed provinces were resilient, further measures were needed to improve regional adaptability. Liu (2008) used geological features, engineering geological rock formations, fault structures, vegetation cover indices, disaster point densities, river systems, road impact distances, and average annual rainfall to assess the risk of geological disasters. Chen et al. (2018) proposed an integrated assessment method for regional disaster assessments in China using an Analytic Hierarchy Process (AHP), Self-Organizing Mapping (SOM), Isometric Mapping (Isomap), and Ideal Solutions (Technique for Order Preference by Similarity to Ideal Solution; TOPSIS), which offered a new comprehensive assessment method for policy makers.
Some studies have focused more on the human element of disasters. For example, Fang et al. (2018) used structural dynamics to describe the livelihood adaptability as measured by livelihood quality, livelihood promotion, livelihood provision, and disaster stress of rural residents in Sichuan, and found that the rural resident livelihood adaptability had a significant positive correlation with livelihood quality, livelihood promotion, and livelihood supply, but was significantly negatively correlated with disaster stress. They also found that the impact of different natural disasters on livelihood resilience varied, with the livelihood recovery rates from earthquakes, floods, and droughts, respectively, being −0.5%, −0.3%, and −0.1%. According to Fang et al., encouraging incentives, motivating health care professionals to stay in rural areas, increasing the scale of operations in the education and health sectors, promoting equitable access to farmland, and promoting the economic viability of local farms were all important components for livelihood recovery. Ilo et al. (2018) used a t test to assess the disaster equipment availability in university libraries in Southwest Nigeria and found there was a lack of dehumidifiers, dryers, dust collectors, plastic covers, and warning alarms.
To measure and monitor city resilience, Khazai et al. (2018) developed a multilevel, multiscale, flexible, self-assessment tool, the Resilience Performance Scorecard (RPS), to assist stakeholders in evaluating elastic parameters based on primary source information to reflect the goals and objectives of local participants, which was then implemented by the Lalitpur local government before and after the 2015 Nepal Earthquake. Oliva and Lazzeretti (2018) developed a resistance and recovery index for Japanese regions affected by earthquakes that was able to estimate regional disaster-affected employment, which expanded the discussion on regional economic natural disaster resilience. Wijegunarathna et al. (2018) compared the long-term satisfaction with housing reconstruction in resettled communities and found that the resettled community was generally satisfied in the long run, and that house renovations, expansion, and layout, as well as the number of rooms, lighting, and ventilation, were important factors for long-term post-disaster planning and design.
Factor Analyses for Disaster Mitigation and Governance Efficiency
The third main area of research has been on efficiency evaluations, with the most-used method being DEA. For example, Ren (2016) collected input and output data on agricultural droughts and flood mitigation from 18 areas in Henan and applied a non-radial super-efficiency DEA model and Malmquist index, finding that there had been insufficient investment in drought mitigation and agricultural drought control. Sun and Yang (2017) assessed geological disaster vulnerabilities using a DEA cross model and cluster analysis, and found that vulnerability was significantly impacted by economic, scientific, and technological development. Kawamoto and Kim (2019) examined the effect of different types of social capital (SC) on waste management efficiency after major disasters in Japan, finding that as a community entered a long-term post-disaster reconstruction phase, SC most contributed most to waste management efficiency.
However, few studies have examined disaster mitigation and treatment efficiencies as a whole, and any discussions on efficiency have been based mainly on radial methods (Sun & Yang, 2017; Park et al., 2018) or non-radial methods (Kawamoto & Kim, 2019; Ren, 2016). As radial models ignore non-radial slacks when evaluating efficiencies and non-radial models ignore radial characteristics, this article developed a modified EBM DEA model to analyze China’s provincial disaster mitigation efficiencies.
Model Development
Model and Method
Charnes et al. (1978) proposed the CCR DEA model under the assumption of constant returns to scale, after which Banker et al. (1984) extended the returns to scale assumptions and proposed the BCC model. However, as both the CCR and BCC models ignored non-radial slacks, Tone (2001) proposed a Slacks-Based Measure (SBM) in 2001, which ignored the same proportion of radial characteristics. Consequently, Tone and Tsutsui (2010) proposed an EBM DEA model to resolve the efficiency overestimation and underestimation problems associated with the radial and non-radial models, which has since been employed by Tavana et al. (2013), Yang et al. (2018), and Y. Li et al. (2020) to explore Chinese industry efficiencies. The advantage of the EBM model is that it considers both the radial proportion between the target and actual values of the production input and incorporates the non-radial slacks, making the efficiency evaluation more accurate.
Non-oriented EBM
Tone and Tsutsui’s (2010) EBM DEA model is as follows:
There are
The Decision-Making Unit (DMU) efficiency is, therefore,


where Y: DMU output,
X: DMU input,
For


Modified undesirable EBM DEA model
Tone and Tsutsui’s (2010) EBM had no restrictions on the range for θ, η variables, and did not consider undesirable factors. Therefore, to avoid any under- or overestimations of the efficiencies and accurately reveal the need for disaster mitigation efficiency improvements, this article combined the modified EBM DEA and undesirable factors to assess the natural disaster mitigation efficiencies in 27 mainland Chinese provinces.
There are


where Y: DMU output,
X: DMU input,
For


Input and Output Efficiency
Hu and Wang’s (2006) total-factor energy efficiency index was employed because it integrates energy, labor, and capital as multiple inputs for GDP and calculates different disaggregate efficiencies, which overcome any possible bias in the traditional energy efficiency indicators. By determining the slacks using the DEA model, the input and output improvements can be determined, with the actual value of the inputs and outputs being used to obtain the target input and output ratios, and the ratio of the target value to the actual value being used to further explore the efficiencies. Honma and Hu (2008), Chang and Hu (2010), L. Li and Hu (2012), Honma and Hu (2014), L. Li et al. (2016), and Honma and Hu (2018) all used total-factor energy efficiency to explore the energy and environmental efficiencies in Japan, China, and Taiwan.
The target input (or output) and the actual input (or output) for the disaster mitigation expenditure, number of disaster mitigation and control projects, economic losses, and number of disasters can be calculated using Equations 7–10, with the target input (or output) and actual input (or output) being employed to calculate the efficiencies for each sub-item. For each specific evaluated DMU, the disaster mitigation expenditure, the number of disaster mitigation and control projects, economic losses, and the number of disaster efficiencies were calculated using Equations 15–18.


If the target disaster mitigation expenditure input was equal to the actual input, and the undesirable economic losses and number of disaster outputs equaled the actual undesirable outputs, then the efficiencies equaled 1, indicating overall efficiency. However, if the expenditure input was less than the actual input and the undesirable economic loss and number of disaster outputs were less than the actual undesirable outputs, then the efficiencies were less than 1, indicating overall inefficiency. If the target desirable output for the number of disaster mitigation and control projects was equal to the desirable output for the actual number of disaster mitigation and control projects, then the efficiency was 1, indicating overall efficiency; however, if the actual desirable output for the number of disaster mitigation and control projects was less than the target desirable output number of disaster mitigation and control projects, then the efficiency was less than 1, indicating overall inefficiency.
Empirical Results
Data Sources and Description
This study used Chinese panel data from 2011 to 2016 from 27 eastern and western provinces (see Appendix Figure A1). The index data (Table 1) were extracted from the China Environmental and Protection Bureau Annual Reports and the China Environmental Statistical Yearbooks (2012–2017; Ministry of Ecology and Environment of the People’s Republic of China, 2017).
Inputs and Outputs.

Data and Analysis
Data statistics
Figure 1 shows that from 2011 to 2016, the maximum number of natural disaster mitigation projects rose, was the lowest at 9,062 projects in 2012, which was valued at 192.23 million CNY, and rose to 24,183 projects, a rise of 166.87%, in 2013, which was valued at 198.07 million CNY. Sichuan Province had the highest and lowest values as it was affected by the Lushan Earthquake event in 2013, at which time the government increased the number of natural disaster mitigation and control projects in Sichuan Province. The minimum value for the natural disaster mitigation and control project efficiency over the 6 years was basically stable at 1, with only small fluctuations, indicating that natural disaster mitigation project construction had continued in all 27 provinces. The average number of construction projects in the 27 provinces showed a bell-shaped trend, with the highest being 1,367 in 2013. The variations in the standard deviations were the same as the changes in the mean values, with the peak in average project numbers and the standard deviation being more affected by the peak in the number of projects in 2013.

Natural disaster mitigation projects from 2011 to 2016.
Figure 2 shows the changes in the disaster mitigation expenditure from 2011 to 2016, from which it can be seen that the maximum increased in stages. From 2011 to 2013, the expenditure changed little at around 200,000 million CNY. From 2014, the expenditure rapidly increased, reaching a peak of 394,682 million CNY, an increase of 97.34% over the previous year. Sichuan had the largest natural disaster mitigation and control expenditure of the 27 provinces over the whole period, with the highest being in 2012 at 2,097 million CNY and the lowest being in 2016 at 528 million CNY. From the maximum and minimum values, the natural disaster mitigation and control expenditure gap between the provinces was increasing; however, the mean natural disaster mitigation and control expenditure was steadily increasing, indicating that the funds being made available each year in the 27 provinces were increasing. The standard deviation showed a left-sided bell-shaped distribution, with the values for the first 3 years being relatively low and relatively stable and the values in the last 3 years having a downward trend, which was because of the effect of the maximum mitigation and control expenditure.

Natural disaster mitigation expenditure from 2011 to 2016 (unit for the value of expenditure: million CNY).
Figure 3 shows the figures for the number of natural disasters (includes earthquakes, landslides, floods, typhoons, fires, extreme temperatures, rainstorms, drought) from 2011 to 2016, from which it can be seen that there were significant changes in the maximum number of disasters from 2011 to 2016, with the greatest number being in 2011 at 8,844. The disaster frequency in other years was relatively low but remained above 2,000, and, overall, from 2012 to 2014, there was a slight rising trend. The province with the largest number of disasters was Hunan, with the main natural disasters being landslides. The minimum number of natural disasters changed little, with the mean value having a decreasing trend, which indicated that natural mitigation and control expenditure were achieving good results. The standard deviation variation was affected by the difference between the maximum and the minimum values. In 2011, as there were a maximum number of disasters, the standard deviation was larger; however, the changes in the other years were more stable.
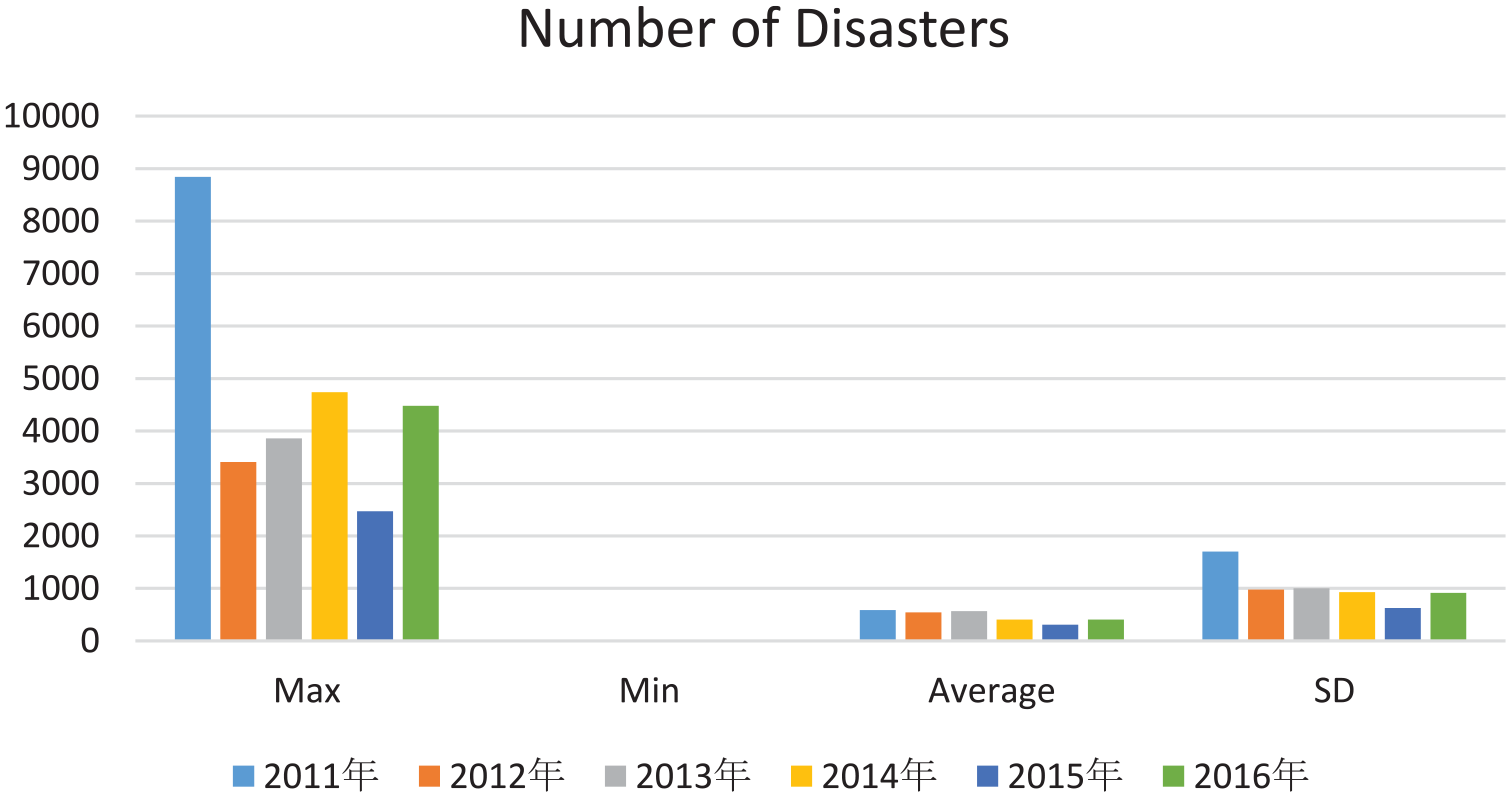
Number of disasters from 2011 to 2016.
Figure 4 shows the economic losses resulting from natural disasters. The greatest economic losses occurred in Gansu in 2013 at 667,296 million CNY, which was 64% of all economic losses of all 27 provinces. The major natural disasters in Gansu in 2013 were generally the result of rainstorm. The smallest economic losses were in 2015 at 51,197 million CNY, which seemed to indicate that as the number of natural disaster mitigation and control projects increased, the ability to mitigate the losses continued to improve. The minimum value had a decreasing trend, and the mean value had a left-sided bell-shaped distribution, with the highest being in 2013 at 38,626 million CNY and the lowest being in 2015 at 9,274 million CNY. The changes in the standard deviation were consistent with the changes in the mean and maximum values, which were affected by the maximum economic losses in 2013.

Economic losses from 2011 to 2016 (unit for the value of economic losses: million CNY).
Overall Efficiency
Table 2 shows the overall provincial efficiency scores. Guangdong, Hebei, Shandong, and Sichuan had overall efficiencies of 1 in 3 years, Sichuan had an efficiency of 1 in 5 years, with a low efficiency of 0.5 only in 2012; Guangdong’s efficiency in 2012 was also below 0.6 but rose to 0.9 in 2016; Shandong’s was less than 0.50 in 2012, rose to 1 in the following 2 years, dropped to between 0.6 and 0.7 in 2015, and rose again to around 0.9 in 2016; and Anhui, Fujian, Guangxi, Liaoning, Zhejiang had overall efficiencies of 1 in only 1 year but were below 0.7 in other years. However, most other provinces had efficiencies below 0.6. The overall efficiencies in Chongqing, Gansu, Henan, Jilin, Jiangxi, Ningxia, Tibet, Xinjiang were all around 0.5 in all 6 years, but in 2013, Ningxia’s was below 0.2, and Tibet’s was only 0.3.
Overall Efficiency by Province From 2011 to 2016.

Note. DMU = Decision-Making Unit.
The overall efficiencies fluctuated significantly in some provinces and fluctuated mildly in others. Chongqing, Gansu, Henan, Jilin, Jiangxi, Ningxia, Tibet, and Xinjiang had small fluctuations with overall efficiencies at around 0.5; and Hubei, Jiangsu, Qinghai, Shanxi, and Yunnan had large efficiency fluctuations with their overall efficiencies reaching 1 in 1 or 2 years. Yunnan was the most efficient in 2011 at around 0.9, which fell to below 0.6 in 2012 and then rose to above 0.8 in 2013. Hubei’s highest efficiency was in 2011, but was only around 0.5 in the other 5 years, and Jiangsu had a similar trend. The highest efficiency in Shanxi was 0.9 in 2014 and the lowest was below 0.6 in 2013. Therefore, there was still a need for overall efficiency improvements in many provinces/municipalities.
Index Efficiency
Table A1 (see the appendix) shows the disaster mitigation expenditure and natural disaster mitigation and control project efficiencies in each province from 2011 to 2016, with the disaster mitigation expenditure efficiencies being somewhat better than the natural disaster mitigation and control project efficiencies. Although no province had an efficiency of 1 in all 6 years, many provinces achieved total efficiency in most years. Anhui, Fujian, Hebei, Guangdong, Guangxi, Liaoning, Sichuan, and Zhejiang had annual disaster mitigation expenditure and natural disaster mitigation and control project efficiencies of 1 in more than 4 years, with Anhui, Hebei, and Sichuan having efficiencies of 1 in the last 4 years. The disaster mitigation expenditure and natural disaster mitigation and control project efficiencies in Fujian, Guangdong, Guangxi, Hubei, Jiangxi, Liaoning, and Zhejiang fell in 2016.
The disaster mitigation and control project efficiencies were relatively low in most provinces, with only Sichuan achieving efficiencies of 1 or close to 1 in most years; however, Hebei’s disaster mitigation and control project efficiency reached 1 in 2013, 2015, and 2016; in 2012 was close to 1; and was above 0.7 in 2014. Shandong’s disaster mitigation expenditure and natural disaster mitigation and control project efficiency for the first 4 years was 1 or close to 1, fell to around 0.7 in 2015, and rose to 0.9 in 2016; Guangdong’s was 1 in 2011, 2012, and 2014, around 0.7 in 2013, and above 0.9 in 2015 and 2016; Anhui, Fujian, Guizhou, and Liaoning’s were 1 or close to 1 in 2 years; and some provinces had efficiencies of 1 for 1 year and efficiencies of around 0.7 for other years. Therefore, there was a need for similar disaster mitigation and control project efficiency improvements in most provinces.
Table A2 (see the appendix) shows that most provinces had poor number of disaster and economic loss efficiencies. Sichuan, Guangdong, Hebei, and Shandong had relatively good number of disaster efficiency performances. After a low efficiency of only 0.2 in 2012, Sichuan had number of disaster efficiencies of 1 for the following 5 years; Guangdong had a number of disaster efficiency of 1 in 3 years, 0.27 in 2013, but reached more than 0.9 in 2016; and Hebei and Shandong also had number of disaster efficiencies of 1 in 3 years, efficiencies of around 0.2 in 2013, and efficiencies of 0.9 in 2016. Gansu, Henan, Jiangsu, Jiangxi, Inner Mongolia, and Xinjiang all had numbers of disaster efficiencies below 0.2 for 6 consecutive years, with the lowest being in Henan at only 0.004 in 2014.
The highest number of disaster efficiencies in the other provinces were only around 0.6, with Anhui, Fujian, Guiyang, Henan, Jiangsu, Inner Mongolia, Qinghai, Tibet, Xinjiang, and Yunnan all having efficiencies of less than 0.1 in 2016. Therefore, there was a significant need for improvements.
The natural disaster economic loss efficiencies were also poor in most regions. Sichuan, Guangdong, Hebei, and Shandong, however, had relatively good performances. Sichuan had a natural disaster economic loss efficiency of 1 in 2011, only 0.2 in 2012, and 1 for the remaining 4 years. Guangdong had a natural disaster economic loss efficiency of 1 in 3 years, an efficiency of only 0.27 in 2013, and 0.9 in the last year. Hebei had a natural disaster economic loss efficiency of 1 for 3 years, an efficiency of only 0.1 in 2011, 0.3 in 2012, 0.7 in 2014, and 1 in the following 2 years. Shandong had a natural disaster economic loss efficiency of 1 for 3 years; 1 in 2011, 0.2 in 2012, 1 in 2013 and 2014, above 0.4 in 2015, and 0.9 in 2016.
As Chongqing, Gansu, Henan, Jiangsu, Jiangxi, Inner Mongolia, Shaanxi, and Xinjiang all had natural disaster economic loss efficiencies below 0.2 and as low as 0.1 for 6 consecutive years, there was a great need for improvements.
There were significant disaster economic loss efficiency fluctuations in many provinces and across the provinces. For example, Fujian had a high natural disaster economic loss efficiency of 1 and a low disaster economic loss efficiency of only about 0.1; Anhui had a high disaster economic loss efficiency of 1 and a low natural disaster economic loss efficiency of only 0.1, with all other years being below 0.6; Hainan had a natural disaster economic loss efficiency of 1 for 2 years, but only 0.1 in 2016; and Hubei, Hunan, Qinghai, and Yunnan had natural disaster economic loss efficiencies of 0.9 or 0.8 in 2011, but efficiencies below 0.2 in all other years.
Overall, Anhui, Fujian, Guiyang, Henan, Hubei, Jiangsu, Liaoning, and Yunnan had very low natural disaster economic loss efficiencies in 2016 at less than 0.1, indicating that there was a significant need for natural disaster economic loss improvements in these provinces.
Conclusions and Policy Suggestions
This study used an EBM DEA model with undesirable output to evaluate the natural disaster mitigation efficiencies in 27 Chinese provinces, in which disaster expenditure was the input indicator and disaster mitigation and control projects the output indicator, with the number of disasters and natural disaster economic losses being the undesirable outputs, from which the following conclusions were made:
There were large overall efficiency differences across the provinces. The province with the highest overall efficiency was Sichuan, which achieved an efficiency of 1 in 5 of the 6 years, and Guangdong, Hebei, Shandong, and Chongqing had overall efficiencies of 1 in 3 of the 6 years; however, the overall efficiencies in the other provinces were all around 0.5.
There were also large differences in the disaster mitigation expenditure efficiencies. Eight provinces had efficiencies of 1 in more than 4 years, and seven provinces experienced a significant decline in disaster mitigation expenditure efficiencies in the last year.
Except for Sichuan, Guangdong, Hebei, and Shandong, the disaster mitigation and control project efficiencies were generally low, with Sichuan, in particular, having an annual efficiency score of 1 or close to 1. Anhui, Fujian, Guizhou, and Liaoning had disaster mitigation and control project efficiencies of 1 or close to 1 in 2 years, and most other provinces had efficiencies of 1 in 1 of the 6 years, with the other years fluctuating around 0.7.
The number of disaster efficiencies was generally poor in all provinces except for Sichuan, Guangdong, Hebei, and Shandong. However, six provinces had number of disaster efficiencies of 0.2 or lower, with the lowest being Henan at only 0.004 in 2014. The highest number of disaster efficiency in the other provinces was only 0.6, and 10 provinces in 2016 had number of disaster efficiencies lower than 0.1. Therefore, there was a significant need for improvements in dealing with the number of disasters in most provinces.
The natural disaster economic loss efficiencies were low in most regions except for Sichuan, Guangdong, Hebei, and Shandong, with several other provinces—Chongqing, Gansu, Henan, Jiangsu, Jiangxi, Inner Mongolia, Shaanxi, and Xinjiang—having economic loss efficiencies lower than or equal to 0.2; and Anhui, Fujian, Guiyang, Henan, Hubei, Jiangsu, Liaoning, and Yunnan having economic loss efficiencies lower than or equal to 0.1 in 2016.
Policy suggestions
Based on these conclusions, the following policy suggestions and managerial advice is given to assist in improving Chinese provincial disaster mitigation management. As China has a vast, geographically diverse territory, different regions face different natural disasters (Figure A1 in the appendix). Western provinces close to the Himalayas, such as Tibet, Sichuan, Qinghai, and Xinjiang, tend to experience periodic earthquakes, mudslides, or forest fires, whereas the eastern coastal areas experience typhoons and heavy rain. The two northeastern provinces, Heilongjiang and Jilin, are affected by forest fires and regional natural disasters, whereas the third, Liaoning, has typhoons, heavy rains, and natural mountain disasters. The central region is affected by annual torrential rains and floods in the rainy seasons. Therefore, the natural disaster mitigation efforts in each province must be designed based on their specific regional characteristics.
The central government needs to invest in natural disaster prevention and governance and maintain long-term investment and monitoring, and the government and the private sector disaster prevention funds raised need to have better cost controls. It is vital that provinces focus on disaster management mitigation efforts related to their disaster types. For example, the most common natural disaster occurrences in Tibet are landslides, which can result in traffic accidents; therefore, long-term strategic landslide treatment is needed to mitigate the losses from landslide accidents.
Natural disaster management involves both early warning systems and post-disaster rebuilding. The disaster prevention and control project efficiency was found to be low in the examined years in most provinces, indicating that the disaster prevention input and outputs were far from Pareto optimal. With most provinces seemingly relying on post-event disaster management mitigation, few have been actively focused on pre-prevention work, with most being somewhat complacent about developing adequate disaster prevention and mitigation measures. Therefore, the use of the disaster investment funds needs to be adjusted to improve pre-disaster mitigation, such as enforcing building and infrastructure design codes in disaster-prone areas to increase risk-resistance and delivering disaster prevention education to the public to guide them on protecting their lives and property. After the lessons learned from the 2008 Chengdu Earthquake, all new buildings were built to withstand strong earthquakes to reduce future losses.
The government needs to encourage cross-regional cooperation by building a platform for sharing disaster management experiences and technology, which would assist the provinces to improve their mitigation governance capacities and efficiencies. Governance-sharing platforms would allow them to organize activities, exchange experiences and information, and share technology. For example, as there is significant cooperation with nongovernment organizations, local governments, the central government, universities, and other institutions on research, policy development, capital, and technology in Sichuan, the province has achieved good disaster mitigation and governance results. However, in other regions, this kind of multiparty cooperation is rare; therefore, nongovernment agencies, international agencies, and academic institutions need to be encouraged to participate in disaster management and mitigation. For example, the communication and cooperation with other regions in Sichuan’s post-disaster reconstruction has improved the overall disaster mitigation efficiency in various regions. Sichuan has experienced many severe earthquake disasters and its post-disaster reconstruction has laid a good foundation for future disaster prevention and mitigation. Therefore, as Sichuan is now close to Pareto optimal for disaster prevention and needs little improvement, its construction experience needs to be shared with other provinces.
Tibet, Xinjiang and Qinghai, and Gansu need to develop appropriate flood and natural disaster mitigation measures by strengthening the mountainsides to reduce the danger of and damage from landslides, the eastern region needs to strengthen its typhoon and flood mitigation and control measures, the central region needs to strengthen the ecological restoration and construction of river regulation and protection, and the northeast region needs to focus on the mitigation and control of forest fires. Provinces with good economies and those with relatively few natural disasters are able to maintain relatively good overall efficiency. However, in recent years, these regions have also experienced a significant decline in efficiency, which needs to be improved through learning, communication, and sharing.
Natural disaster prevention and management improvement can be achieved by designing and optimizing disaster management and response systems and ensuring that the necessary departments are managed by professionals to improve the public’s disaster awareness and early warning capabilities and enhance the province’s rapid response capabilities.
This article used an EBM DEA model to assess the natural disaster mitigation efficiencies in 27 Chinese provinces, the results from which can assist national and provincial governments in more accurately determining their natural disaster governance priorities. This research addressed the shortcomings in previous research and gives guidance to effective long-term natural disaster mitigation management in China. Future research intends to employ DEA models and other methods and expand the samples and time frames to further study the natural disaster prevention and control efficiencies in various provinces and provide focused governance policy recommendations.
Limitations
Due to data collection difficulties, only data from 2011 to 2016 were collected. If there were more data available, the results would be more accurate and up-to-date, which is the main limitation of this article. Furthermore, the data samples did not include all provinces/municipalities in China, such as Heilongjiang, Beijing, Tianjin, and Shanghai. Therefore, no reference suggestions can be made for disaster management in these areas.
Footnotes
Appendix
Disaster Numbers (DN) and Economic Loss (EL) Efficiencies From 2011 to 2016.

| No. | DMU | 2011 DN | 2012 DN | 2013 DN | 2014 DN | 2015 DN | 2016 DN | 2011 EL | 2012 EL | 2013 EL | 2014 EL | 2015 EL | 2016 EL |
|---|---|---|---|---|---|---|---|---|---|---|---|---|---|
| 1 | Anhui | 0.2695 | 0.1158 | 0.4426 | 1 | 0.0357 | 0.0741 | 0.4719 | 0.1158 | 0.4426 | 1 | 0.1202 | 0.5528 |
| 2 | Chongqing | 0.0257 | 0.0803 | 0.3188 | 0.0681 | 0.1879 | 0.1625 | 0.0147 | 0.0649 | 0.1817 | 0.0427 | 0.0312 | 0.1625 |
| 3 | Fujian | 0.1966 | 0.802 | 1 | 0.9362 | 0.1039 | 0.1344 | 0.2588 | 0.802 | 1 | 0.9363 | 0.1966 | 0.1344 |
| 4 | Gansu | 0.0185 | 0.1087 | 0.1213 | 0.202 | 0.1447 | 0.1269 | 0.0011 | 0.0192 | 0.0482 | 0.202 | 0.0093 | 0.0861 |
| 5 | Guangdong | 1 | 1 | 0.266 | 1 | 0.2979 | 0.9168 | 1 | 1 | 0.266 | 1 | 0.9593 | 0.9168 |
| 6 | Guangxi | 0.2201 | 0.1826 | 0.4523 | 0.3628 | 0.0626 | 0.5874 | 0.7682 | 0.1343 | 0.4523 | 0.5523 | 0.4692 | 0.5874 |
| 7 | Guizhou | 1 | 0.4103 | 0.444 | 0.1991 | 0.3522 | 0.2898 | 1 | 0.2489 | 0.0336 | 0.1991 | 0.0733 | 0.2506 |
| 8 | Hainan | 0.0275 | 1 | 1 | 0.314 | 0.2711 | 0.1331 | 0.0275 | 1 | 1 | 0.314 | 0.1907 | 0.1331 |
| 9 | Hebei | 0.4448 | 0.2595 | 1 | 0.7256 | 1 | 1 | 0.0998 | 0.2595 | 1 | 0.7256 | 1 | 1 |
| 10 | Henan | 0.105 | 0.0066 | 0.1951 | 0.0214 | 0.0097 | 0.0014 | 0.0101 | 0.0066 | 0.1951 | 0.0214 | 0.0097 | 0.0014 |
| 11 | Hubei | 0.3357 | 0.0352 | 0.1333 | 0.0589 | 0.0351 | 0.1243 | 0.7909 | 0.0352 | 0.0379 | 0.0589 | 0.1049 | 0.1243 |
| 12 | Hunan | 0.0643 | 0.0134 | 0.0454 | 0.0424 | 0.0158 | 0.0777 | 0.4349 | 0.0134 | 0.0454 | 0.0424 | 0.0158 | 0.0777 |
| 13 | Jilin | 0.151 | 0.0335 | 0.0573 | 0.1211 | 0.0598 | 0.2698 | 0.151 | 0.0276 | 0.0144 | 0.1212 | 0.0598 | 0.2698 |
| 14 | Jiangsu | 0.2667 | 0.2628 | 0.8942 | 0.6592 | 0.089 | 0.129 | 0.149 | 0.1909 | 0.0572 | 0.1959 | 0.0373 | 0.129 |
| 15 | Jiangxi | 0.0783 | 0.0219 | 0.1041 | 0.0729 | 0.0042 | 0.1133 | 0.0783 | 0.0219 | 0.1041 | 0.0729 | 0.0076 | 0.1133 |
| 16 | Liaoning | 0.0263 | 0.0254 | 1 | 1 | 1 | 0.083 | 0.0209 | 0.006 | 0.1894 | 1 | 1 | 0.0413 |
| 17 | Inner Mongolia | 0.3318 | 0.4377 | 0.3262 | 0.0152 | 0.0383 | 0.0179 | 0.09 | 0.04 | 0.0388 | 0.0152 | 0.0383 | 0.0052 |
| 18 | Ningxia | 0.0457 | 0.0258 | 0.7387 | 0.0325 | 0.0156 | 0.2355 | 0.0143 | 0.0258 | 0.5803 | 0.0325 | 0.0156 | 0.3046 |
| 19 | Qinghai | 0.4278 | 0.0882 | 0.1048 | 0.1227 | 0.0305 | 0.0176 | 0.6252 | 0.0891 | 0.0345 | 0.2716 | 0.015 | 0.0176 |
| 20 | Shandong | 1 | 0.2024 | 1 | 1 | 0.4583 | 0.9299 | 1 | 0.198 | 1 | 1 | 0.4583 | 0.9299 |
| 21 | Shanxi | 0.3058 | 0.3546 | 0.2969 | 0.9599 | 0.4402 | 0.4745 | 0.0798 | 0.345 | 0.0873 | 0.9599 | 0.1348 | 0.4745 |
| 22 | Shaanxi | 0.027 | 0.055 | 0.0856 | 0.0694 | 0.1051 | 0.4032 | 0.0226 | 0.0378 | 0.0279 | 0.0694 | 0.0016 | 0.4032 |
| 23 | Sichuan | 1 | 0.1702 | 1 | 1 | 1 | 1 | 1 | 0.08 | 1 | 1 | 1 | 1 |
| 24 | Tibet | 0.0308 | 0.0152 | 0.4972 | 0.1484 | 0.0085 | 0.0276 | 0.0224 | 0.0068 | 0.2839 | 0.1175 | 0.0018 | 0.0258 |
| 25 | Xinjiang | 0.0583 | 0.0204 | 0.0884 | 0.0994 | 0.008 | 0.022 | 0.0583 | 0.0002 | 0.0884 | 0.0994 | 0.0062 | 0.0061 |
| 26 | Yunnan | 0.9198 | 0.2408 | 0.8082 | 0.2815 | 0.0642 | 0.0556 | 0.9198 | 0.0876 | 0.068 | 0.1689 | 0.021 | 0.0459 |
| 27 | Zhejiang | 1 | 0.1062 | 0.5596 | 0.8578 | 0.1359 | 0.4752 | 1 | 0.1062 | 0.5596 | 0.8578 | 0.4306 | 0.4752 |
Note. DMU = Decision-Making Unit.
Declaration of Conflicting Interests
The author(s) declared no potential conflicts of interest with respect to the research, authorship, and/or publication of this article.
Funding
The author(s) disclosed receipt of the following financial support for the research, authorship, and/or publication of this article: National natural Science fund in China, No. 71773082; Sichuan Science project, No. 2020JDR0079; The Fundamental Research Funds for the central Universities (Grants No. SCU-BS-PY201016).