
Abstract
Castañeda v. Pickard mandated that educational programs for emergent bilinguals be tested for program efficacy. As English language development (ELD) curricular materials are one part of an instructional program, we assess this mandate by examining the effectiveness of ELD materials in Texas, a large, diverse U.S. state with large numbers of emergent bilingual (EB) students. Using local linear matching, we find robust evidence that schools that do not purchase any ELD curricula have significantly lower English language proficiency scores relative to schools that purchase state-adopted ELD materials. In contrast, there is no significant difference between schools that adopt the two most popular ELD curricula in the state. This study suggests that curriculum materials matter for EBs’ English proficiency and implies that states should take a more active role in ensuring students have access to these materials.
Keywords
Emergent bilinguals are one of the fastest growing and one of the most underserved student populations in the United States (Capps et al., 2005; Genesee et al., 2005; National Education Association, 2008). Since 2000, the emergent bilingual (EB) population in American public schools has grown by 28% (National Center for Education Statistics, 2019) and now accounts for 9.6% of all public school students in the United States. Of all EBs in the United States, 78% are Hispanic, and the majority qualify for free or reduced lunch. Emergent bilinguals are “triply segregated”—more likely to attend schools with other EBs, minorities, and low-income students (Orfield, 2001; Orfield & Lee, 2006; Rios-Aguilar & Gándara, 2012). Results from the 2019 National Assessment of Educational Progress show that EB-non EB achievement gaps are as large as gaps for students who do and do not receive free or reduced-price lunch.
To improve the educational outcomes of EBs, federal court cases have required that programs for EBs be effective. Castañeda v. Pickard (1981) mandated that educational programs for EBs be based on sound educational theory, implemented effectively, and tested for program efficacy. As research has shown that textbooks influence the content and methods that teachers use in the classroom (Alajmi, 2009, 2012; Robitaille & Travers, 1992), English language development (ELD) textbooks can play an integral role in program efficacy. (We primarily use the term “textbooks” in this paper to refer to the traditional paper volume that contains a comprehensive, year-long, subject-specific curriculum. We sometimes also refer to “curricula” or “curriculum materials,” which include both textbooks and also other resources teachers call on to implement their lessons. We draw these definitions from Polikoff et al. (2018). This article is the first of which we are aware to address the third mandate in the Castañeda v. Pickard [1981] ruling by measuring the relationship between ELD curriculum materials and EBs’ English proficiency.
The association between textbook quality and student achievement has important implications for local education agencies. As the costs of textbooks across publishers are quite similar, districts have the potential to increase student achievement at minimal marginal cost (Chingos & Whitehurst, 2012). Furthermore, efforts to improve the achievement of EBs by making better curriculum choices may face fewer challenges compared to other alternatives (e.g., increasing the number of bilingually certified teachers), which may be less feasible or politically palatable. Although a few studies have looked at the relationship between mathematics textbooks and student achievement (Agodini et al., 2010; Bhatt et al., 2013; Bhatt & Koedel, 2012; Blazar et al., 2019; Koedel et al., 2017), no studies have examined the effect of ELD textbooks on the English proficiency of EBs. This study seeks to fill this important gap in the research by answering two research questions:
To what extent do English proficiency outcomes differ between schools purchase any ELD curriculum materials and schools that purchase state-adopted curriculum materials?
To what extent do English proficiency outcomes differ between schools that use the two most popular ELD curriculum materials (Rigby and National Geographic)?
Although our work is centered in one U.S. state—Texas—the findings have potentially broad implications for the education of EB students in the United States and abroad. We discuss these in the conclusion of the manuscript.
A note about terminology. Following Burke et al. (2016), we use the term emergent bilingual in lieu of the following: English language learner (ELL), English as a second language (ESL), and limited English proficient (LEP). Scholars have objected to the terms “limited English proficient” and “English language learner” (García, 2009) due to its deficit-framing of the linguistic abilities of emergent bilinguals. The terms also suggest that English proficiency is the only desired outcome for this population of students (Menken & Solorza, 2014). Referring to this group of students by an additive name that does not focus on its limitations is an important step toward the decentering of English monolingual norms. Similar to Burke et al. (2016), we use the term emergent bilingual with two exceptions. First, the terms ELL, ESL, and LEP may be used when referencing federal and state laws. Second, the terms ELL, ESL, and LEP may be used in the literature review if the authors of the studies use the terms.
Background Information
Research on Textbook Efficacy
The choice of textbooks can significantly affect student achievement. Five recent rigorous, empirical studies examine the relationship between textbooks and student academic outcomes. We briefly review these studies and their methods and findings here, though we note that none of the studies specifically focused on ELD materials as we do.
First, Agodini et al. (2010) use a randomized control trial across 12 districts to compare the effects of four elementary mathematics on student achievement in Grades 1 and 2. The authors find that math curricula correspond to large differences in achievement. For example, by the end of Grade 2, certain curricula were associated with an increase of 0.17 standard deviations in student test scores.
Second, three quasi-experimental studies use matching techniques in Indiana (Bhatt & Koedel, 2012), Florida (Bhatt et al., 2013), and California (Koedel et al., 2017) and find positive effects of one of the studied elementary mathematics textbooks in each state (on the order of .05 to .10 standard deviations per year, and larger for low-income students). The largest and most recent study (Blazar et al., 2019), in contrast, used a value-added methodology and found no impacts of elementary mathematics textbooks across six states.
Together, these findings imply that the choice of textbook, at least in elementary mathematics, may have direct impacts on student achievement that do not depend on measures of teacher implementation. In contrast to this evidence from mathematics, to our knowledge no studies have examined the effect of ELD textbooks on EBs’ English language proficiency. This study is the first to use quasi-experimental methods to assess the effectiveness of ELD instructional materials, an important issue given large achievement gaps between EB and non-EB students, the large numbers of EB students across the nation, and federal mandates to provide a quality education to these students.
State Textbook Adoptions
In many countries, there are national curricula and national textbooks, such that schools use only one of a few state-approved textbooks or other curriculum materials. The situation is different in the United States. In the United States, each state sets its own content standards (what are often referred to as “curriculum” in other nations) and its own rules with regard to textbooks and other curriculum materials. Some U.S. states conduct state-level textbook adoptions and some states allow for local control of textbook purchases (Zeringue et al., 2010). Texas is one of the two largest U.S. states, and it conducts a state adoption. However, the adoption is merely advisory, meaning that the state puts out a list of approved materials but districts can purchase materials on or off the list. Historically, publishers were thought to tailor their books to the needs and preferences of the Texas State Board of Education and concentrate their selling efforts in Texas (Bowler, 1978; Stein et al., 2001). However, Texas’ national influence on textbook adoption has likely waned since the adoption of Common Core State Standards (CCSS). While 42 states and the District of Columbia have adopted the CCSS, Texas has not.
District Textbook Adoptions
In all 50 U.S. states, district leaders are the ultimate deciders with respect to which textbooks and other curriculum materials they want to adopt for their particular district. Textbook adoptions in Texas districts are uniform adoptions at the district level, meaning that all schools in the district use the same materials (Texas Education Agency [TEA], 2014). One exception to this general rule in Texas is for charter schools, which we exclude from our analyses for this reason. Unlike in other subjects, Texas districts are not mandated to purchase any ELD textbooks at all, and they can also purchase on or off the state-approved list (TEA, 2011). Given the great flexibility that districts have over ELD textbook adoption, it is important to understand how this autonomy has impacted the English proficiency of EBs.
Prior research has shown that district leaders consult a variety of sources to make textbook adoption decisions. Using data from over 150 interviews with curriculum decision-makers in eight states, Zeringue et al. (2010) found that district leaders had limited information on textbook efficacy and, therefore, tended to make adoption decisions based on other factors such as teacher acceptance and advice from neighboring districts. In addition, Zeringue et al. (2010) found that 80% of curriculum leaders sought out information about textbook use, effectiveness, and acceptance of the materials. This finding was supported by recent research in California, which found that school district leaders were eager to learn from available data and from the experiences of other districts when making mathematics textbook adoptions (Polikoff et al., 2020). Thus, if more research was available regarding textbook efficacy, curriculum leaders may use this information to make better choices.
ELD Textbooks in Texas
The 2011–2012 school year is the most recent ELD textbook adoption cycle in Texas. During this adoption cycle, the state released a list of seven state-approved ELD curricula. Of the seven, two are online programs and five are traditional textbooks. The textbooks vary along several dimensions including number of lessons on forms of English, opportunities to learn new vocabulary words, and the ratio of listening/speaking activities to reading/writing activities. Of the five traditional curricula, Rigby On Our Way to English and National Geographic Reach are the most popular, comprising 69% of adoptions in Texas (see Table 1).
Number of Schools That Adopted Each Curriculum in Texas for Grade 3 (N = 1,253).
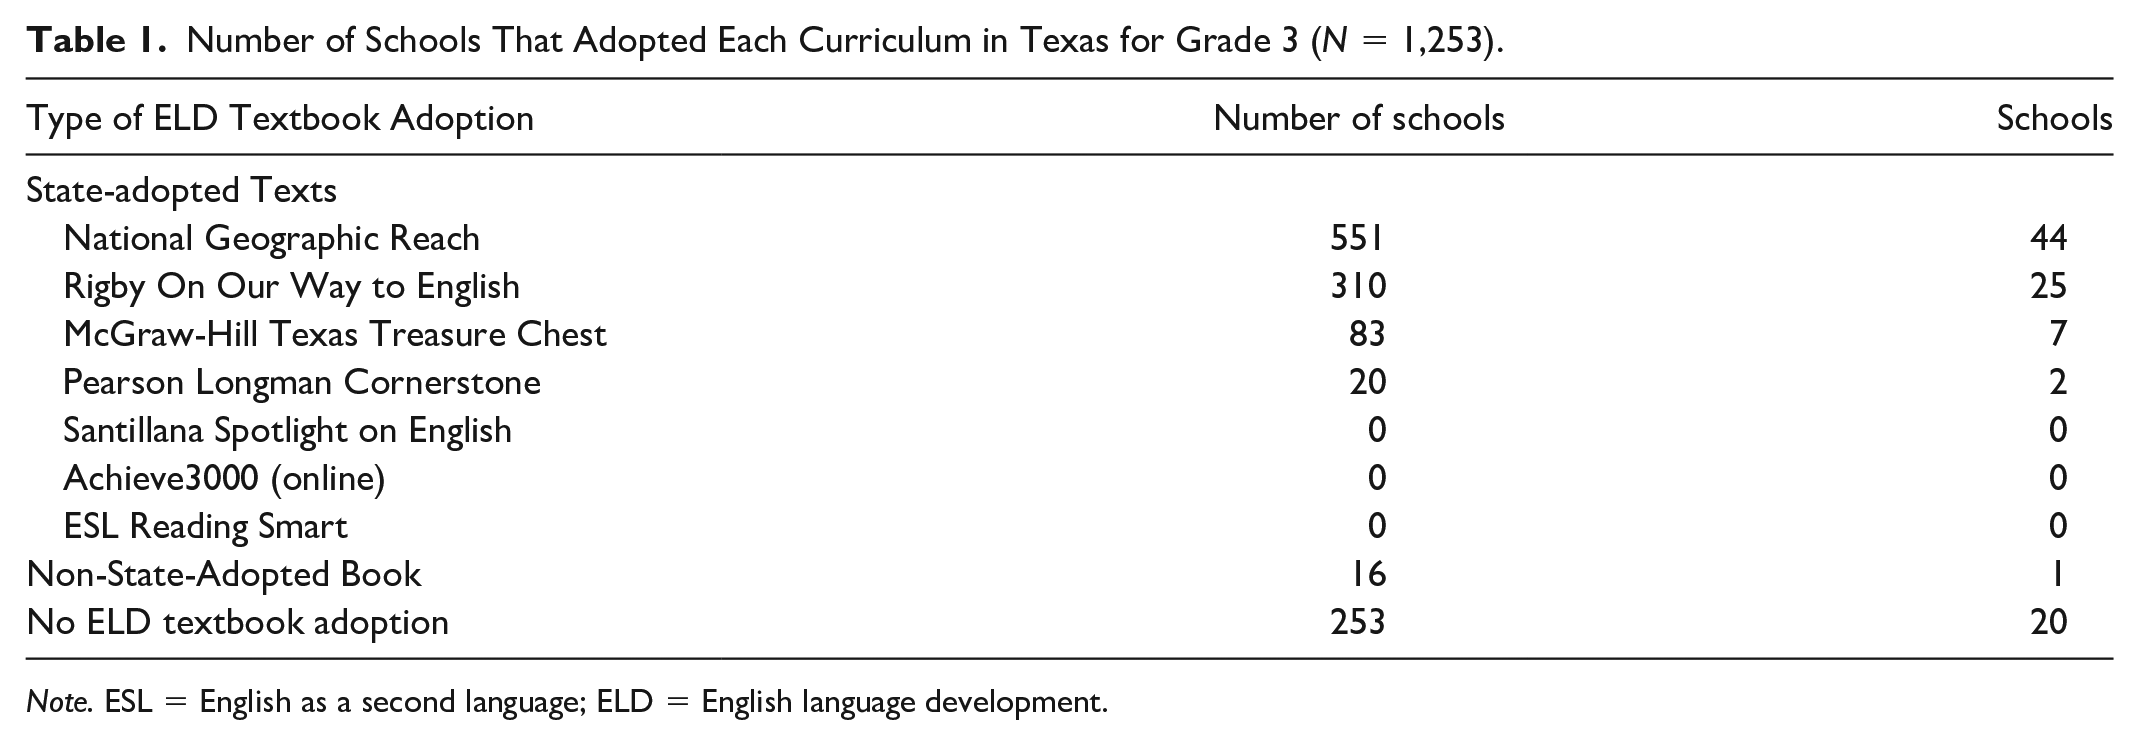
Note. ESL = English as a second language; ELD = English language development.
With 515 schools across 48 districts adopting National Geographic Reach, it is the most frequently adopted ELD curricula and represents 44% of adoptions. The author of this book also authored the widely-used Sheltered Instruction Observation Protocol, which is designed to improve instruction for EBs. National Geographic Reach was first published in 2011. A student anthology in the National Geographic Reach series is usually divided into eight units. Each unit includes multiple opportunities to use language frames, share aloud with a partner, learn conversational and academic vocabulary, and practice language-learning strategies (e.g., predicting, rereading and retelling). The anthology includes a mix of fiction and nonfiction texts.
With 313 schools across 37 districts adopting Rigby On Our Way to English, it is the second most popular ELD curricula in Texas. Rigby is a registered trademark of Houghton Mifflin Harcourt. On Our Way to English is marketed as a comprehensive ELD program that focuses on academic language, vocabulary development, content-based instruction, and oral language. The text is typically divided into eight units with each unit providing opportunities to engage with fiction and nonfiction texts. On Our Way to English was first published in 2011 and is available in a Texas-specific version and a national version. In contrast, a Texas-specific version of National Geographic Reach does not exist.
Data
We describe our quasi-experimental design below, which was approved by the institutional review board of our university. The data for this study come from the state of Texas. Texas serves roughly 5,400,000 students across approximately 1,250 public school districts. The racial composition of students in Texas’ public schools is as follows: 53% Hispanic, 27% White, 13% Black, 4% Asian, and 2% multiracial (National Center for Education Statistics, 2019). Roughly 17% of students in Texas’ public schools are identified as English language learners.
Texas is an ideal state for the study of ELD curriculum materials on EBs’ English proficiency for several reasons. First, Texas is home to approximately 900,000 EBs, the second highest number of EBs in the United States after California. Second, the textbook adoption process is centralized in Texas and the state tracks textbook adoption data, which allows for a more manageable analysis. Third, Texas has a large number of school districts, which allows for adequate statistical power for student achievement analyses. Fourth, as Texas grants great autonomy to districts over ELD textbook adoption, there is variation in the kinds of ELD instructional materials that are adopted. In the years under study, districts in Texas report using 7 different state-approved ELD curricula and 21 different non-state-approved ELD curricula. There are no other U.S. states that meet all these criteria, so it is unlikely that this research could have been carried out in any other state.
Textbook information was collected from districts using the TEA (TEA) online data portal. The TEA collects information, which is publicly available through Freedom of Information Law request, on instructional materials allotment (IMAT). We obtained ELD textbook purchases for the years 2011–2015. The following textbook information is available for each district: publisher, textbook title, subject, grades used, unit price, quantity of units purchased, and adoption year. We found 418 districts on the IMAT list for years 2011–2015, which left 810 districts with missing information on ELD textbook adoption.
As the IMAT report only captures purchases made using state funds, it does not capture instructional materials that were purchased using local funds nor instructional materials that were purchased prior to 2011. To obtain information on ELD instructional materials for the remaining 810 districts, we submitted Public Information Requests to each district with missing ELD textbook information and received responses from 737 districts. Overall, we obtained data on ELD textbooks from 94% of Texas school districts.
Analytic Sample
We focus our analysis on elementary schools in Texas that serve EBs. As the study focuses on elementary ELD books, we drop middle and high schools from the sample. In addition, elementary schools that do not have any EBs (n = 82 schools) are excluded from the study as they do not have a need for ELD curricular materials.
Table 2 provides details about the construction of the analytic sample starting with the universe of 3,085 elementary schools in Texas that are eligible for the study. After four exclusion criteria were applied following the criteria used by Koedel et al. (2017), 1,253 elementary schools (41%) remain in the sample. First, schools that adopted multiple ELD curricula in grades K-3 were dropped from the sample. Roughly 3% of schools were excluded for this reason. Although it is possible to examine mixed-treatment effects, there are too few schools for an effective analysis of this question.
Construction of the Analytic Sample.

Note. TELPAS = Texas English Language Proficiency Assessment System; HISD = Houston Independent School District; DISD = Dallas Independent School District.
Second, elementary schools that did not report English language proficiency scores for spring 2015 were eliminated from the study. There are two scenarios in which the state would not report Texas English Language Proficiency Assessment System (TELPAS) scores: (a) when the number of students tested is so small that it may be possible to identify particular students or 2.) when all the students in a group have the same result (TEA, 2015b). Because the number of EB students in particular schools is often quite small, 48% of Texas elementary schools did not report TELPAS scores for spring 2015 and were, thus, dropped from the study.
Third, less than 1% of schools were eliminated from the study due to missing information regarding ELD adoption. Specifically, 21 schools or 0.7% of the sample were dropped due to missing ELD textbook information. Although public information requests were submitted to all districts in Texas with missing ELD textbook information, three districts out of the remaining districts in the study did not respond. These three districts represent 21 schools. Given these data restrictions, the results from this study are only generalizable to elementary schools in Texas that adopted the same ELD curriculum in grades K-3, reported TELPAS scores in spring 2015, and reported ELD textbook adoption.
Fourth, Houston Independent School District (HISD) and Dallas Independent School District (DISD) were dropped because both districts are much larger than all other districts in the state which made it difficult to find comparable matches in our propensity score models. After dropping HISD and DISD from the sample, 1,253 schools and 191 districts remain. The final analytic sample retains 41% of the universe of schools and 29% of the universe of districts.
ELD Textbook Adoption Patterns
In the final analytic sample, we find that the majority of elementary schools in Texas that serve EBs purchase state-adopted ELD materials (see Table 1). While roughly 1% of the final analytic sample purchased materials that were not on the state-adopted list, 79% of schools purchased materials on the state-adopted list. Approximately 20% of schools in the final sample did not purchase any ELD materials even though they did have sufficient numbers of EB students in their school for their TELPAS scores to be reported. Of the ELD materials on the state-adopted list, National Geographic Reach and Rigby On Our Way to English were the most popular with 69% of schools in the final analytic sample purchasing one of these two materials.
School-Level Variables
Although ELD textbook adoption typically occurs at the district level, we match at the school level for two reasons. First, matching is a “data hungry” process that requires a large sample size (Heckman et al., 1998). Second, schools within the same district can vary greatly in their demographics, test scores, teacher experience, and so on. Conducting the analysis at the school level allows us to adjust for both school- and district-level characteristics (Bhatt et al., 2013; Bhatt & Koedel, 2012).
School-level data are drawn from the TEA online data portal. Information about students and teachers are available at the school level. With regard to teachers, the following information is available: experience, gender, race, and credential type. In terms of students, the following information is available at the school level: race, gender, free/reduced price lunch eligibility, special education eligibility, English language learner status, district average math and reading score on the State of Texas Assessments of Academic Readiness (STAAR), and district average English language proficiency scores on the TELPAS (Texas English Language Proficiency Assessment System). Since the last year of ELD textbook adoption in Texas was the 2011–2012 school year, we use achievement and demographic data from 2010-2011 to match schools.
Outcome Variables
School-average composite scores on the spring 2015 TELPAS assessment serve as the outcome variable. The TELPAS assessment is delivered on a yearly basis to monitor EBs’ progress in attaining English proficiency. As there are four language modalities—listening, speaking, writing, and reading—the TELPAS exam is divided into four sections. Students are given a rating of 1–4 on each subtest where 1 represents Beginning, 2 represents Intermediate, 3 is Advanced, and 4 represents Advanced High (TEA, 2016). To arrive at the composite score, TEA weights each section as follows: listening (0.10), speaking (0.10), reading (0.50), and writing (0.30). Using student-level TELPAS scores, we create school-average composite TELPAS scores which are approximately normally distributed (see Figure 1).

Distribution of outcome variable.
As the STAAR reading assessment may appear to be very similar to the TELPAS exam, we briefly clarify the differences between the two assessments and justify using TELPAS scores as the outcome variable. While the reading portion of the STAAR assesses students’ mastery of content standards for English language arts, the TELPAS assessment focuses on language standards—not content standards. The reading portion of the STAAR assessment only measures reading abilities and does not include a listening and speaking portion. As the TELPAS exam covers all four language modalities (listening, speaking, reading, and writing), the TELPAS is better positioned to assess English proficiency. Increased English proficiency may lead to greater access to content standards; therefore, it is possible that increases in TELPAS scores lead to increases in STAAR reading scores. However, as TELPAS scores are a more direct measure of English proficiency than STAAR reading scores, we use TELPAS scores as the outcome variable.
Research Design
To model the association between ELD curriculum materials and EBs’ English proficiency, we use local linear matching. Bhatt and Koedel (2012) used a similar matching approach to evaluate relative curriculum effectiveness in the state of Indiana. As districts can self-select into the treatment (i.e., the ELD textbook), selection bias may affect our coefficient estimates. Matching on school characteristics reduces group differences across all the observed variables used in the propensity score equation (Shadish et al., 2002). Matching can allow for causal inferences if the conditional independence assumption is met (Heckman et al., 1997; Rosenbaum & Rubin, 1983).
The conditional independence assumption requires that potential outcomes be independent of textbook choice conditional on the observables. The conditional independence assumption will not be satisfied if unobserved characteristics influence both the treatment (choice of textbook) and the outcome (TELPAS scores). By using an estimated propensity score, we can match schools based on their observable characteristics to minimize the likelihood that unobserved characteristics may influence the outcome. Matching has two main advantages over a simple regression analysis. First, matching has fewer restrictions on functional form (Black & Smith, 2004). Second, matching can more accurately predict the relationship between covariates and the outcome variable by restricting the influence of noncomparable treatment and control units (Black & Smith, 2004).
Of schools that adopt ELD materials in the final analytic sample, 92% adopted new ELD curricula in 2011–2012. Thus, third graders in 2014–2015 will have potentially been exposed to the ELD curricula for 4 years. If an ELD curriculum is effective, then districts using this curriculum should have higher TELPAS scores for their EB students compared to districts that did not adopt this particular curriculum.
Following Bhatt and Koedel (2012), we use the term “total treatment effects” to account for the possibility of the estimates capturing systematic differences between treatment and control schools. For example, if one curriculum has a teacher’s guide that is easier to navigate, the estimates will reflect this difference. Based on the series of falsification tests we conducted for the study, we find little evidence to suggest that there are systematic differences between treatment and control schools. However, it should be noted that the estimates from this study will capture “total treatment effects.” We cannot measure teachers’ implementation of the adopted curriculum materials to estimate the impact of teacher use on student outcomes. No data on teacher implementation of curriculum materials are collected by the state or any other agency.
Propensity Score Estimation
In order for propensity score matching to yield unbiased estimates of the effectiveness of ELD textbooks, two types of covariates should be included: (a) pretest measures of the outcome variable and (b) direct measures of the selection process (Cook & Steiner, 2010; Glazerman et al., 2003; Steiner & Cook, 2013). The first type of covariate is easily obtainable through TEA. We include school average TELPAS composite scores from spring 2011 (pre-adoption) in the selection model. The higher the correlation between pretest and posttest, the greater the bias reduction (Steiner & Cook, 2013). The correlation between school-average TELPAS scores in 2011 and school-average TELPAS scores in 2015 is 0.43. The second type of covariate is slightly harder to obtain. Steiner and Cook (2013) suggest investigating the actual selection process before starting the study because the omission of important variables can increase bias in the estimates (Heckman et al., 1997). Shadish and Steiner (2010) recommend interviewing relevant individuals to identify factors that influence selection into treatment and studying the pertinent research literature. In addition, economic theory and previous empirical findings should guide the choice of variables to include in the propensity score estimation (Caliendo & Kopeinig, 2008).
Heckman et al. (1997) find that selection models that include variables related to treatment assignment are better able to predict treatment assignment than models that only include demographic characteristics like education and race. The covariates that are used to estimate the propensity score should include all of the key factors affecting both the outcome variable and the treatment assignment (Smith & Todd, 2005). When creating a list of covariates for the propensity score estimation, there is a tradeoff between bias and variance. Including an irrelevant variable can lead to increased variance, while excluding a potentially important confounder can lead to increased bias (Heckman et al., 1997; Stuart, 2010).
We investigate the selection mechanism using two methods. First, we conduct in-depth interviews with 28 district leaders in Texas, which we describe in the following paragraphs. Second, we review previous research on textbook effectiveness to identify potential covariates (Rubin, 2001).
District Leader Interviews
To understand the factors influencing ELD textbook adoption, we conducted 28 in-depth interviews with district leaders using structured open-ended interviewing protocols. We focus on district leaders because textbook adoption typically occurs at the district level in the state of Texas. To ensure the representativeness of the interview findings, the districts selected for interviews represented variation along two dimensions: percentage of EBs (e.g., low and high) and ELD textbook adoption patterns (four possible patterns)—yielding eight total cells. Using proportional stratified sampling, we selected two to eight districts from each cell, giving a total of 28 districts. Interviews lasted approximately 45 min and were audio recorded and transcribed. Interview data were analyzed using NVivo software.
In the initial cycle of interview data review, which required at least three readings of the full transcript, we used structural codes, which entail little interpretation. Structural coding “acts as a labeling and indexing device, allowing researchers to quickly access data likely to be relevant to a particular analysis from a larger data set” (Namey et al., 2008, p. 141). Although interviews covered a range of topics, including program model for EBs, we subjected the entire transcript to this initial coding, as district leaders spoke about instructional materials in response to questions not directly about instructional materials. The first cycle of coding revealed 27 structural codes related to ELD textbook adoption. These structural codes were further categorized and analyzed in the second stage of review.
In the second cycle of coding, the primary goal is to create categorical, thematic, and conceptual organization from the array of codes that emerged from first cycle coding (Saldaña, 2013). We used pattern coding in the later stages of data analysis to group codes into a smaller number of themes. Five main factors emerge from the interview data as shaping district leaders’ decisions around ELD textbook adoption: number of EBs, academic achievement of EBs, district leaders’ beliefs about second language acquisition, district budget, and program model for EBs. We briefly discuss each of these factors in the paragraphs that follow.
One factor that district leaders take into consideration when deciding which ELD curriculum to adopt is the number of EBs in their district. Six out of 28 district leaders cited EB enrollment as a factor for ELD textbook adoption. For example, a curriculum facilitator in district 15 states that “the number of students that we have identified [as ESL]” is a major determinant in whether or not ELD materials are purchased. This district leader elaborates, If there’s a high number of students then, of course, the need [for ELD instructional materials] would be greater. But if there is a low number of students then our expert teachers in the bilingual department will be able to modify their instruction to meet the needs of their ESL or ELL students
For this particular district, bilingual teachers are expected to meet the linguistic needs of EBs in the event that ELD materials are not purchased. To model the treatment assignment, we include the number of EBs—at both the school and district level—in the propensity score.
Second, district leaders consider EBs’ academic achievement when making curricular decisions. Eight out of 28 district leaders report EBs’ test scores (e.g., scores on the STAAR test, scores on language proficiency tests) as a factor that influences ELD textbook adoption. District Leader 18 shares, We’re a pretty successful district when you look at state scores. What we have found is that a lot of the times the basals don’t get you where you need to get. We pull from a lot of different resources.
As this district leader seems to be satisfied by her district’s test scores, she does not see a need to purchase ELD materials. Instead, she believes that the district’s current curriculum, which seems to be a mixture of various resources, is sufficient to meet the needs of the students. Furthermore, District Leader 12 looks at “proficiency projections as well as grade-level means” to determine whether or not ELD materials need to be purchased. We include pre-treatment school and district average reading achievement on the Texas Assessment of Knowledge and Skills (TAKS) and TELPAS in the estimation of the propensity score.
A third factor that influences ELD materials purchasing is district leaders’ beliefs about second language acquisition. Thirteen out of 28 district leaders use their beliefs about second language acquisition to make decisions about ELD materials. Some leaders believe that second language learning is not much different from first language learning; thus, EBs do not need additional materials. For instance, District Leader 10 states, “We don’t have a particular program that we offer or provide for [EBs] . . . We just rely on good instruction.” This district did not purchase any ELD curricular materials because school administration believes that the instruction that all students receive should be effective for EBs as well. As it is difficult to directly assess district leaders’ beliefs about second language acquisition for every district in Texas, we adjust for the following Census characteristics at the district level: median income and the percentage of non-English speakers in the district. As beliefs about language learning may vary based on professional status (Horwitz, 1999), we include median income to proxy for professional status. As classroom and social peers influence learning (Arnold, 1999), we include the percentage of non-English speakers in the district as a means of capturing the variation in beliefs about second language acquisition.
Fourth, cost is another factor that districts weigh in their decision to purchase ELD texts. Sixteen out of 28 district leaders report that cost is an important consideration in ELD materials purchasing. An elementary school principal from District 21 states, “We are a small, rural district. So we also have to think about using our money wisely too . . . the main thing we have to make sure of is that it’s something we can afford. Price would be the big decision-maker.” Along the same lines, District Leader 15 states that “the budget is always a factor.” We include district per pupil revenue along with district instructional expenditures to capture each district’s financial ability to purchase ELD materials.
Fifth, a district’s program model for EBs emerges as another factor influencing ELD materials purchasing. Eight out of 28 district leaders state that the district’s program model for EBs impacts whether or not ELD materials are adopted. Districts that have bilingual programs are less likely to purchase ELD texts because they are already purchasing texts in other languages, usually Spanish, for their EBs which reduces the amount of money that is available for ELD texts. In addition, districts that have bilingual programs also have bilingual teachers and some districts use bilingual teachers’ knowledge of second language acquisition to supplant ELD instructional materials. In the propensity score estimation, we include a dichotomous variable indicating the presence of a bilingual program.
In addition to district leader interviews, prior research on textbook adoption can help to model the selection mechanism (Caliendo & Kopeinig, 2008; Heckman et al., 1997). For instance, Bhatt and Koedel (2012), in modeling the effect of mathematics textbooks on achievement, use the following covariates in their propensity score model: enrollment, attendance rates, demographics (race, language status, free lunch status), achievement outcomes from prior years, per pupil expenditures, and Census measures (e.g., median household income, share of adults with a high school diploma). Table 3 contains the final list of covariates used to estimate the propensity score.
Covariate-by-Covariate Balancing Details for the Comparison Between No ELD Text and State-Adopted ELD Text.
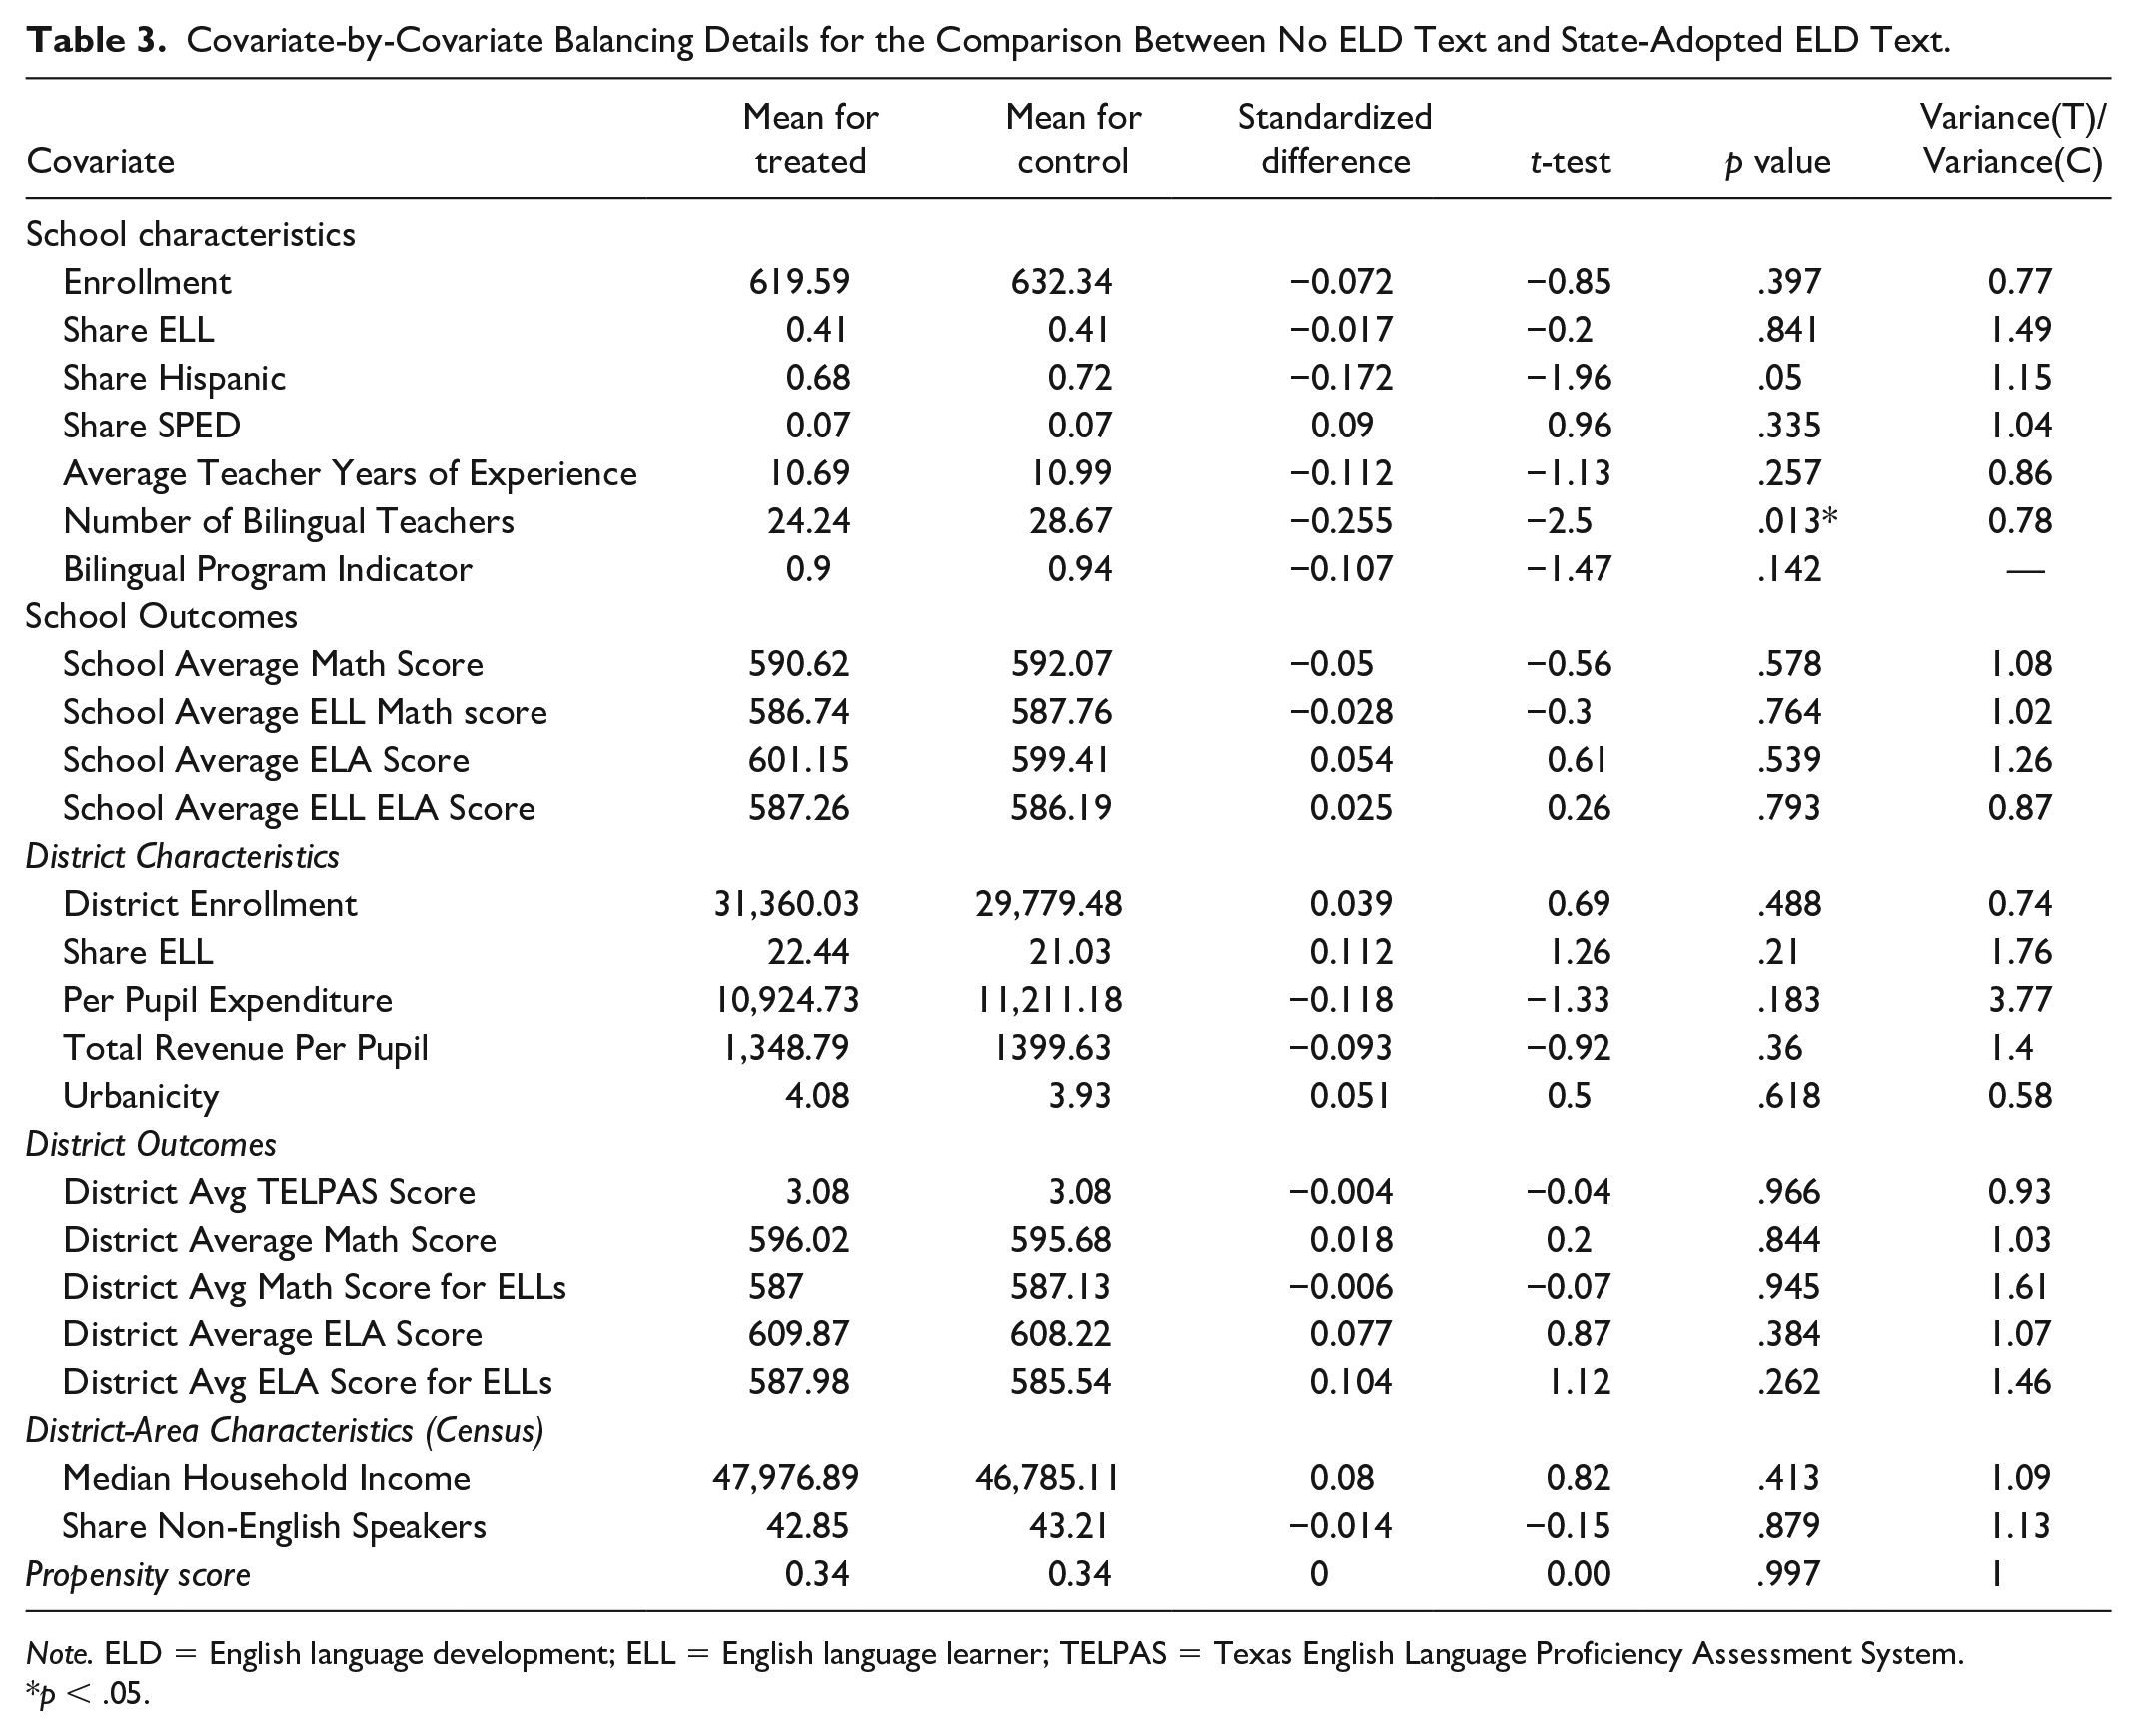
Note. ELD = English language development; ELL = English language learner; TELPAS = Texas English Language Proficiency Assessment System.
p < .05.
Balancing Tests
We test for covariate balance using three different tests. Multiple tests are used because there is no clearly preferred test for balance, and different tests may yield different results (Smith & Todd, 2005). As there are two research questions, the propensity score must be calculated separately. While the first propensity score measures the probability of not choosing an ELD text, the second propensity score measure the likelihood of adopting Rigby On Our Way to English. For this reason, covariate balancing is assessed twice (Tables 3 and 4).
Covariate-by-Covariate Balancing Details for the Comparison Between Rigby On Our Way to English and National Geographic Reach.

Note. ELL = English language learner; TELPAS = Texas English Language Proficiency Assessment System.
p < .05.
Following Rubin (2001), we calculate the standardized difference in the mean propensity score in the two groups. To minimize bias, the standardized difference should be zero or close to zero. Although there are no formal criteria for evaluating standardized differences, Rosenbaum and Rubin (2001) suggest that values greater than 0.20 should be interpreted as large. The standardized difference for the propensity score is 0.001 for both research questions.
Second, we calculate the variance ratios of the propensity score distribution in the treatment and control groups (Rubin, 2001). To minimize bias, the variance ratios should ideally lie between 0.8 and 1.25. Variance ratios smaller than 0.5 or greater than 2.0 are considered extreme (Rubin, 2001). The variance ratio of the propensity scores are 1.00 for both research questions.
We extend the first two balancing tests to include individual covariates. Although Rubin (2001) recommends balancing on propensity score alone, we also calculate the standardized difference and variance ratio for each covariate in the propensity score model. By doing so, we can gain a more robust understanding of the comparability of the control and treatment groups. For the first research question, we find that the variance ratio for all covariates is in the range of acceptability [0.5, 2.0] except for district per pupil expenditure which has a variance ratio of 3.77. State-adopters have a wider range of per pupil expenditures than nonadopters. For the second research question, the variance ratio for share of EBs is 0.45 which is slightly outside the range of acceptability. Schools that adopt National Geographic Reach have a larger range of percentage of EBs compared to school that adopt Rigby On Our Way to English. The absolute value of the standardized difference is less than 0.20 for all covariates except for the number of bilingual teachers which has a standardized difference of −0.26. For the first research question, nonadopters, on average, have 29 bilingual teachers while state-adopters average 24 bilingual teachers per campus.
Third, we present results from hypothesis tests. Although hypothesis tests and p values should not be used as measures of balance (Ho et al., 2007; Stuart, 2010), they are still common in balancing tests. Results from hypothesis testing may be misleading as small differences in means may be statistically significant in a large sample. Although results from hypothesis tests are not given much consideration, we present them to create a more robust understanding of covariate balance. For the first research question, treatment and control schools differ significantly on one variable—number of bilingual teachers. For the second research question, treatment and control schools differ significantly on two variables—number of bilingual teachers and median household income.
Overall, these tests suggest that the individual covariates and the propensity scores are well balanced between treated and control units. The standardized difference for the propensity score is 0.001 the variance ratio is 1 for both balancing tests.
Matching Algorithm
Matching algorithms assume that the outcome variable is independent of treatment assignment conditional on a set of observable characteristics (Smith & Todd, 2005). In addition, it is assumed that for all conditioning variables, there is a positive probability of assignment to treatment or control conditions. This assumption implies that a match can be found for all treated cases. Matching estimators perform well in replicating the results of a randomized control trial when the following criteria are met: (a) the same data sources are used for both control and treated units, (b) control and treated units reside in the same labor market, and (c) the data contain a rich set of covariates that impact both treatment assignment and the outcome variable (Heckman et al.,1998, 1997; Smith & Todd, 2005). There is strong evidence suggesting that all three conditions are met in this study. First, covariates and outcome variables are the same for both treatment and control schools and is also measured in the same way for both groups. Second, all treatment and control schools reside in the same geographic area—Texas. Third, conditioning variables adjust for a wide array of characteristics—reading and math achievement, English proficiency, teacher quality, demographic characteristics, and median household income. As these foundational requirements have been met, it is appropriate to proceed with matching.
We choose local linear matching (LLR) over other matching methods for three main reasons. First, local linear matching can reduce variance relative to other matching techniques because it relies on more information. While common matching techniques like nearest neighbor matching only use a few observations from the comparison group to construct the counterfactual, local linear matching uses a weighted average of comparison units near the treatment unit. As more information is used, there is lower variance which leads to more precise estimates of the treatment effect. Second, local linear matching includes a linear term in the propensity while kernel matching does not. This added intercept is an advantage whenever there are gaps in the propensity score. Finally, local linear matching relies on weaker assumptions compared to other matching approaches. Rosenbaum and Rubin’s (1983) framework for propensity score matching requires strongly ignorable treatment assignment and common support; kernel-based matching methods such as local linear matching replace these two assumptions with weaker ones (Heckman et al., 1998). Instead of assuming strongly ignorable treatment assignment, Heckman and colleagues only require that the outcome under the control condition for the treated cases to be independent of the treatment assignment, conditional on observed covariates (Guo & Fraser, 2010). Instead of assuming full independence, Heckman and colleagues impose mean independence. Although local linear matching is our method of choice, we also include results from kernel matching, inverse probability weighting with regression adjustment (IPW-RA), and nearest neighbor matching with 1, 2, and 3 neighbors (which will be abbreviated K1, K2, and K3, respectively).
Following Dehejia and Wahba (2002), we trim the sample as needed to determine the support region. There are no control units below the minimum propensity score for treated units for either research question. We also assess for common support by visually inspecting a probability density distribution of the propensity score in both groups. Lechner (2002) argues that common support can be assessed visually, and there is no need to implement more complicated, formal processes. Estimated density functions of the propensity scores for treatment and control schools (available upon request) show strong evidence of common support.
Results
Research Question 1: Nonadopters vs. State-Adopters
Using local linear matching, we compare the effect of not purchasing an ELD text to the effect of purchasing a state-adopted ELD text. We find that elementary schools that do not purchase any elementary ELD texts score 0.30 standard deviations lower on school-average TELPAS composite scores (see Table 5). Following Bhatt et al. (2013), standard errors are estimated by bootstrapping using 250 repetitions and clustered at the district level.
Average Treatment Effects of Nonadoption Relative to State-Adopted ELD Instructional Materials on TELPAS Spring 2015 Composite Scores.
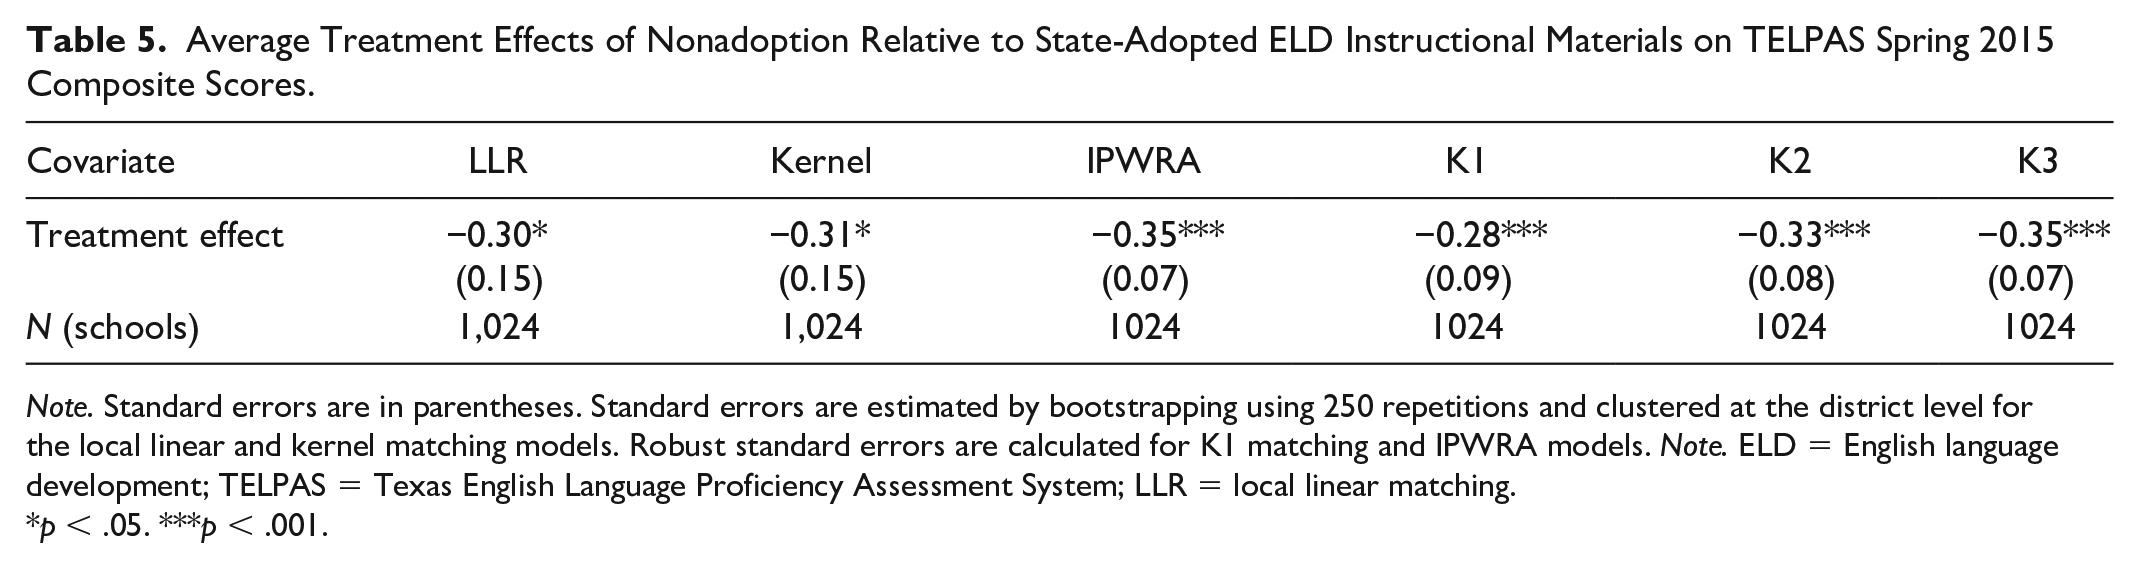
Note. Standard errors are in parentheses. Standard errors are estimated by bootstrapping using 250 repetitions and clustered at the district level for the local linear and kernel matching models. Robust standard errors are calculated for K1 matching and IPWRA models. Note. ELD = English language development; TELPAS = Texas English Language Proficiency Assessment System; LLR = local linear matching.
p < .05. ***p < .001.
To address the robustness of the findings, we compare results across all matching models. The results from the kernel matching estimator are similar to the estimates from the local linear matching model with nonadopters scoring 0.31 standard deviations lower than state-adopters. Results from the IPWRA and nearest neighbor matching models are similar in magnitude with nonadopters scoring 0.28–0.35 standard deviations lower than state-adopters. The standard errors in these models are roughly half the size of the standard errors in the local linear matching model. One reason for the large standard errors for the LLR and kernel matching models may be due to the use of bootstrapping methods. The nearest neighbor matching and IPW-RA models rely on Abadie–Imbens standard errors (Abadie & Imbens, 2008) instead of bootstrapped standard errors.
Regardless of the type of matching estimator used, a common pattern emerges across all six models; schools that do not adopt any ELD curricula have TELPAS composites scores that are roughly 0.30 standard deviations lower than schools that purchase state-adopted ELD curricula. As previously mentioned, these results are only generalizable to schools in Texas whose TELPAS scores are not masked, use the same ELD curricula in grades K-3, and who did not have missing textbook data.
Research Question 2: Rigby On Our Way to English vs. National Geographic Reach
When comparing the Rigby On Our Way to English curricula to National Geographic (NG) Reach, we find that schools that use Rigby have slightly higher TELPAS composite scores in all outcome models but these differences are not statistically significant (see Table 6). The standard errors for these estimates are slightly larger than the standard errors for the previous research question due to the smaller sample size. It is possible that there is a treatment effect in the population; however, this study may not be able to identify the treatment effect given the limited sample size. Relatedly, this study was not able to assess the effectiveness of any other ELD curricula due to small sample size.
Average Treatment Effects of Rigby On Our Way to English relative to National Geographic Reach on TELPAS Spring 2015 Composite Scores.
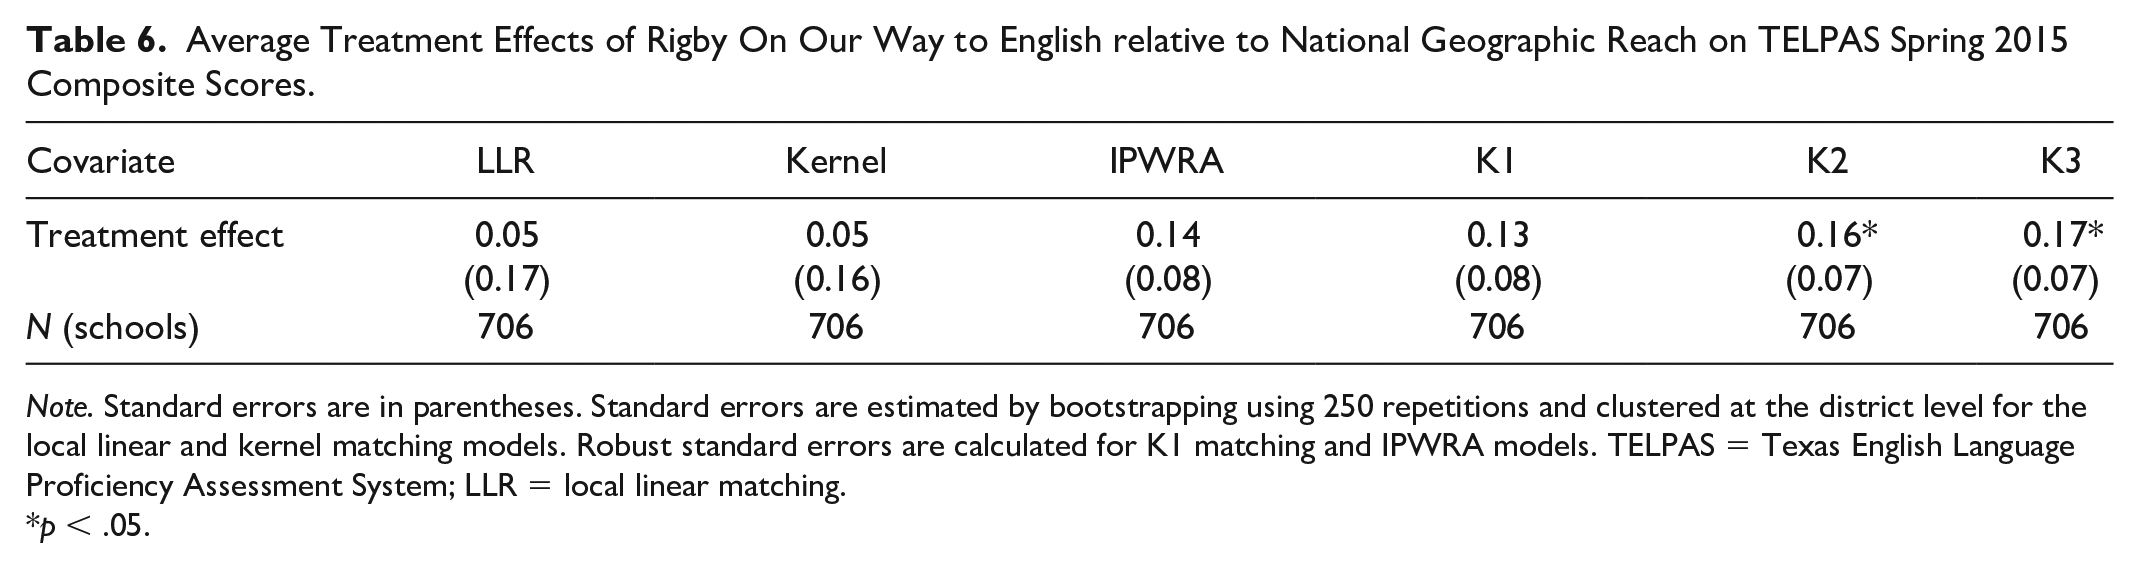
Note. Standard errors are in parentheses. Standard errors are estimated by bootstrapping using 250 repetitions and clustered at the district level for the local linear and kernel matching models. Robust standard errors are calculated for K1 matching and IPWRA models. TELPAS = Texas English Language Proficiency Assessment System; LLR = local linear matching.
p < .05.
The nonsignificant differences in TELPAS scores between Rigby-adopters and NG-adopters is, for the most part, mirrored in the kernel matching, IPWRA, and K-1 matching models. However, the K-2 and K-3 matching models find that Rigby-adopters have significantly higher TELPAS composite scores. According to the K-2 and K-3 matching models, Rigby users score 0.16 standard deviations higher on TELPAS composite scores relative to schools that adopt National Geographic Reach. The standard errors are smaller in the K2 and K3 models because there is more information being used. However, these estimates should be interpreted with caution as bias increases as more control units are matched to each treated unit.
Falsification Tests
Propensity score matching will not provide causal estimates if the conditional independence assumption (CIA) is violated. The CIA can be violated if there are systematic differences in school or district quality across the various curriculum adopters that captured by the covariates in the model. If these differences are correlated with curriculum adoptions and student achievement, then the estimates may be biased. For example, if there are differences in commitment to improving achievement for EBs across the various curriculum adopters, this could bias the estimates. Although it is impossible to rule out all possible sources of bias, we provide evidence about the general reliability of the findings using two falsification tests.
For the first falsification test, we estimate ELD curriculum effects on math achievement for third-grade EBs (see Table 7). If there are unobserved differences across adopting districts that are not captured by the covariates in the model, then we might see significant differences between treated and control units on math scores for third-grade EBs in 2015. The confounding factor (e.g., commitment to improving educational outcomes for EBs) will be present in the form of nonzero curriculum effects. If curriculum effects are not significantly different from zero for unexposed cohorts, then it is the curricula themselves, not other unobserved differences, that are driving the estimates. As English language proficiency is correlated with math achievement (Grant et al., 2011), it is possible that nonadopters have lower math achievement than state-adopters. At most, these spillover effects will be small and no larger than the effects from the main findings. We find that schools that do not adopt any ELD curricula score 0.04 standard deviations lower on the state math test than scores that do adopt ELD curricula; however, this difference is not significant. Indeed, these spillover effects are smaller than the main treatment effect of 0.30 standard deviations and are relatively small and nonsignificant. In short, this test provides evidence that the primary findings are not driven by unobserved differences between nonadopters and state adopters.
Falsification Tests: Effects of Nonadoption Versus State-Adoption on STAAR 2015 Math Achievement.

Note. Standard errors are in parentheses. Standard errors are estimated by bootstrapping using 250 repetitions and clustered at the district level for the local linear and kernel matching models. Robust standard errors are calculated for K1 matching and IPWRA models. STAAR = State of Texas Assessments of Academic Readiness; LLR = local linear matching.
In the second falsification test, we use third-grade TELPAS scores from spring 2012 as the outcome variable. By the end of the 2011–2012 school year, third graders will have been exposed to the ELD curricula for no more than 1 year. As ELD materials were adopted during the 2011–2012 school year, it is unlikely that the materials had a large impact on English proficiency less than a year after implementation. If there are significant curricular impacts, then the impact should be smaller in magnitude than the impact on TELPAS spring 2015 scores. Indeed, there are no significant differences between third graders in treatment and control schools during the 2012 TELPAS test (see Table 8). In addition, the estimates are all negative which is consistent with the finding from the main analysis that nonadoption is associated with lower English language proficiency. Less than 1 year after implementation, we find that nonadopters score 0.09 standard deviations lower than state-adopters on the state English language proficiency test; however, this difference is not significant.
Falsification Tests: Effects of Nonadoption Versus State-Adoption on 2011-2012 3rd-Grade TELPAS Composite Scores.
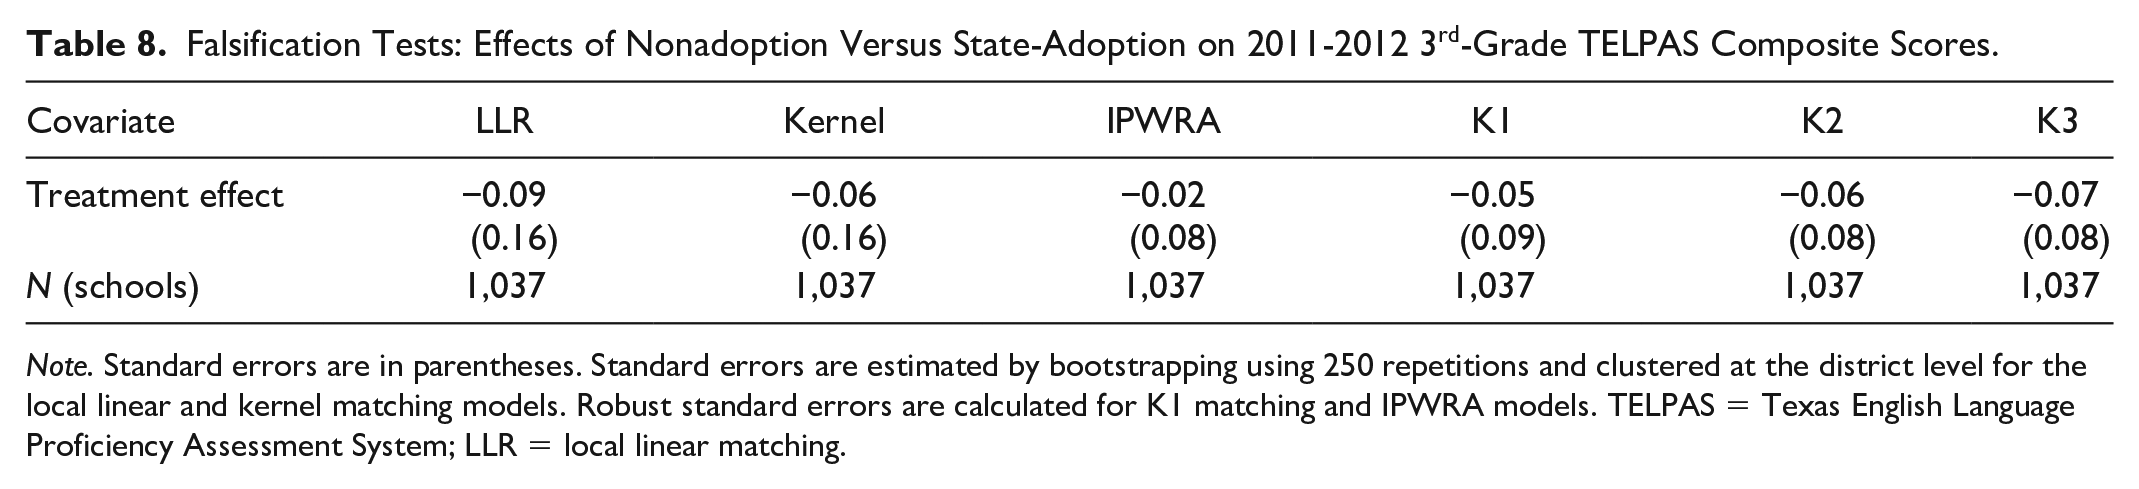
Note. Standard errors are in parentheses. Standard errors are estimated by bootstrapping using 250 repetitions and clustered at the district level for the local linear and kernel matching models. Robust standard errors are calculated for K1 matching and IPWRA models. TELPAS = Texas English Language Proficiency Assessment System; LLR = local linear matching.
We also modeled the data using an alternative approach, employing a comparative interrupted time series (CITS) model to estimate the impact of ELD adoption on English language proficiency. In the CITS regression, we adjust for the same school and district characteristics that are used in the propensity score estimation. The results from the CITS model mirrors the results from the local linear matching model with nonadopters scoring 0.30 standard deviations lower than state-adopters (p<.01). With regard to the second research question, the CITS model reveals no significant differences in spring 2015 English language proficiency score between schools that adopt Rigby and schools that adopt National Geographic. Given the robustness of results across various quasi-experimental methods, there is strong evidence to suggest that state-adopted ELD textbooks have a positive impact on EBs’ English language proficiency.
In sum, both falsification tests point toward the validity of the findings. None of the tests suggests that there are systematic differences between treatment and control schools. In addition, we employed a different type of quasi-experimental method—comparative interrupted time series—and recovered similar treatment effects for both research questions. There are four main reasons to believe that the estimates are unbiased. First, we use multiple balancing tests to assess balance, and all tests show that the covariates are well balanced. The standardized difference of the propensity score is nearly zero and the variance ratio is close to 1. Second, we include pretest measures of the outcome variable, which some researchers argue is the most important factor in propensity score analysis (Shadish & Steiner, 2010). Third, through interviewing district leaders in Texas, we are able to study the selection process. This allows us to choose a rich set of relevant covariates to estimate the propensity score. Fourth, the treatment effect remains robust across various matching models and a CITS regression.
It is also important to discuss what this study is not suggesting. This study does not suggest that off-list ELD materials, or ELD materials that are not on the state-adopted list, are ineffective for ELD instruction. Off-list ELD curricula such as EL Achieve and Carousel of IDEAS may also be effective but due to small sample size we were not able to evaluate the effectiveness of off-list texts.
Discussion
This study makes two contributions to the research literature on curricular effectiveness. This study is the first to assess the effectiveness of ELD curricular materials at the state level. We find moderate to large, statistically significant differences in student achievement based on whether or not schools and districts have adopted a state-approved ELD material. In contrast, we find small-to-zero differences in effects between the two most commonly adopted books, and what differences we find are only sometimes statistically significant. Although the findings only apply directly to Texas, the implication that adopting materials can affect student achievement may be more broadly applicable in other states and beyond. And while we cannot say why adopting ELD materials leads to improvements in student achievement, the most likely and simplest explanation is that these materials lead teachers to implement better instruction (e.g., more coherent, more aligned with standards, more developmentally appropriate) for EB students.
Second, the study contributes to the larger research literature on English language development which is sparse. Saunders et al. (2013) conduct the most comprehensive review of ELD instructional practices and find that little research examines the effects of ELD instruction on EBs’ academic achievement. In fact, as ELD research is so scant, the authors had to rely on second language research in other fields to inform their ELD guidelines. For example, some of the studies included in their synthesis focused on English learners in Quebec, Canada. This study contributes directly to the research literature on ELD because it focuses on English language learners in the United States.
The current study is not able to capture the variation across and within districts with regard to ELD curriculum implementation. It is likely that the impact of ELD curriculum on EBs’ achievement is mediated by the degree of implementation, but no U.S. state tracks the implementation of curriculum materials in ELD or any other subject. If there is a significant relationship between degree of implementation and EBs’ academic outcomes, then it is important to understand the nature of that relationship, and this is an important area for future research. Furthermore, if implementation fidelity is mediated by certain factors (e.g., practitioners’ beliefs about second language acquisition), then it is of import to identify these mediating factors so that barriers to implementation can be addressed.
The qualitative data we collected from interviews with district leaders reveal that there is confusion about the purpose of ELD instruction and how it differs from instruction for monolingual English-speakers. For instance, some district leaders believe that instruction for EBs is “just good teaching” (JGT), and, therefore, there is no need to purchase materials specifically for EBs. In other words, whatever works for monolingual English-speakers is sufficient to address the academic and linguistic needs of EBs. This finding is not new as previous research has found that a “just good teaching” approach is not adequate to meet the academic and linguistic needs of EBs (De Jong & Harper, 2005). Fifteen years after De Jong and Harper coined the term JGT to describe this phenomenon, we find that the JGT view of teaching EBs is still pervasive. Given our finding that the adoption of ELD curriculum materials substantially affects student achievement, we reiterate De Jong and Harper’s (2005) call to explicitly include EBs at all levels of educational policy and practice. If there are expectations that content standards be explicitly and rigorously addressed, the same expectation should exist for English language proficiency standards. Otherwise, a double standard exists based on language which is effectively a proxy for national origin (Lau v. Nichols, 1974).
Castañeda v. Pickard (1981) mandated that educational programs for EBs be tested for program efficacy, which is what we attempt to do in this study. Using local linear matching, we find that students in nonadopting districts have lower English proficiency relative to those in state-adopting districts. Schools that do not have curricula that foreground English language proficiency should consider obtaining instructional materials that explicitly address forms of English, provide ample opportunities to develop all four language modalities, and integrate conversational and academic language. States should also consider mandating the purchase and use of ELD curriculum materials for teaching EB students and supporting the costs associated with such a mandate. Though there is evidence to suggest that ELD instructional materials can improve English language proficiency, much more work needs to be done to adequately meet the academic and linguistic needs of EBs (e.g., tracking of EBs, resegregation efforts that concentrate EBs in low-income schools). Implementing high-quality ELD curricula is only one part of an educational agenda that seeks to redress educational inequities faced by emergent bilinguals.
Footnotes
Declaration of Conflicting Interests
The author(s) declared no potential conflicts of interest with respect to the research, authorship, and/or publication of this article.
Funding
The author(s) disclosed receipt of the following financial support for the research and/or authorship of this article: This work is supported by the National Science Foundation (grant no. 1445654) and the William T Grant Foundation (grant no. 183913). Any opinions, findings, and conclusions or recommendations expressed in this material are those of the author(s) and do not necessarily reflect the views of the funders.