
Abstract
This article examines the impact of excellence-promoting policies on the actual performance of municipalities in the Czech Republic. In this analysis, the performance of municipalities that have received awards for the use of quality management tools is compared with a selected group of municipalities that did not receive awards. Data envelopment analysis (DEA; with constant and variable returns on the scale), free disposal hull (FDH), and Order-M methods were utilized to represent performance. For the actual performance comparison, a quasi-experimental design was used. The analysis of outputs using the difference impact method found that this specific public policy did not have a positive impact on the efficiency of municipalities. If the difference-in-differences method is used, the opposite is achieved. However, the technical efficiency gains are very small. The use of the quasi-experimental design along with the determination of inputs and outputs which are characteristic of the Czech Republic also offers a contribution when this method is being applied to the assessment of institutions in the form of local governments.
Keywords
Introduction
The potential as well as the availability of large data is changing views on public policy and public administration. The use of these tools makes it quite easy to evaluate the results and impacts of public policies (Maciejewski, 2017). On the contrary, one must also be aware of the risks and shortcomings associated with the use of these instruments (Lavertu, 2016). In addition, another problem exists regarding this information not being used by managers and policy makers themselves due to its excessive complexity and insufficient public sector capacities (Ho & Sherman, 2017).
This article endeavors to make a contribution with an example of public policy assessment to support the achievement of excellence in municipalities in the Czech Republic. In this article, the following goals were set:
Design a suitable set of country-specific input and output indicators that will be suitable for applying nonparametric performance analysis methods such as data envelopment analysis (DEA), full disposal hull (FDH), and Order-M. These indicators will be designed based on a current legislation analysis, a comparison with similar legislation from abroad, and a Delphi panel.
Apply quasi-experimental design to a set of local government institutions, namely to specific Czech municipalities, and thus eliminate the influence of environmental factors.
Measure the efficiency of municipalities with more nonparametric methods and evaluate the contributions of the policy of achieving excellence on the efficiency of municipalities in the Czech Republic to achieve a higher degree of verification.
Our article builds upon our previous research (Plaček et al., 2019, 2020b) which analyzed the association between performance measurement, excellence awards, and local government efficiency. Our conclusions were rather skeptical regarding the association between excellence and efficiency. The added value of this article lies in the utilization of more than one nonparametric method to get a higher degree of certainty in our results. Studies usually use just a single nonparametric method for estimating efficiency, for example, DEA. We utilized collectively DEA, FHD, and Order-M. The next benefit of our study is that we use a Delphi panel in combination with desk research to establish inputs and outputs for efficiency estimation. Many authors insist that this is one of the most critical parts of the efficiency analysis. The most popular methods are desk research and literature review. The combination, along with a Delphi expert panel, brings new insights into problematic issues and makes the set of inputs and outputs more precise and realistic.
The article is organized as follows: In the following section, a theoretical background is presented. In the next section, basic information about Czech municipalities and the policy of increasing excellence is provided. In the methodology section, the appropriate input and output indicators for efficiency assessment are defined using nonparametric methods; quantitative methods are also used. In the part devoted to results, the results of the quasi-experimental design application and the application of nonparametric methods for public policy assessment are provided. In the conclusion, the authors have submitted recommendations for public policy.
Theoretical Background
The term “efficiency” started to be promoted in the context of the New Public Management reforms (Pollitt & Bouckaert, 2011) and also during the economic crisis (da Cruz & Marques, 2014; Drew et al., 2015). Efficiency means how well an organization uses resources for public service delivery and the degree to which a system achieves its policy goals (Plaček et al., 2020). In different systems, it has several acronyms, for example, Best Value, 3E, and so on (Plaček et al., 2020a).
Plaček et al. (2020a) point out that we can distinguish between several types of efficiency:
Technical efficiency—producing maximum output with the available inputs for a given technology (Narbón-Perpiña & De Witte, 2014);
Allocation efficiency—finding the optimal allocation of resources to reach the best effect for society (Fogarty & Mugera, 2013);
Cost efficiency—it is a combination of the previously mentioned efficiencies (Fogarty & Mugera, 2013);
Dynamic efficiency—describes the changes in efficiency during time (Drew et al., 2015);
Scale efficiency—considers whether the organization operates at the optimal size (Fogarty & Mugera, 2013), (Drew et al., 2017).
In the context of municipal efficiency, we look for the answers to the questions: (a) which municipalities are relatively more efficient in case of individual service delivery (waste, energy, hospitals, libraries, road maintenance, education, care for elderly, etc.) and (b) which municipalities are relatively more efficient in terms of global efficiency (as a proxy for all municipal services delivered) (Plaček et al., 2020a). One very important part of the theory is an evaluation of the impact of public policy and the impact of different factors connected to the environment (efficiency determinants) where municipalities act on their efficiency (Plaček et al., 2020a). The public policy impact could be described as the association of different forms of public service delivery (privatization, contracting out, outsourcing, municipal cooperation), decentralization, and the merging of smaller municipalities into larger ones with efficiency (Narbón-Perpiña & De Witte, 2018a, b).
Plaček et al. (2020a) present the summary of all environmental factors (efficiency determinants) that could be associated with municipal efficiency. The summary is based on two systematic literature reviews (da Cruz & Marques, 2014) and Narbón-Perpiňa and De Vitte (2018a, b). da Cruz and Marques (2014) point out that the efficiency of local governments could be associated with selected categories of performance determinants (natural determinants, citizen-related determinants, institutional determinants, and legacy determinants). According to da Cruz and Marques (2014), natural determinants describe the natural resources, tourism facilities and attractiveness, and environmental conditions. Citizen-related determinants deal with sociocultural, demographic, and economic characteristics of municipal inhabitants (da Cruz & Marquez, 2014). Institutional determinants describe the regulatory setting, political ideology, types of governments, and fiscal relationships between governments (da Cruz & Marques, 2014). Legacy determinants describe spatial characteristics, technical and infrastructure parameters, and economics characteristic of local government (da Cruz & Marques, 2014). Narbón-Perpiňa and De Vitte (2018a, b) describe very similar categories of determinants: social and demographic, economic, political, financial, geographical and natural, institutional, and management determinants.
Plaček et al. (2020a), da Cruz and Marques (2014), Narbón-Perpiňa, and De Vitte (2018a, b) point out that it is very complicated to fully explain the association between the previously mentioned efficiency determinants and the resulting local government efficiency. Besides the issue of complexity, we must take into account the individual country’s conditions.
Public Policy in the Areas of Efficiency Estimation and the Promotion of Excellence Regarding Local Governments
The Czech Republic has 6,253 municipalities. It is one of the most fragmented states in the European Union (EU; Plaček et al., 2020a). The majority of municipalities have under 1,000 inhabitants (Plaček et al., 2020a). Municipalities have been granted the independent powers by the constitution, for example, they can manage their own properties. Municipalities also perform delegated tasks from the central government, and they are called delegated power and are financed by central government grants (Plaček et al., 2020a).
According to their competencies, we can divide municipalities into three categories: 5,004 municipalities with basic competencies—of these, 3,445 municipalities have fewer than 500 inhabitants; 163 “second” category municipalities; and 81 municipalities with extended competencies. The scope of the state administration is determined together with the grants for their provision (Plaček et al., 2020a).
According to Eurostat (2019), Czech local government revenue is about 11.9% of gross domestic product (GDP) in comparison with local government revenue of EU (28), which is about 10.6% of GDP. The local government expenditures are on the same level as local governments’ revenue (Eurostat, 2019), which is also slightly higher than the average of EU (28).
The National Quality Policy of the Czech Republic represents a set of methods and tools for influencing the quality of products, services, and activities within the national economy and public administration services. The aim of the National Quality Policy program is to create an environment in which quality is a natural part of life in the Czech Republic (Ministry of Interior, 2016, p. 7). The Czech National Quality Award, which aims to promote the spread of quality in public administration and to show cases of good practice, is an important project within the framework of the National Quality Policy.
The Czech Republic’s National Quality Award was adopted by the Government of the Czech Republic by its Resolution No. 806/2001 Coll. With the adoption of the new National Quality Policy for the period 2008–2013, the award was renamed the National Quality Award of the Czech Republic. The program is based on a rigorous and objective verification of efficiency and quality in all activities of the organization and their evaluation, especially in terms of satisfying customer requirements and achieving economic success. The National Quality Prize model of the Czech Republic is based on the European Foundation for Quality Management (EFQM) Excellence Model which is used for the European quality award in many European countries. The National Quality Prize is awarded using the following tools: benchmarking, European Institute of Public Administration Common Assessment Framework (EIPA CAF), Local Agenda 21, and ISO 9001 certification which have been implemented by public authorities, especially by local and regional self-governments. The CAF was implemented in about 60 self-governments, Local Agenda 21 is used by more than 80 self-governments, benchmarking by more than 70 municipalities, and ISO norms by more than 30 self-governments. Quality in public administration is mainly linked to the organization’s efforts to do the correct thing correctly (good governance concept), that is, in a good, efficient, and timely manner (Ministry of Interior, 2016). The official materials of the Ministry of the Interior link quality management to efficiency: Efficiency can be used to designate such a procedure where the Office continuously fulfills the objectives of each objective, the results achieved correspond to the stated objectives and at the same time the Office spends its resources efficiently, effectively, and purposefully in order to achieve the objectives. (Ministry of Interior, 2016, p. 12)
This concept is in line with the 3E model, which is grounded in Czech legislation and says that the organization must evaluate its performance in terms of economy, efficiency, and effectiveness.
Table 1 presents a description of the individual tools for improving the quality in the public sector environment, including references to the current use in the public sector of the Czech Republic.
Quality Management Tools Used in the Czech Republic.

Source. Authors.
Note. EIPA = European Institute of Public Administration; CAF = Common Assessment Framework; EFQM = European Foundation for Quality Management.
Table 2 presents cities in the Czech Republic that have managed to win the excellence award for using the tools used from 2005 to 2014.
Cities That Received an Excellence Award in the Use of Quality Management Tools in 2004–2014.
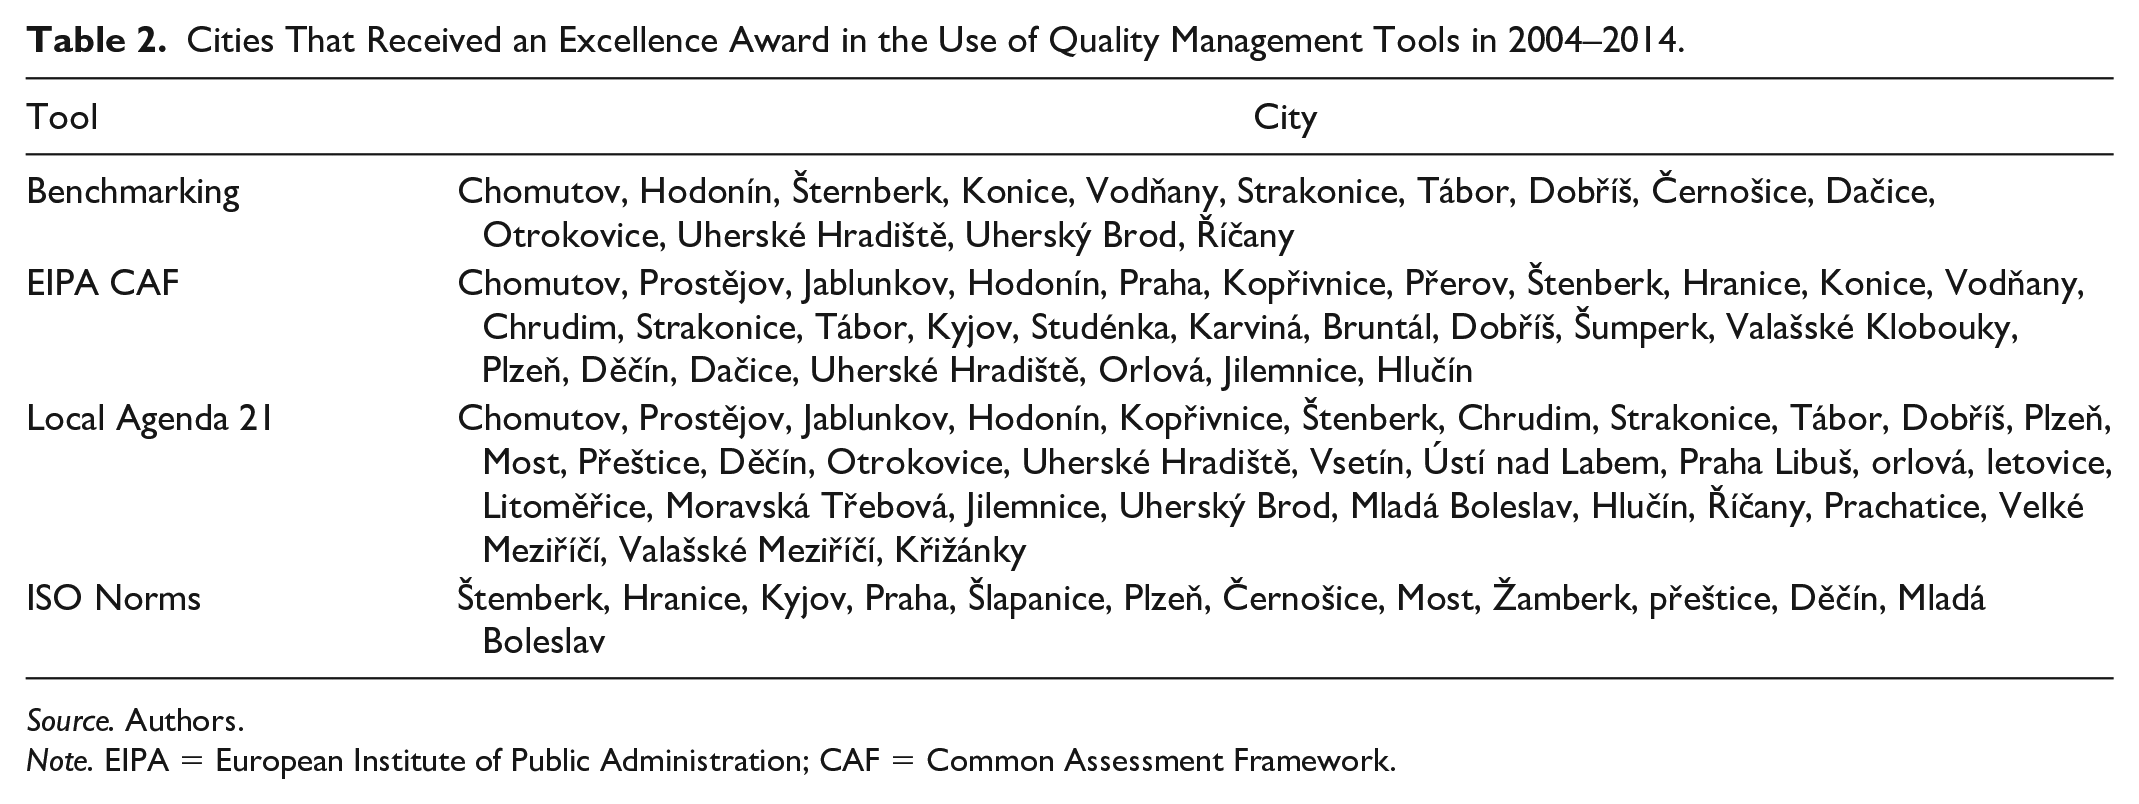
Source. Authors.
Note. EIPA = European Institute of Public Administration; CAF = Common Assessment Framework.
The next step in performance policy is an attempt to use nonparametric methods (DEA and FDH) for efficiency estimation and a comparison of municipalities. The project The utilization of non-parametric methods (DEA, FDH) for analysis and comparison of municipalities started in 2018. The project was produced by a consortium of universities under the guarantorship of the Ministry of Interior. The project was established as an applied research project and was financed by the Czech Technological Agency. The project schedule started with a literature review to find the appropriate input and output indicators. In addition, the project team produced the classification of local governments according their population size and delegated competencies. These two criteria were necessary to be applied to resolve the issues of spillover effects. Meanwhile, the project team also started to prepare the web application that should be used by the Ministry of Interior for performance assessment.
The strategy of the project team was to estimate global efficiency and particular service delivery efficiency. The biggest issue facing the project was the data availability for establishing inputs and outputs. One part of the required data was available from public databases, but the other part of data was available only upon request from particular public authorities. The partial output was provided via an application called WebDear (WebDEAr.fd.cvut.cz). Hammerníková et al. (2020) provided a detailed description of the technical details.
The application contains data that should not be publicly available, and users must log in to the application. The application is based on two modules. The first module provides information about local governments, whereas the second module delivers efficiency estimations. The local government information module provides information about the name of municipalities, the identification code of municipalities, the types of competencies of the municipality, the geographical location, and the region. Financial and statistical data are also available for each local government. The module calculation shows an efficiency estimation according to particular services: libraries, roads, municipal police, and schools.
Table 3 shows sets of inputs and outputs for particular services established by the research team.
Sets of Inputs and Outputs for Efficiency Estimation.

Source. Hammerníková et al. (2020).
It is possible to display partial data for a specific municipality or for all municipalities that could be calculated. The applications allow you to perform estimation for selected sample of municipalities and to use anonymous municipalities for a benchmark.
Method
Nonparametric Analysis
The use of DEA, FDH, and Order-M methods for efficiency analysis, including complex specifications of these methods, has been addressed by a large number of articles. However, very few articles use more than one of these methods to estimate efficiency (Narbón-Perpiňa and De Vitte, 2018a, b). Aiello et al. (2017) state that the chosen method for estimating efficiency may influence the final results. For this article, the following nonparametric efficiency estimation methods were used: DEA (Banker et al., 1984; Charnes et al., 1978) in a variant with fixed and variable returns of scale, FDH (Deprins et al., 1984), and Order-M (Cazals et al., 2002). Due to the aims of the article, it will be confined to a general comparison of these nonparametric analysis methods presented in the following table.
The basic intuition of the input-based DEA assuming fixed yields from a range is described as follows:
Fixed yield model:

The DEA model for variable yields from a range can be described as follows:

The DH method (Deprins et al., 1984) can be written as follows:

Order-M (Cazals et al., 2002) is based on the FDH approach.
M samples are randomly selected. For each, pseudo-FDH efficiency
Order-M efficiency is then determined by

The specification of these methods and their application for efficiency analysis are a part of many scientific papers for example, Narbón-Perpina (2017), Aiello et al. (2017), Narbón-Perpiňa and De Witte (2018a, 2018b), Emrouznejad and Yang (2018), Walker et al. (2018), Zheng et al. (2018), Wang and Geng (2017), Perez-Lopez et al. (2018) and Galariotis et al. (2016).
Design of Inputs and Outputs for Efficiency Analysis
Our research strategy for determining the inputs and outputs for efficiency analysis are described in Scheme 1.

Research strategy for determining input and output efficiency indicators.
First, we started with a legal analysis to identify the key public services delivered by Czech municipalities. We continued with a literature review which helped us collect the list of all possible input and output indicators which could be used in an efficiency analysis. After this, we tried to identify the possible data sources for input and output indicators. We focused on a publicly available database which allowed us to download all the necessary data for the time period. The last stage of our research strategy was a Delphi panel. The Delphi panel established a country-specific set of input and output indicators based on the previous stages of our research strategy.
First, we started with determining the input indicators. In Table 4, we present the results for determining inputs.
Results for Determining Inputs.
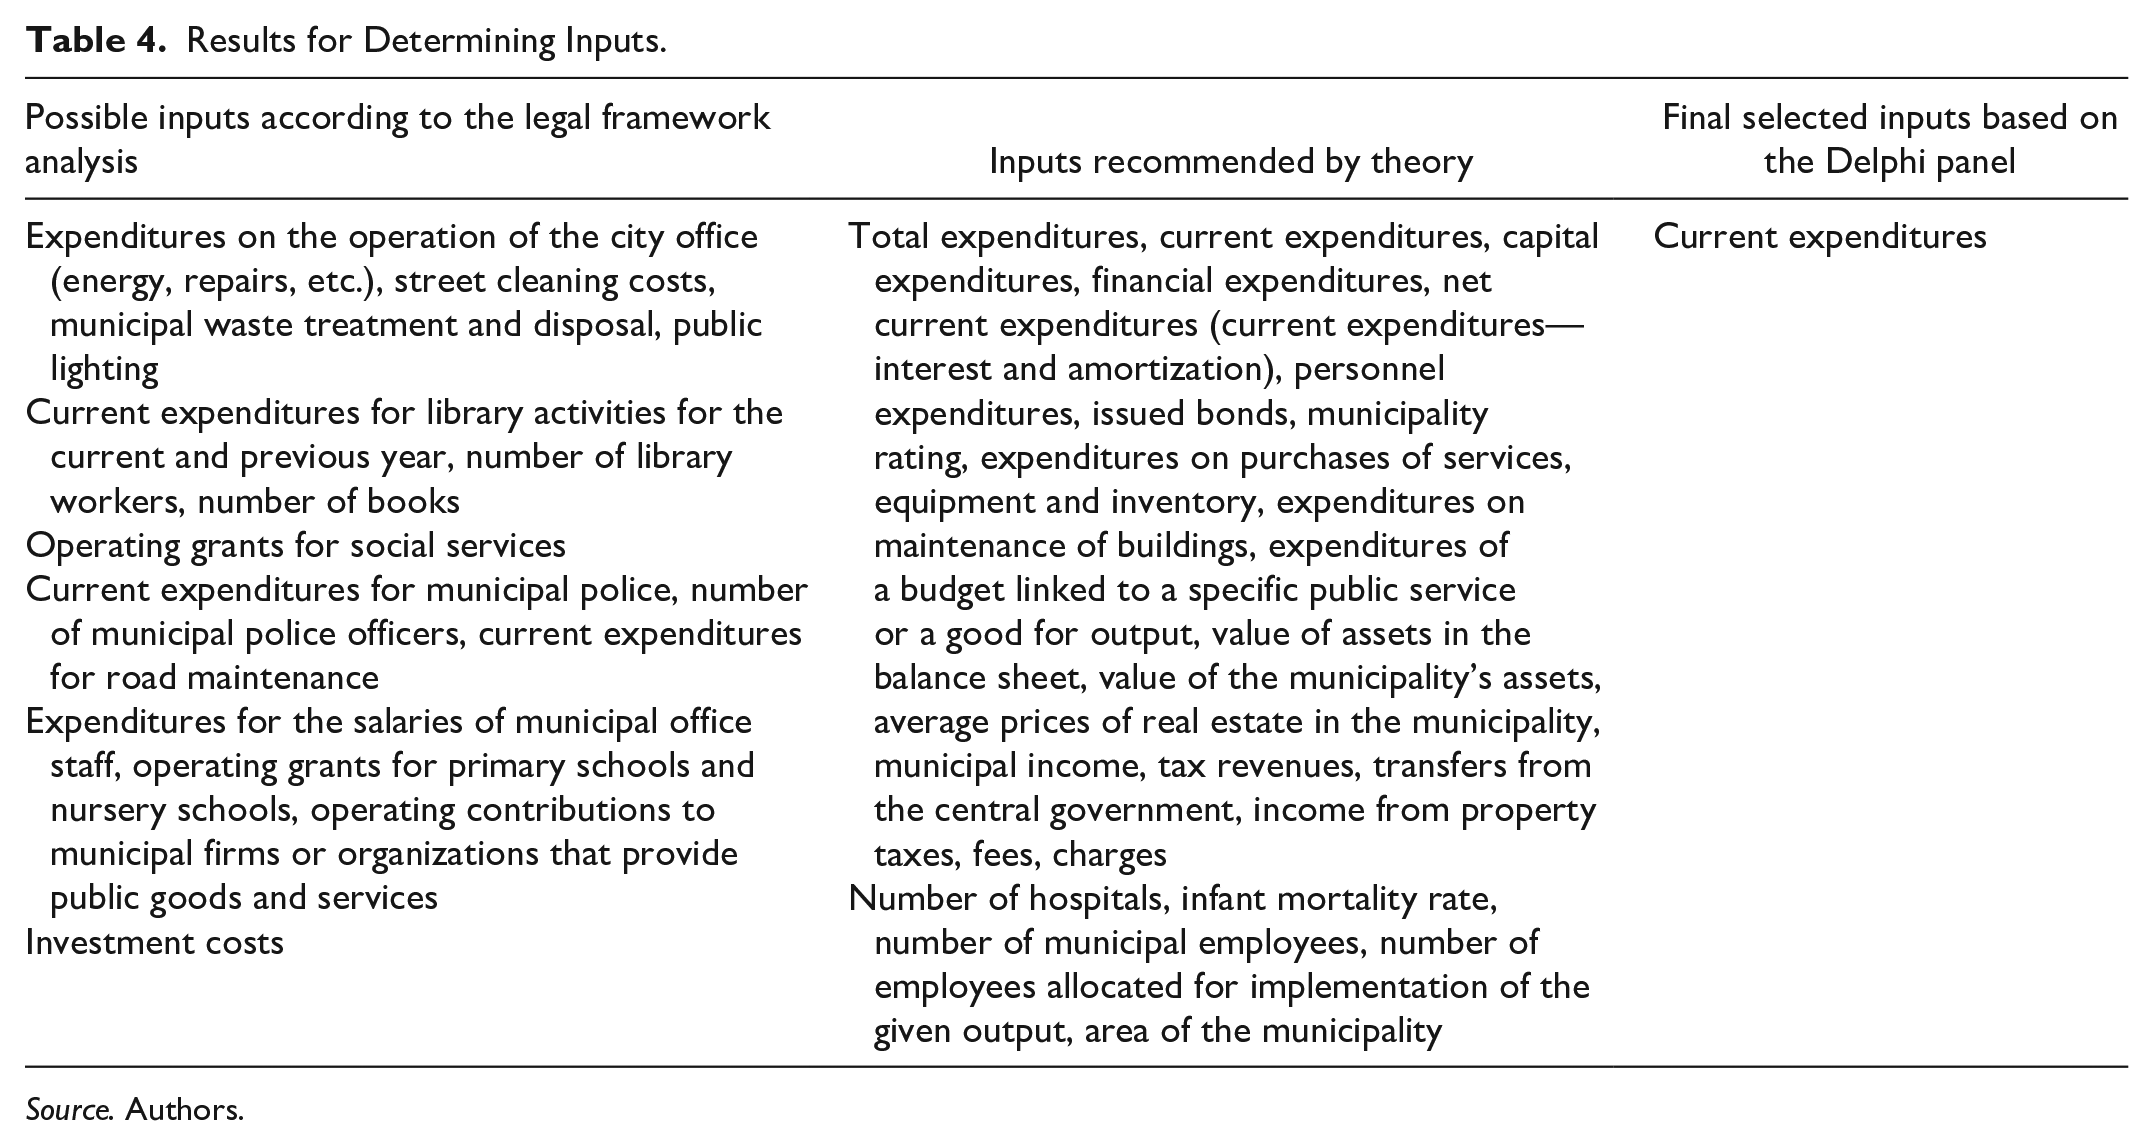
Source. Authors.
The final recommendation of the Delphi panel was to choose the current expenditures as the main input variable. This option has justification in the literature (Aiello et al., 2017; McQuestin et al., 2018; Narbón-Perpina et al., 2019) and was also applied in previous research dealing with the Czech Republic (Plaček et al., 2019). There are also legal arguments based on Act on Municipalities 182/200 Coll and Act about Financial Control 320/2001. All the mentioned laws insist that public money should be spent in a proper way and municipalities should apply the 3E principles to their spending. According to our data inspection of the Treasury Monitor Database of the Ministry of Finance, current spending is a major part of the municipal total expenditures. The current spending category expenditures are for the salaries of municipal office staff, expenditures on the operation of the city office (energy, repairs, etc.), street cleaning costs, municipal waste treatment and disposal, public lighting, operating grants for primary schools and nursery schools, social services, cultural expenditures, expenditures on building repairs, communications, and so on (Plaček et al., 2020a). The Delphi panel also discussed the issue of investment expenditures. We must point out that Czech public sector accounting is based on cash principles. This regime means that it is very difficult to estimate the effect of investment expenditures on local government efficiency. Increasing investment expenditures could be associated with higher efficiency over a long period, whereas, paradoxically, over a short period, it could lead to an association with lower efficiency.
After determining the input indicators, we continued establishing the sets of outputs, which is a more complex issue than the previous one (Štastná & Gregor, 2015; Walker et al., 2018). Following Table 5 present the results of establishing sets of outputs.
Establishing Sets of Outputs.

Source. Authors.
According to the recommendations of McQuestin et al. (2018) and lo Storto (2016), the Delphi panel focused special attention on the output side of indicator selection to reduce the complexity of municipal services delivered (Plaček et al., 2020a), to deal with the lack of available data (Plaček et al., 2020a), to avoid inconsistent results (lo Storto, 2016), and to eliminate the association with factors that cannot be influenced by municipalities. In this case, McQuestin et al. (2018) and lo Storto (2016) favor the argument for utilizing proxy variables as output indicators. “Proxy variables serve as an indirect approximation for the demand for public services and the data for them is more available” (Plaček et al., 2020a). Examples of proxy variables could be as follows: the population of the municipality, the size of the municipality, or the number of economic subjects. The main argument of Delphi panel in favor of proxy output variables instead of specifics variables describing outputs was the issue of data availability. The utilization of specifics variables was conditioned by obtaining data from several different sources which were not publicly available and were based on requests to specific ministries or state agencies. Some data were just not available. The shortcoming of this approach is that using proxy variables can lead to an overestimation of outputs (Drew et al., 2017). The Delphi panel considered utilizing the category of global output indicators and quality indexes which could be associated with the quality of public services or the quality of life in particular municipalities. Unfortunately, similar indices have never been constructed for all municipalities in a given time period in the Czech Republic.
Definition of the Control Group—Propensity Score Matching (PSM)
When comparing the efficiency of any subjects including municipalities, one should avoid the problem of selection bias. In this case, there can be observable and unobservable factors that may affect the outcome analyzed (like geography, population density, infrastructure etc.). One standard method that allows for the matching of subjects with similar controlling variables (covariates) is PSM. The basic idea of PSM is to match the subjects that are as similar as possible in covariates, that is, the factors that might influence the outcome and selection process (in our case, the excellence award). However, proper application of the PSM method relies on a quite strong assumption of conditional independence (CIA), also referred to as unconfoundedness (Lechner, 1999; Rosenbaum & Rubin, 1983). This assumption means that all covariates that can affect the outcome and selection process simultaneously are known to the researcher and are independent of the selection itself (Caliendo & Kopeinig, 2008; Khandker et al., 2010). It is truly a strong assumption, and fulfilling it depends mainly on the expertise of the researcher because it cannot be fully tested. It is strongly advised to use the covariates that are in line with theoretical and empirical research done so far (Caliendo & Kopeinig, 2008). Proper selection of covariates can be partially tested in bias after estimation. Although this test is not strong enough, it can serve as a basic lead—the bias should not exceed 5%. In this evaluation, covariates that were employed frequently in similar analyses are used and can have substantial effect on the outcome (average values between 2010 and 2017 were used):
Population in logarithm (population)
Population density (density)
Average age of inhabitants (age)
Share of productive population (aged 15–64 years) on total population (productpopul)
Share of tertiary-educated population (unedu)
Average growth rate of population (gpop)
It is quite clear that both samples—awarded and unawarded municipalities—differ substantially in several covariates, and it makes sense to check for such differences to compare comparable subjects. Obviously, awarded municipalities tend to be more populated with higher population densities and higher percentages of tertiary-educated inhabitants: The impact of the policy using the Single Difference (SD) method and the Difference in Differences (DID) method were evaluated. Single difference impact estimates compare the outcomes in the treatment group with the outcomes in the comparison group at a single point in time following the intervention. (White & Sabarwal, 2014, p. 11)
Difference-in-differences (DID) method, also known as the “double difference” method, compares the changes in outcome over time between treatment and comparison groups to estimate impact: DID gives a stronger impact estimate than single difference, which only compares the difference in outcomes between treatment and comparison groups following the intervention. Applying the DID method removes the difference in the outcome between treatment and comparison groups at the baseline. (White & Sabarwal, 2016, p. 11)
In our case, we calculate the single difference impact as follows:

We calculate the DID count as follows:

Data
To obtain the data, datamining, meaning the mining of a large volume of data from multiple sources, was used. In the first phase, the database of the Czech Statistical Office was selected, where demographic data and socioeconomic data from all 6,254 municipalities in the Czech Republic were obtained. There was a focus on obtaining these specific data:
Population
The size of the village
Population density
Educational structure of the population of the municipality
The age structure of the municipality population
The growth rate of the population
Number of business entities
These data were collected for the years 2010–2017. It serves as covariates for the quasi-experimental design. For nonparametric analysis, the application of the single difference impact method, and the DID analysis, data from the municipality were collected for the years 2002–2004 and for the years 2015–2017. To obtain information on current expenditures of municipalities in the Czech Republic, the Ministry of Finance’s database called Treasury Monitor (https://monitor.statnipokladna.cz/2018/) was used. This database contains the budgets of all municipalities according to the breakdown required by the Ministry of Finance decree and also the balance sheet, profit and loss account, and selected indicators of financial analysis. Data were collected from the database for the years 2010–2017. Unfortunately, the data for the years 2002–2004 were not available in public databases, so the database of the nonprofit organization Budget of the municipality, which obtained its data from the Ministry of Finance and subsequently made it available to the public, was used.
Results and Discussion
In the section, the results of the quasi-experiment will be presented. This will assist in finding the appropriate control group to evaluate the public policy outcomes to achieve excellence.
Results of the Quasi-Experimental Design
When PSM is applied, one starts with logistic regression (robust SE) with covariates as independent variables. Table 6 shows the results.
Basic Description of Covariates According to Awarded Excellence (Implement=1) or No Excellence (Implement=0).

Source. Authors.
As indicated, municipalities with higher populations and tertiary-educated inhabitants tend to be awarded more often. The next step is the calculation of scores and matching. The nearest neighbor (NN) method is used with four neighbors. This method yielded the best bias reduction and also the well-defined region of common support, where scores in both groups overlap. Table 7 shows the bias reduction, which was substantial—after matching, the mean bias accounts only for 3.8%, being well below the 5% limit. The bias reduction procedure is shown in the Table 8.
Results of Quasi-Experimental Design.

Source. Authors.
The Bias Reduction.

Source. Authors.
If B > 25%, R outside [0.5; 2].
Figure 1 illustrates the common support region.
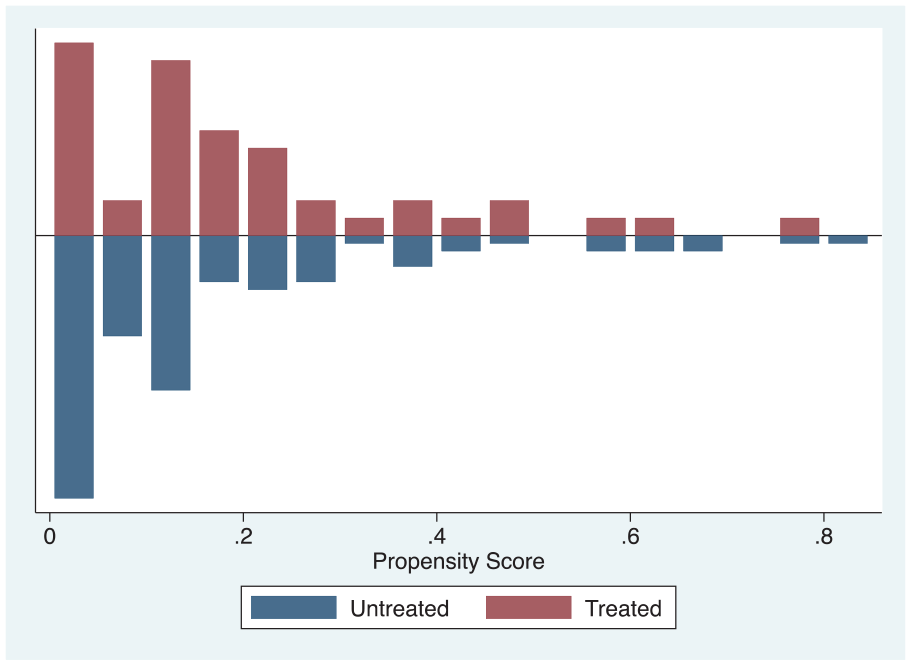
Common support region.
As part of the previous procedure, it was possible to identify a control group of municipalities, which can be compared with the awarded municipalities. Figure 1 shows that by having two similar groups of municipalities, it is now possible to apply the nonparametric procedures to estimate the efficiency.
Efficiency Policy Assessment
Table 9 shows the results of the assessment of the average efficiency of the awarded and unawarded municipalities in years (2014–2017) according to DEA with constant and variable yields on the scale, FDH, and Order-M.
Average Values of Efficiency of Awarded and Unawarded Municipalities and Policy Assessment by the Single Difference (SD) Method.

Source. Authors.
Note. DEA = data envelopment analysis; FDH = free disposal hull.
It is clear from the table that if we evaluate the impact of the public policy of the excellence value through the single difference method, this policy does not have a positive impact on the efficiency of the awarded municipalities. It is also clear from the table that the resulting efficiency varies according to the methods used, which is also reflected in the resulting single difference values.
Table 10 is public policy assessment using the DID method.
Average Efficiency of Awarded and Unawarded Municipalities and Policy Evaluation Using the DID Method.

Source. Authors.
Note. DID = difference in difference; DEA = data envelopment analysis; FDH = free disposal hull.
It is clear from the table that when using the DID method, the positive effect of the excellence award policy can be observed. It is also clear from the table that the resulting efficiency varies according to the methods used, which is also reflected in the resulting value in the DID method.
Our results are contrary to previously published studies (Plaček et al., 2019, 2020b), which concluded that excellence awards have no positive associations with efficiency, but we must say that our study shows a very small difference between the awarded and unawarded cities. The difference between the mentioned studies also lies in the methodology for studies with nonpositive results deploying only DEA as the main method for efficiency estimation. Our study additionally deploys FDH and Order-M. The results for Order-M show the biggest positive difference in efficiency. Another difference lies in the selection output and input indicators. The studies (Plaček et al., 2019, 2020b) tried to work with an indicator describing the quality of life on the output side. Our approach was different as we expected that the efficiency itself is positively associated with the quality of life. Thi Thanh Tran and Dollery (2020) show the positive association between efficiency and citizen satisfaction.
As we stated in the introduction, similar research is very scarce, and current papers are obviously focused only on a particular quality management method, for example, ISO or CAF. Lamovsek and Klun (2020) evaluate the efficiency of biomedical laboratories and the changes in ISO quality standards. The results show that the use of the DEA method and the Malmquist index does not indicate an improvement in the technical efficiency of accredited laboratories, but the quality indicators indicate a higher quality of performed work (Lamovsek & Klun, 2020). Tomazevic et al. (2016) investigate the possibility of implementing the CAF to improve the operational results of a policy station in Slovenia. The analysis shows that the data envelopment analysis scores and the rankings vary significantly across the police stations. In general, most police stations in the country could attain better results by fully implementing the enablers suggested by the CAF model (Tomazevic et al., 2016).
One very interesting observation is the shift in efficiency between the surveyed periods, and the two groups of cities recorded a shift in efficiency compared with the period 2002–2004; the awarded cities saw more efficiency improvements. Still, it must be said that improvements over a period of more than 10 years were significantly lower than we expected. These results were also confirmed by Plaček et al. (2020), who investigate the effect of fiscal reforms on efficiency of local governments. According to their results, the drivers of improvement vary according to municipality size. With larger municipalities, the main driver of efficiency improvement was the optimum scale, whereas at smaller municipalities the main driver of productivity growth was the better management of resources (Plaček et al., 2020).
All results are confirmed by the conclusions (Aiello et al., 2017) that the use of DEA with variable yields with the scale reports higher efficiency than the use of DEA with constant yields from the scale. Using the FDH method brings higher reported results than the use of DEA.
Concluding Remarks
This article deals with the analysis of the impacts of the public policy of evaluating the excellence of Czech municipalities on the cost-effectiveness of Czech municipalities. For efficiency analysis, several parametric methods were used, including DEA with constant and variable yields from the scale, FDH, and Order-M. Using the quasi-experimental design, a control group of municipalities was sought, whose efficiency is compared with the efficiency of municipalities that have earned excellence awards multiple times.
According to theoretical assumptions, DEA with variable yields of scale and constant yields of scale, FDH, and Order-M reports different efficiency results that are reflected in the final evaluation of public policy effects using the single difference method and the DID method. Using the single difference method, excellence policy does not bring positive results based on the cost-efficiency of municipalities. Awarded municipalities are less efficient than the control group municipalities. Using the DID method returns the opposite results. However, the increase in efficiency is not significant.
The article brings new insights into several areas. First, it provides an optimal procedure for determining country-specific output indicators that are used in nonparametric efficiency analysis. In this case, the analysis of the literature and the creation of output indicators are recommended. It is then necessary to carry out a legal analysis of the duties and tasks of municipalities. In the last step, based on the Delphi brainstorming, indicators are assigned to each activity.
The article is also beneficial for real public policy. At first sight, the nonparametric efficiency measurement could be used as a very simple and effective accountability mechanism which could be used by policy makers and central governments to analyze particular policy results. It could also help citizens monitor and control their local governments. The efficiency result interval between 0 and 1 seems to be quite easy to interpret, and it could help to reduce information asymmetry connected with principal agent behavior. The problem is that we still have not developed the appropriate sets of inputs and outputs which are able to describe the complexity of local government activities. This could lead to very different results and implication. The existing official application WebDear allows us to assess the efficiency of just particular public services; this could be problematic for smaller municipalities which do not have, for example, municipal police. There is also a risk of political abuse from the application for efficiency analysis. Low efficiency could be interpreted as a reason for dismissing “inconvenient” officials. We would recommend using this tool just for internal managerial purposes and as a motivational tool for improvement.
The article also highlights the problematic availability of data for these analyses, for example, when data from multiple databases need to be used; it would be desirable to create a unified database that would pool the appropriate data.
Footnotes
Author Contributions
All authors were involved in the conceptualization, funding acquisition, methodology, project administration, and writing of the original draft. All authors contributed equally to this work.
Declaration of Conflicting Interests
The author(s) declared no potential conflicts of interest with respect to the research, authorship, and/or publication of this article.
Funding
The author(s) disclosed receipt of the following financial support for the research, authorship, and/or publication of this article: The paper was prepared within the project of the Czech Science Foundation (GA19-06020S).