
Abstract
One of the tenets of qualitative research is the emphasis and honoring of the participants’ own words as generative of meaning and knowledge; yet it is rare to hear the actual voices of the research participants in a presentation or in text. Qualitative research dissemination has relied on dense transcribed text; these “mountains of words” do not lend themselves to the space limitations of academic journals or condensed visual elements such as summary charts, tables, or graphs. Technological advancements have the potential to revolutionize dissemination efforts, especially for qualitative research. The use of audio clips in poster and oral presentations, as well as embedded within written manuscripts plays with the interstices between the research participants and the observer. Infograms are effective ways of conveying a story visually. We demonstrate how combining audio clips and infographics can be a unique hypermodal dissemination possibility for qualitative results.
Keywords
When social science researchers aim to interrogate social phenomena and explore a deeper understanding of human behavior, we often use qualitative research methodologies. Qualitative research encompasses a range of methodological approaches such as ethnography, phenomenology, grounded theory, narrative inquiry, participatory action research, and case studies, among others. In addition, qualitative research can involve a variety of data collection methods such as structured or semistructured interviews, focus groups, participant observation, nonparticipant observation, and content analysis. Paradigmatic differences influence researchers’ approaches to qualitative research and also may be reflected in how researchers choose to present their findings. Interpretive frameworks and philosophy in qualitative research recognize human experience as contextual within a social time and place, and inseparable from the historical-personal lens of the researcher(s) (Creswell, 2007). As such, the positionality and subjectivity of the researcher(s) and the participants simultaneously shape the epistemological process, sometimes obfuscating the notion of voice in the presentation of the data and results. This article describes our creative process as we grappled with the representation of voice in presenting our qualitative research results.
The applicability and impact of qualitative research within the scientific community and in a greater social context is dependent on effective dissemination of the findings. Knowledge sharing is an integral component of the research process; without it, the potentiality of the research findings to effect change or benefit others is less probable. Furthermore, the scientific community generally purports that researchers have an ethical obligation to disseminate their research to appropriate audiences (Corbin & Strauss, 2008). As such, researchers must envisage the optimal processes and techniques for translating data into understandable, consumable modes of representation for audiences to digest. The ability to effectively communicate complex ideas is critical to facilitate comprehension and eventual utility of the research findings or translation into practice. Researchers should strive to demonstrate how the data are meaningful, appeal to various audiences, and engage stakeholders in the relevance of the research.
Qualitative researchers face distinct challenges in synthesizing and publishing their work. Unlike quantitative research, qualitative research often relies on dense transcribed text; these “mountains of words” do not lend themselves to the space limitations of academic journals or condensed visual elements such as summary charts, tables, or graphs (Johnson, Dunlap, & Benoit, 2010). To maintain the depth and richness of the findings and to demonstrate the quality of the data, the presentation of qualitative results often requires detailed contextual and methodological description. The use of quotations, presented as text, serve to exemplify the researchers’ interpretation of the data as findings. In today’s fast-paced world, presenting qualitative research succinctly and clearly is becoming more important and necessary than ever and requires new approaches and modalities beyond text. In this article, we emphasize the importance of voice in qualitative research and consider new possibilities of audio-enhanced dissemination. We also imagine a hypermodal space where sound is integrated with innovative data visualization elements.
Voice: Two Sides of the Same Coin
Most modern qualitative researchers subscribe to postpositivist philosophies such as constructivist or postmodern philosophical approaches to research (Creswell, 2007; Gilgun, 2005). Qualitative researchers consider how to best represent the voices of their participants while acknowledging their own position in the epistemological process. The importance of narrative voice in qualitative research dissemination is evident in the author’s decision to write in first person or third person. First person case acknowledges the researcher’s positionality and role in the process, and ideally minimizes the privileging of a single “objective” voice that silences the voice of others. Third person case is a more traditional approach in the hard sciences and is intended to express a sense of epistemological objectivity and distance the researcher from the participants. Feminist and postmodern scholars (see Clarke, 2003; Haraway, 1988; Harding, 1993; Hooks, 1990) have long advocated for scientists and researchers to identify and reveal their particular locations, or “standpoints” in knowledge formation. These “situated knowledges” challenge the traditional scientific relativism that often drives quantitative biomedical research by offering the possibility of generating new approaches from the merging of multiple perspectives. Gilgun (2005) wrote, “many contemporary researchers believe that the materials researchers generate are co-constructions, representations of interactive processes between researchers and researched” (p. 258). Furthermore, she wrote, “The use of the first person and of direct quotes is a way of acknowledging that the voices of researchers and those whom we research are not the same yet are interconnected” (p. 259). This interpretive qualitative approach also offers a sense of transparency to the reader.
The emphasis and honoring of the participants’ own words as generative of meaning and knowledge is also critically important to include in writing and presenting qualitative research (the other side of the coin), yet it is rare to hear the actual voices of the research participants in dissemination efforts. Decisions about the representation of voice raise questions about the subjectivity of the “knower” and the process of sharing research findings. Negotiating the voice of the researcher with the voice of the participant in the dissemination process is an important part of qualitative research. Lincoln, Lynham, and Guba (2011) explained, “Today . . . voice can mean not only having a real researcher—and a researcher’s voice—in the text, but also letting research participants speak for themselves” (p. 123). Although the intention is to simultaneously blend the voice of the participants with that of the researcher, inevitably, the representations of voice in dissemination efforts are reflective of the positionality of the researcher, who ultimately has the power to make choices about what to include or not. Participatory action research offers perhaps a more egalitarian possibility but is not without its challenges as well.
Today, qualitative researchers are able to capture the voices of participants during data collection through recording technology such as tape recorders and, more recently, with digital voice recorders and mobile phones. Researchers often use audio and/or visual recording devices with common qualitative methods such as interviews, direct observation and participant observation, focus groups, and case studies. This type of audio recording technology facilitates the analytic process by enabling verbatim transcription of the verbal content and nonverbal elements into text and maintains the integrity of the data so that the researcher may repeatedly listen to the nuances of the vocal expression.
Although the use of audio, video, and other visual methods have become common in data collection procedures, innovation continues to broaden the availability of new approaches to qualitative research. For example, PhotoVoice integrates technology in an effort to create a space in which participants’ perspectives, particularly marginalized groups, can be expressed (Catalani & Minkler, 2010). Computer assisted qualitative data analysis software (CAQDAS) can accommodate audio and video files, which has transformed data analysis. However, the inclusion of visual and audio elements in dissemination efforts remains relatively untapped. The journal, Sociological Research Online, does support multimodal elements and has published articles that include photos and video that can be viewed by the “reader”; however, the editors note that despite the possibility of presenting research in innovative ways, authors do not take advantage of these possibilities frequently (Coomber & Letherby, 2012). We are interested in the potential for technological advancements and innovations in data representation and presentation to enhance qualitative research dissemination and the learning experience. We imagine that hypermodal dissemination efforts will integrate multiple and various modalities of communication and rely on thoughtful design and execution.
The Enhancing Audio Recorded Research (EARR) Model
We developed the EARR model (Figure 1; Chandler, Anstey, & Munro, et al., 2013) while working to integrate audio into a poster presentation of research findings from a study designed to identify the HIV prevention needs of Black college women. During poster design, we struggled with how to retain the emphasis and meaning of the words spoken by our participants during the focus groups but which seemed to dissipate on paper. For example, complex emotions about relationships with their parents, feelings of stigma, and generational attitudes about sex and communicating with partners were evidenced through the cadence of speech and expression shared. Feeling compelled to restore the richness of these women’s words, we explored possibilities for enabling our audience to experience the voices of our participants as we did during the focus group sessions.
Experiencing audio recorded research model (EARR model).
The impetus for the development of the EARR model was to more fully honor the voices of our research participants by enabling our audiences to experience the power of the data through listening to it with their own ears. Coupled with our interpretations of the data, analysis, and conclusions as researchers, the ability to experience the raw data in the form of audio has the potentiality to engage the audience with another dimension of the research. Although we typically include quotes from participants on posters or in oral presentations, we felt as though our findings would be better expressed by the exact words, inflection, and intonations of our participants. We applied the contextual model of learning as a framework to contextualize the process of disseminating research within the learning environment intended by the professional scientific conference setting (Chandler, Anstey, & Munro, et al., 2013; Falk & Dierking, 2000). Development of the EARR model emerged as we delved into the history of museum informatics, which has evolved from basic identifying labels to modern-day interactive audiovisual technologies that are intended to engage the visitor more wholly in the museum experience (Chandler, Anstey, & Munro, et al., 2013; Falk & Dierking, 2000; Marty & Burton Jones, 2008; Tallon & Walker, 2008). The EARR model illustrates the possibilities of integrating multisensory modalities into qualitative research dissemination as generative of new semiotic possibilities. King (2008) proposed that the human brain has evolved to develop, learn, and operate optimally in multisensory environments. More specifically, King suggests that the visual and auditory systems frequently work together to stimulate cognition. The EARR model facilitates a multisensory learning approach that pushes the boundaries of traditional research dissemination and invites new opportunities for critical analysis. A more detailed explanation of the history of museum informatics, ethical issues, and a theoretical approach specific to the proposed hypermodal medium as it relates to qualitative dissemination, and the development of the EARR model, is published elsewhere (Chandler, Anstey, & Munro, et al., 2013).
The qualitative HIV prevention study that informed the EARR model was approved by the study site’s institutional review board. We obtained consent/authorization from each participant, which permitted audio recording of focus group sessions, transcription of the digital media into text format, and clipping (90 s or less) of available audio files for use in dissemination of the findings.
Not all research is well suited to the inclusion of audio data in the dissemination of research findings, particularly when the potential for voice recognition to remove anonymity could be harmful to the participants. However, several researchers have demonstrated the potentiality of removing anonymity to empower or enfranchise participants who may be marginalized, especially if there is an iterative, active role for the participant in the dissemination decisions and process (Fahmy & Pemberton, 2012; Pink & Mackley, 2012). For example, Fahmy and Pemberton (2012) described their use of video throughout the research process to empower marginalized groups and give them “voice” “within wider public debates and policy development.” They suggested that Visual methods offer also one important means of overcoming the objectification of research subjects as disembodied textual and numeric data within the interpretation and subsequent dissemination of findings. The visual representation of subjects’ perspectives within their natural setting can provide for more holistic interpretations thereby enhancing the ecological validity of findings.
We contend that the inclusion of audio in dissemination of the findings has the potential to similarly enhance the validity of findings by respecting the identity of the participants and offering the audience additional insight into the interpretive, analytic process.
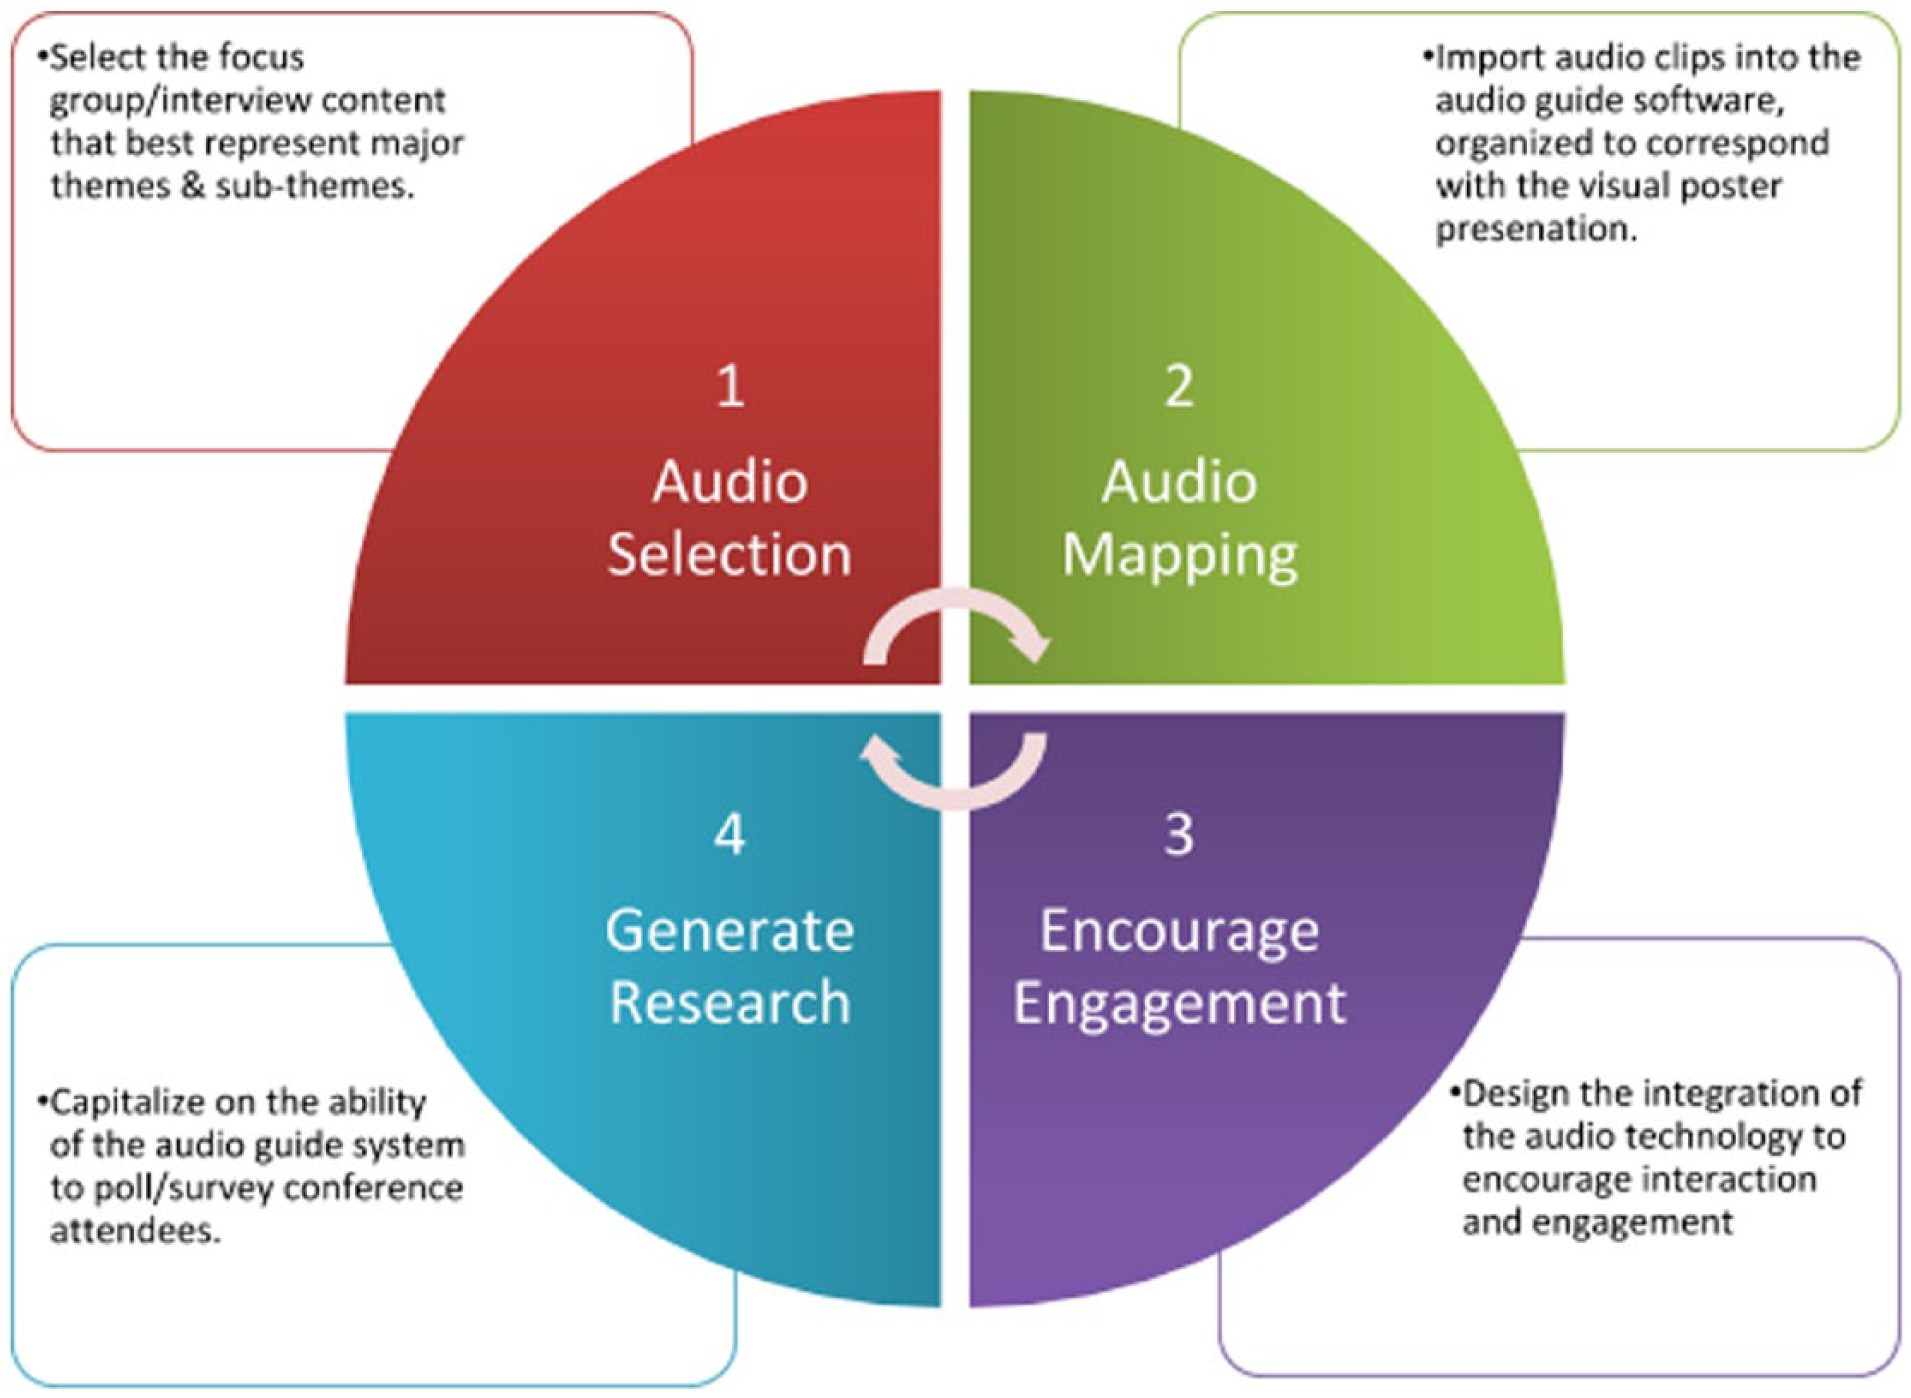
Incorporating an audio component to qualitative research dissemination has the potential to offer audiences a unique way to more fully engage with the data and reflect on the interpretations and analytic process of the researcher. In applying the EARR model in a poster presentation (see Figure 2), we were able to allow conference-goers the opportunity to listen to the voices of our participants. The steps of the EARR model in our pilot test were as follows:
We selected audio clips from our digitally recorded data files that best represented the thematic findings in a focus group study about the information, motivation, and behavioral skills (IMB) HIV prevention needs of Black college women attending two different universities in Florida.
We uploaded the audio clips into the Guide-by-Cell web-based software program. The audio files were then accessible via dial-by-number or quick response (QR) code. We printed the phone number and the QR code on the poster.
As conference attendees viewed our poster, we encouraged them to use their mobile devices to call the number or scan the QR code to listen to audio clips of our participants that represented particular themes. We also provided over-the-ear headphones to assist with hearing these clips in a loud conference environment.
We also encouraged our audience to respond to a poll about this audio-enhanced experience, which was also possible through the audio guide program (by calling or by QR code). Finally, we encouraged our audience to respond to the research and the audio-enhanced aspect of the presentation through recording their own perspectives.
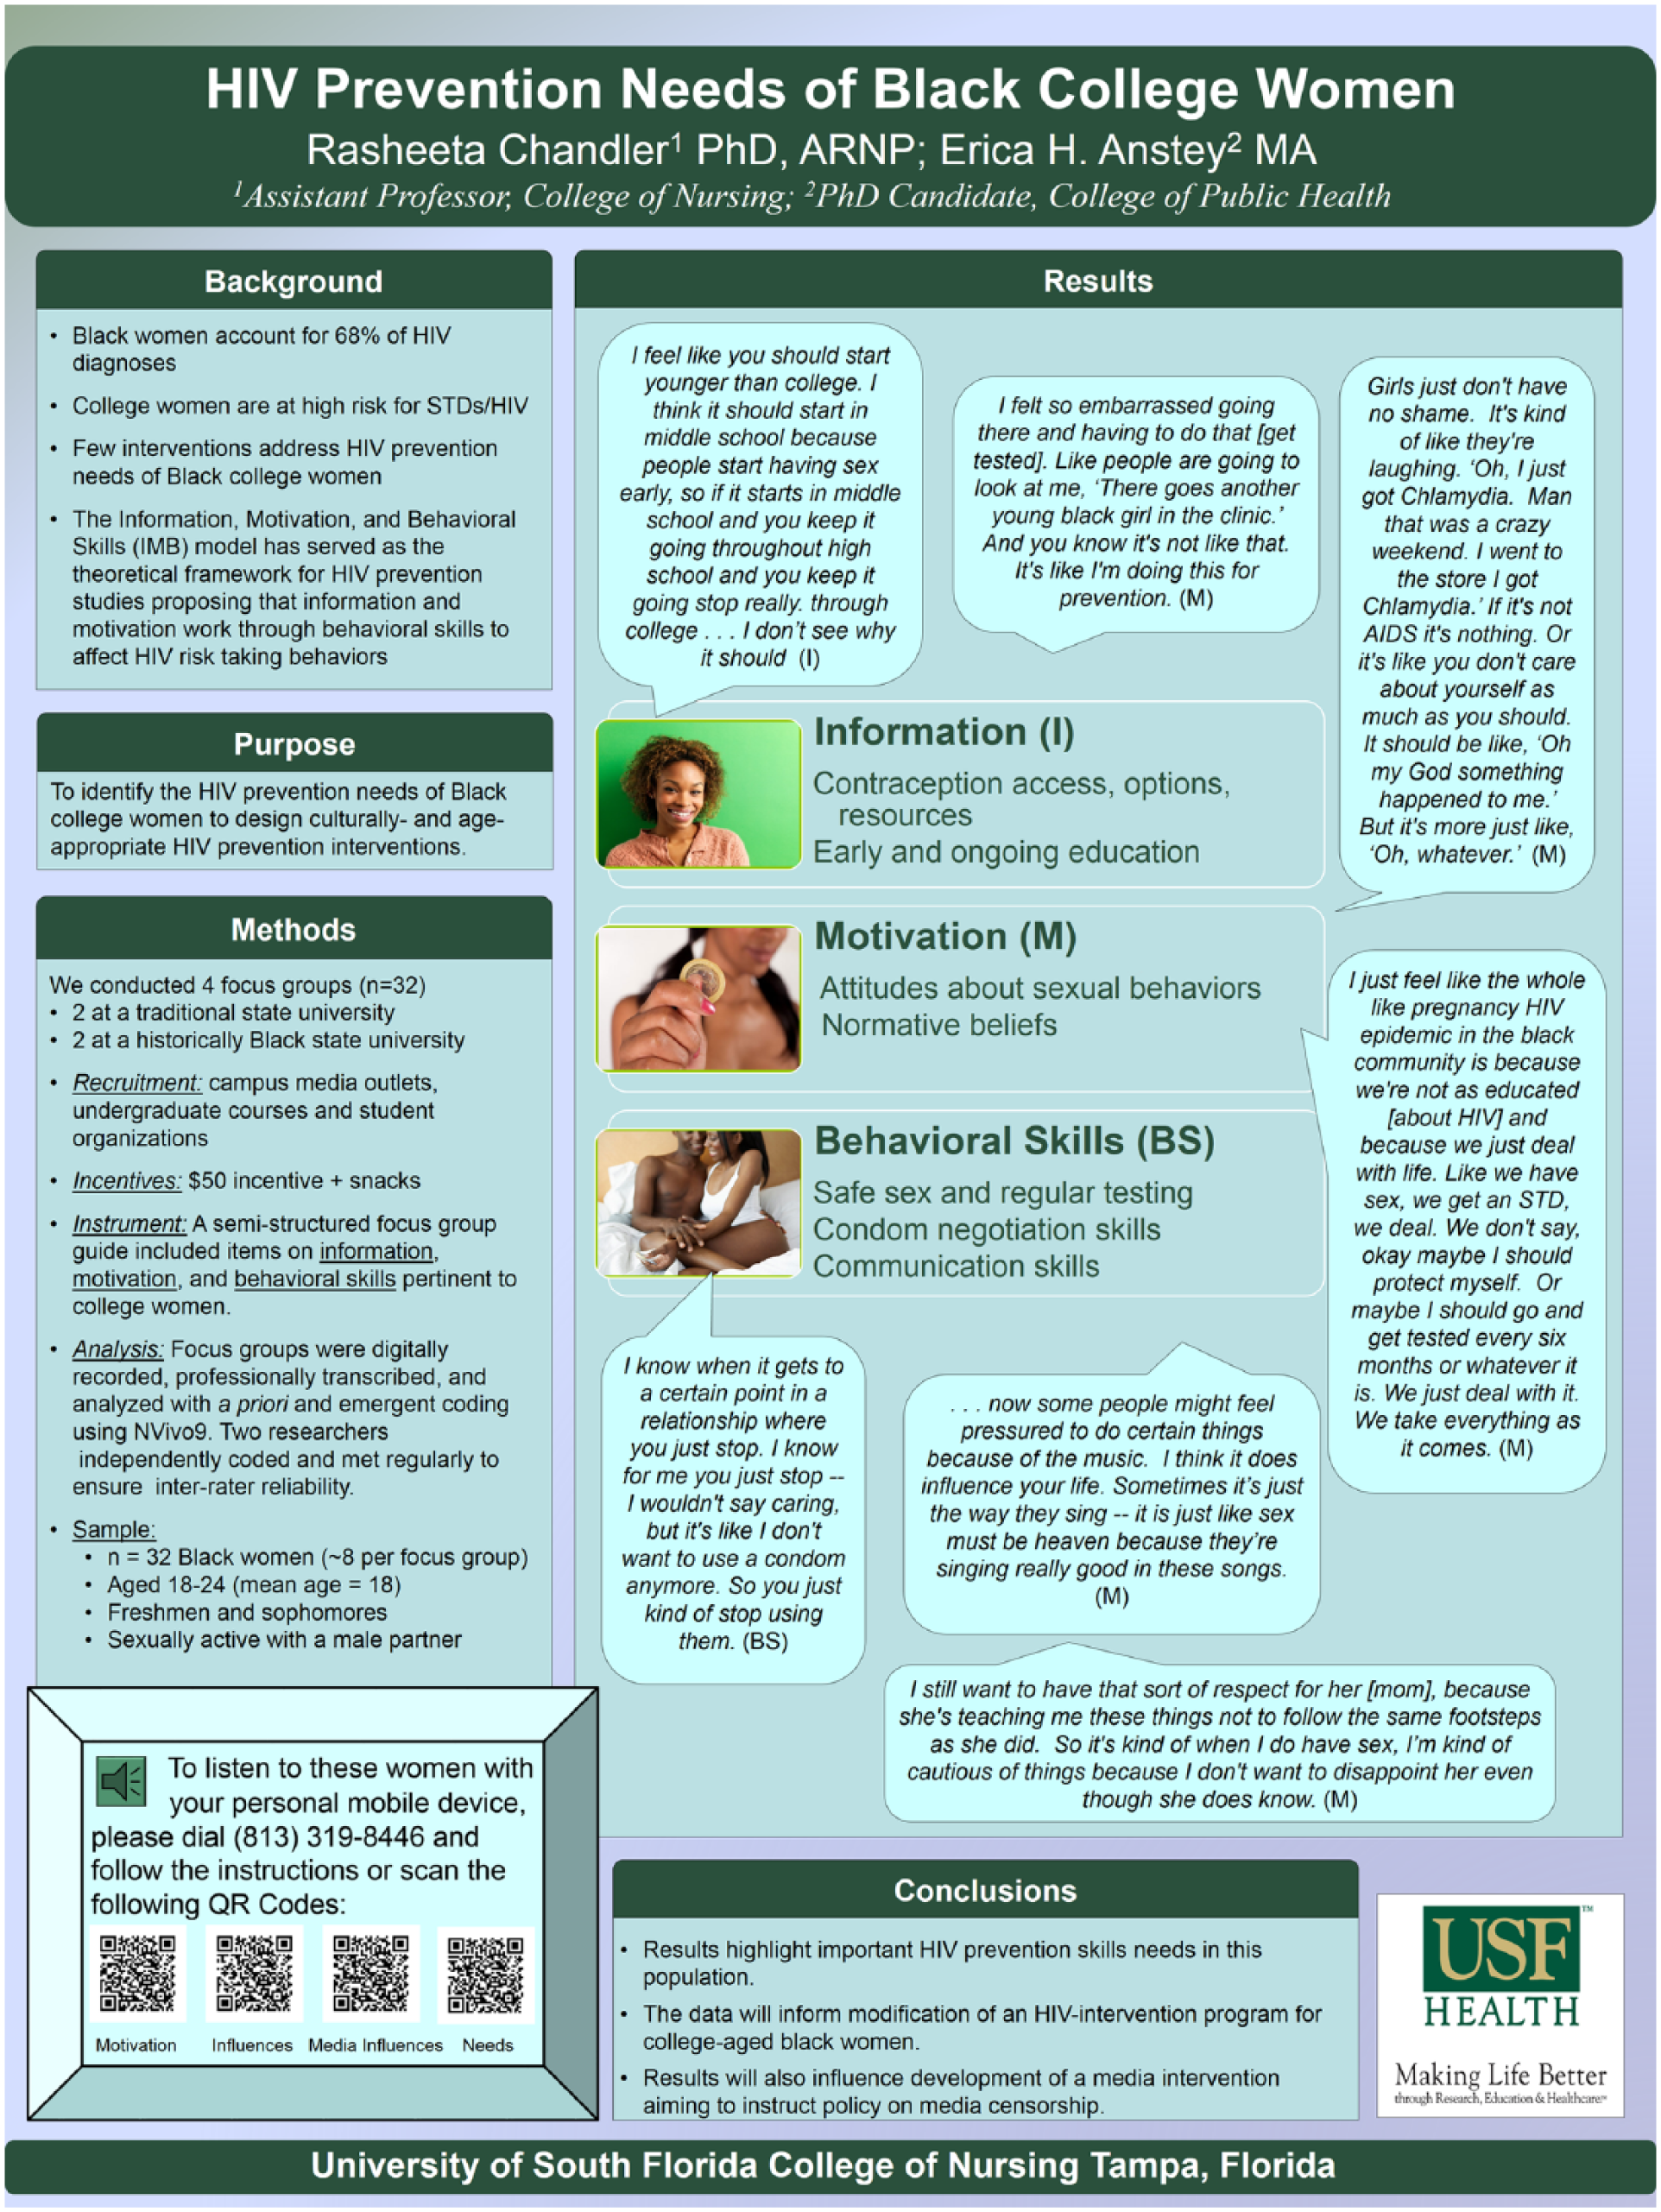
Poster presentation demonstrating EARR model concepts.
Our initial experience suggests that implementation of the EARR model enabled a deeper expression of the findings by revealing voice inflection, tone, and emotion that are often difficult to communicate through traditional dissemination channels. Furthermore, when audiences receive information in this way, they enter into the hermeneutic circle of interpretation alongside the researchers and the research participants.
Qualitative Data Visualization
In considering the integration of additional modalities to further push the boundaries of qualitative research dissemination, we also began to explore various methods of data visualization techniques. We typically think about data visualization in the context of quantitative (numerical) data that may be represented through a variety of visual options such as bar charts, graphs, scatterplots, tables, and pie charts, among others. These visual options serve to synthesize the findings in an easily interpretable manner. Data visualization of qualitative research has received minimal attention thus far (Sloan, 2009). Miles and Huberman (1994) were among the first to describe the importance of some visual data display methods (such as matrices and network displays) in qualitative research dissemination. More recently, representing qualitative data visually has received more attention as CAQDAS and other tools have facilitated this possibility. For example, tables and matrices, network mapping, word clouds, and word trees have become more common in qualitative dissemination efforts (Henderson & Segal, 2013; Verdinelli & Scagnoli, 2013). Sloan (2009) described the use of a device called “the Spectrum” to visually display qualitative information. This method is useful for displaying patterns in the data visually, but relies on the use of symbols or codes to represent the data and does not incorporate the words of participants. Verdinelli and Scagnoli (2013) studied the types of visual displays of qualitative data in published articles from three esteemed qualitative research journals across 3 years. Most common were matrices, networks, flowcharts, boxed displays, and modified Venn diagrams, followed by taxonomies, ladders, metaphorical visual displays, and decision tree modeling. These analytic display methods are useful for summarizing emerging theories from the data and primary thematic results.
Although these traditional methods of visualization are important for systematically displaying research findings, they typically exclude the voices of participants and may lack visual dynamism of the data. Our project then is to balance the need for structural methods designed to explain the research with the integral subtleties and emotive elements that are characteristic of some qualitative studies. Interactive data visualization techniques could be combined with other modalities to present a complex story in a dynamic and transparent way. According to Henderson, data visualization can be defined broadly as “communicating ideas or data using diagrams, images, graphs, maps, or some other kind of visual model with the goal/intention of increasing understanding.” And that last piece is important—the visualization has to be something that increases understanding, insight, or something else besides just being attractive or pretty. (Eliot, 2012)
Qualitative researchers should begin to explore the ways that we can present data such that the information is presented visually, yet the point is synthesized clearly and succinctly, but also honoring of the participants’ own voices.
Infographics, for example, have become a popular 21st-century trend used to display quantitative data. An infographic is a visual display of information that is presented in a way that communicates a compelling story about data. According to Lankow (2012), “Infographics provide a format that utilizes engaging visuals that not only appeal to an audience hungry for information, but also aid in the comprehension and retention of that material” (p. 12). In his book, Lankow defined “data” to be “quantifiable information” that is typically numerical. He outlined three elements of effective verbal/visual methods of communication:
Appeal: Communication should engage a voluntary audience.
Comprehension: Communication should effectively provide knowledge that enables a clear understanding of the information.
Retention: Communication should impart memorable knowledge.
However, because infographics are also about storytelling, they may lend themselves to qualitative data presentation. Infographics also have varying levels of complexity that can serve different needs. Krum (2014) outlined six different levels of infographics in order of increasing complexity: static, zooming, clicking, animated, video, and interactive, inspiring us to imagine endless exciting possibilities for disseminating qualitative research.
If a picture is worth a thousand words, what may emerge when we display a picture, juxtaposed with audio? Data visualization (such as infographics) plus audio could appeal to multiple types of learning modalities (linguistic and nonlinguistic) and ultimately enhance learning and understanding. We have been playing with different possibilities of blending visual and audio elements together in disseminating qualitative research. In the spirit of hypermodal exploration, we share our fledgling example (Figure 3) of our research findings.
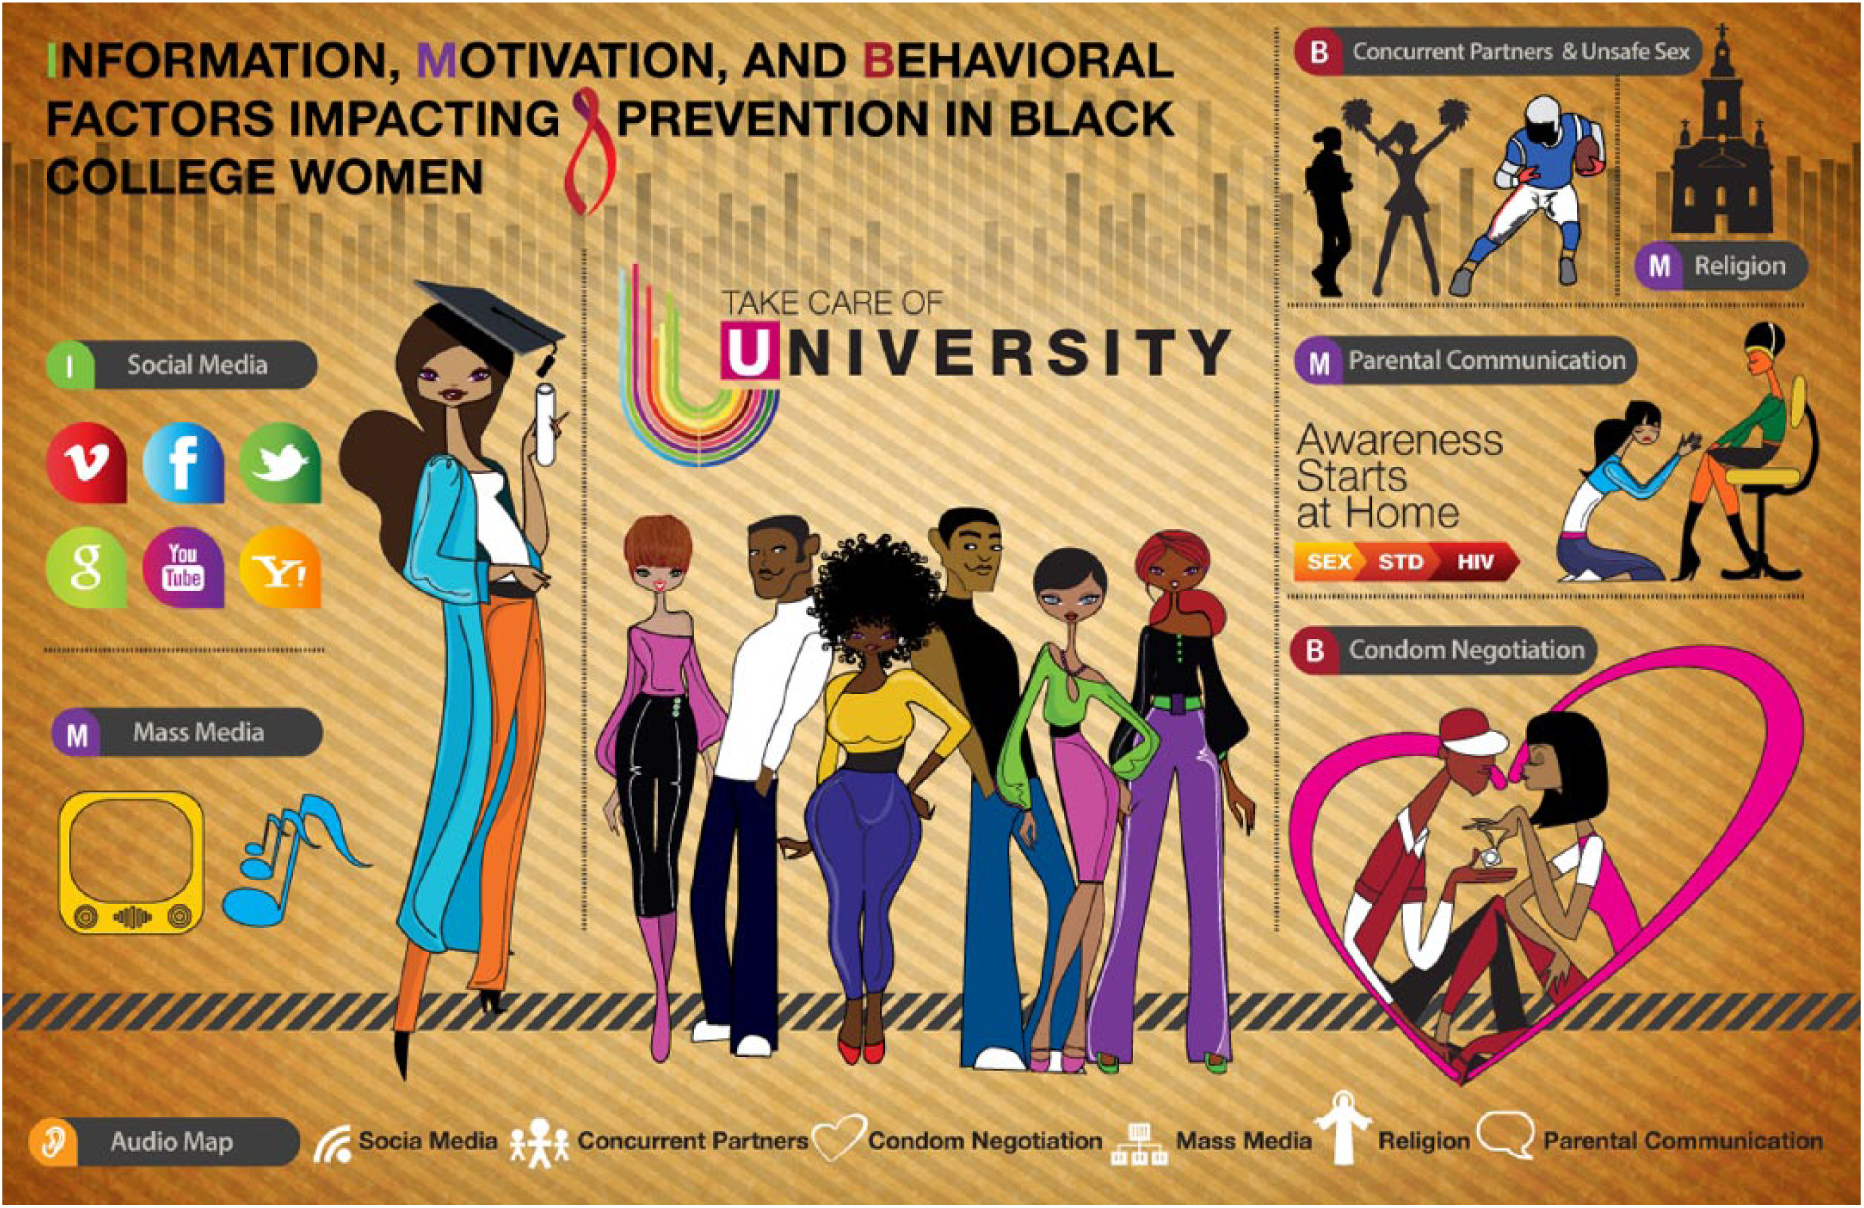
Exemplar infographic of research findings.
Our intention in designing this “qualitative infographic” was to explore how we might present a succinct synthesis of thematic findings while honoring the voices of our participants in an integrated way. The visual elements with captions display the main themes that were important in this study and the corresponding audio map enables the audience to listen to a summary of the findings and the words of the participants. The opportunity for active engagement with the data may motivate the audience to reflect on the nuances of meaning expressed by the participants and synthesized by the researchers, enhancing their learning experience. Pink and Mackley (2012) described the inclusion of video in presenting their research as a way “to offer an opportunity for viewers to develop a sensory embodied engagement with the materials and, as such, to use such familiarities and discrepancies as routes to emplaced knowing, imagining and forms of understanding.”(p. 12) Similarly, as this project develops, we aim to encourage “readers” to enter a multimodal context where you may engage with the research more wholly, invoking iterative, situated processes and leading to the coconstruction of meaning.
Throughout this project, we have been interested in exploring the possibilities of integrating audio technology and data visualization into qualitative research dissemination projects. The use of audio clips and data visualization in poster and oral presentations, as well as embedded within written manuscripts plays with the interstices between the research participants and the observer. What new knowledge is gained when we access and privilege the voices of research participants juxtaposed with text and visual elements? What new possibilities will emerge when the voices of our participants become liminal? Specifically, as “readers” of this article, how can you enter into the hypermodal space with us and become yet another modality in the epistemological process, thus adding a layer of complexity to the semiotics of this project through coconstruction.
In this “article,” we encourage you (the reader/listener) to actively engage with the audio map we have developed in the example above to experience the application of audio technology and listen to the voices that constitute data. We hope you will also take the opportunity to join the conversation about the use of this technology, thus entering into our hermeneutic circle and actively contributing to the exploration and evolution of hypermodal spaces in qualitative research. Future conversations might explore whether the (re)presentation of qualitative research through these new modalities destabilizes the construction of authoritative knowledge.
Footnotes
Declaration of Conflicting Interests
The author(s) declared no potential conflicts of interest with respect to the research, authorship, and/or publication of this article.
Funding
The author(s) received no financial support for the research and/or authorship of this article.