
Abstract
Recent police-involved deaths of Black civilians have sparked public outcry and demand for police reforms. However, many departmental policies intended to reduce the lethal use-of-force by police officers lack empirical support for their effectiveness. To address this shortcoming, a Bayesian random intercept model is used to forecast the effects of eight departmental policies on the number of police-involved civilian deaths across 66 police departments. Results suggest that although several policies are associated with a reduction in officer-involved deaths of civilians in some police departments, they are unlikely to eliminate officer-involved deaths completely. Specifically, we observed that introducing additional departmental policies would only reduce the number of officer-involved deaths by approximately 5 to 10. Moreover, variation in the baseline number of officer-involved deaths and the effectiveness of these policies existed between the 66 police departments. The results suggest that de-escalation training, ban on chokeholds, comprehensive reporting, restrictions on foot pursuit, restrictions on vehicle pursuit, community surveys, and problem-oriented policies could reduce the number of officer-involved civilian deaths. Nevertheless, variation in the number of police-involved deaths of civilians and differential effects of policies across agencies suggests a more tailored solution, and additional research is needed to address this crisis.
Introduction
Historically, Black communities and law enforcement have shared a strained relationship (Johnson, 2004). The use of aggressive crime control tactics in minority communities has resulted in a significant erosion of trust in, and perceptions of, police among Black Americans (Gau & Brunson, 2015). Over the past decade, the deaths of Black civilians during encounters with law enforcement have dominated news media and public discourse. On May 25, 2020, the tension between the police and Black communities reached a peak when George Floyd was killed by police officers in Minneapolis (Hill et al., 2020). Floyd's death, as well as the deaths of Breonna Taylor, Rayshard Brooks, and numerous others during encounters with police officers, prompted civil unrest across the United States (Kindy et al., 2020).
Public outcry has resulted in changes to police policies such as requiring body-worn cameras (Hyland, 2018), de-escalation training (Oliva et al., 2010), and implicit bias training (Hall et al., 2016). Roughly 86% of the American public supports some level of police reform (Politico, 2020). However, the evidence that proposed reforms will reduce the number of police-involved deaths is limited. Many of the proposed policies intended to curb the deaths of civilians by police remain unevaluated (Engel et al., 2020). In this context of uncertainty, we used a Bayesian random intercept model to forecast the effects of eight policies on the number of officer-involved deaths (OID) across 66 police departments.
Police-Involved Deaths of Civilians in the United States
Estimates of OID in the United States must be viewed in the context of the dataset from which the estimate was derived (Lozada & Nix, 2019). Much of the research on OID in recent years has been devoted to evaluating variation across those datasets. Official estimates of OID in the United States are maintained by the Federal Bureau of Investigation as part of the Supplementary Homicide Reports (SHRs), as well as by (1) the National Vital Statistics System and (2) the National Violent Death Reporting System (NVDRS). These data sources differ in terms of the types of incidents that are included in the data and the information about the incidents that are provided in the data. Thus, the estimates of OID across these sources vary widely—Barber and colleagues found that the NVDRS “captured more than twice the legal intervention deaths reported by SHRs and 71% more than reported by Vital Statistics” (2016, p. 925). Yet the NVDRS remains an incomplete database of OID, as it is missing cases captured by the database compiled by the Washington Post and FatalEncounters.com (Barber et al., 2016).
More comprehensive than the Washington Post database is the database compiled by Mapping Police Violence (MPV). The MPV data include all cases “where a person dies as a result of being shot, beaten, restrained, intentionally hit by a police vehicle, pepper sprayed, tasered, or otherwise harmed by police officers, whether on-duty or off-duty” (Sinyangwe et al., 2016). 1 The broad scope of the OID included in the MPV data has important implications for the methods and findings of the studies that use the data. For example, studies that use the MPV data to examine police killings of unarmed civilians might heed Lozada and Nix's (2019) warning that the MPV data codes civilians as unarmed if they were holding a toy weapon. These situations may be substantively different from incidents in which a person not holding any weapon (real or toy) and therefore should be coded separately.
Proposed Reforms to Reduce OID
The Task Force on 21st Century Policing (herein Task Force), established under the Obama administration, outlined a number of reforms designed to facilitate the development of more effective and equitable policing in the United States. Generally, the Task Force encouraged police agencies to promote community partnerships, reorient police strategy toward community/problem-oriented policing (POP), and incorporate training on a number of additional strategies expected to reduce police use-of-force and improve police-community relations. This includes training for de-escalation techniques, community-oriented policing, and POP. In addition, policies such as bans on chokeholds and strangleholds, requirements to issue warnings before discharging firearms, restrictions on vehicle pursuits, the implementation of the use-of-force continuum guidelines, duty to intervene requirements, and requirements for comprehensive reporting of use-of-force incidents has also been offered as solutions to police violence (President's Task Force on twenty-first Century Policing, 2015).
Community policing maintains that officers should view civilians as crime prevention partners who should be consulted about which crime problems require attention (President's Task Force on twenty-first Century Policing, 2015). POP encourages police officers to use problem-solving skills rather than law enforcement powers to reduce crime, which may attenuate aggressive and discriminatory practices (Goldstein, 1990). In addition to these recommendations, other policies offered by the Task Force entail reforms intended to address the use-of-force more directly. For example, de-escalation training, which involves using verbal tactics to diffuse potentially violent police-civilian encounters (Todak & James, 2018), is emphasized in the report. The Task Force also advocates for increased education requirements for police officers, because more educated officers have better communication skills, allowing them to diffuse situations using verbal rather than physical tactics (Rydberg & Terrill, 2010).
The report also indicates that police agencies should have clear use-of-force policies. These policies include rules and restrictions outlining the circumstances under which officers can use specific weapons or physical tactics. For example, the use-of-force continuum provides guidelines for the appropriate amount of force that can be used against civilians, depending on situational factors (Terrill & Paoline III, 2013). Some departments have implemented policies that require officers to intervene if a fellow officer is using excessive force (i.e., duty to intervene; Obasogie & Newman, 2017). Finally, the report recommends that police agencies make comprehensive reports on all use-of-force incidents available to the public.
Unfortunately, there is little evidence supporting the use of many of the policies the Task Force recommends (Engel et al., 2020). A recent systematic review of the effectiveness of de-escalation training could not locate a single study in which the technique had been empirically evaluated in a policing context, despite its widespread adoption and support among departments and the public (Engel et al., 2020). There are also no empirical evaluations of whether pursuit policies influence the use-of-force incidents (Alpert & Lum, 2014, p. 41). Nonetheless, some polices appear to have promising effects on the use-of-force. For example, research suggests officers use greater force against civilians when their employing agency has less restrictive use-of-force policies (Terrill & Paoline III, 2017). This suggests that when police departments maintain restrictive use-of-force policies, OID may be reduced. Still, the evidence for the effectiveness of many policies expected to reduce deadly force by police is generally limited. This study seeks to address this limitation by forecasting the effects of a number of police policies on OID.
Methods
Data and Sample
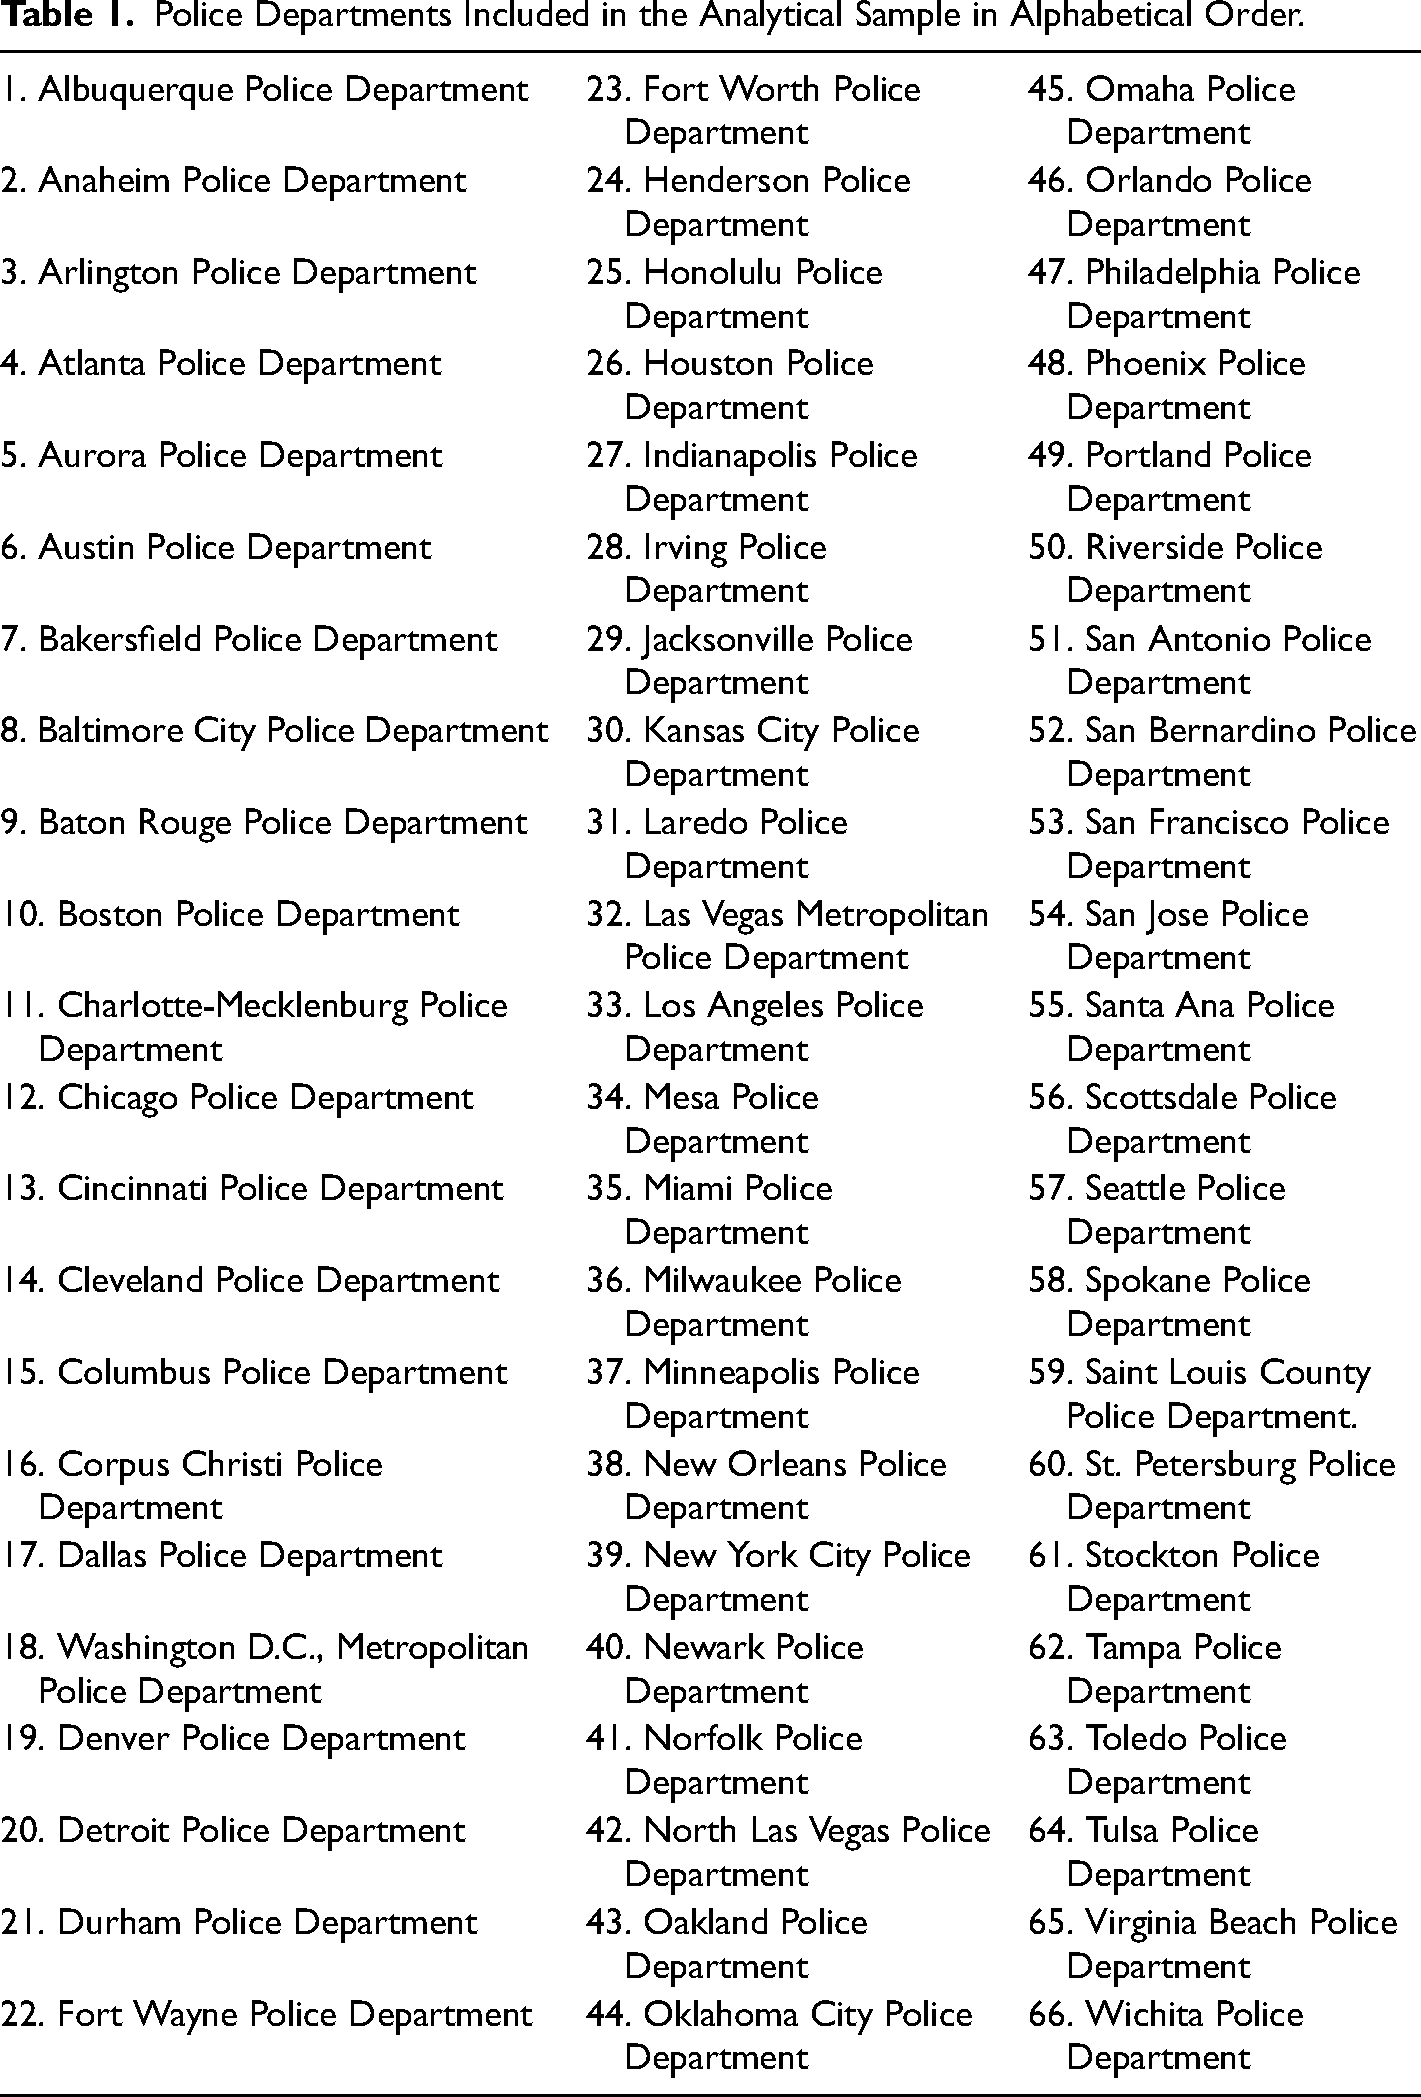
The primary data source for the current study was departmental policy information collected by Campaign Zero (Campaign Zero, 2016). Specifically, Campaign Zero sent Freedom of Information Act requests to the 100 largest police departments in the U.S. “requesting all current policies regarding police use of force” (2016, pg. 6). Ninety-four of the 100 police departments provided this information and three of those departments sent redacted policies and were excluded from the analysis, resulting in a final sample of 91 police departments (Campaign Zero, 2016). This dataset (N = 91) was then merged with key information from five different data sources: the 2013 to 2019 MPV, the 2013 Uniform Crime Report (UCR), the 2013 American Community Survey (ACS), the 2018 Cooperative Congressional Elections Study (CCES), and the 2013 Law Enforcement Management and Administrative Statistics (LEMAS) 2 . Listwise deletion of all variables, yielded an analytic sample of 66 police departments 3 (Table 1).
Police Departments Included in the Analytical Sample in Alphabetical Order.
To briefly describe the creation of the analytical sample, the Police use of Force Policy Analysis reported on the policies for 91 police departments implemented as of 2016. The MPV data, however, only captured OID for 78 police departments 4 . The MPV data do not indicate whether these departments were excluded for having zero OID from 2013–2019 or for systematic reasons. Aside from Pittsburgh, the departments not captured are in smaller metropolitan areas. The majority of the agencies not captured by the MPV are located on the East Coast, West Coast, or the Midwest, excluding Lincoln, Plano, and Lubbock. Of the remaining 78 departments, 12 were missing data on the covariates derived from the 2013 LEMAS 5 .
Dependent Variables
Three variables from the MPV served as dependent variables. First, total number of OID (2013–2019) is the total number of civilians that died during an incident by or with an officer associated with each department between 2013 and 2019. These included, but are not limited to, officers shooting civilians, civilians dying as a result of officer intervention, and civilians dying while fleeing officers. Second, total number of officer-involved Black deaths (2013–2019) is the total number of Black civilians that died during an incident by or with an officer between 2013 and 2019. Total number of officer-involved Hispanic deaths (2013–2019) is the total number of Hispanic civilians who died during an incident by or with an officer between 2013 and 2019. All OID from 2013–2019 collected by the MPV were used due to limited variation in OID incidents recorded by each department from 2016–2019.
Independent Variables
Eight police department policies derived from the PUFPA study conducted by Campaign Zero served as the primary independent variables for the current study. First, de-escalation training captures the police departments that require officers to receive training for de-escalating situations before using force. De-escalation training often entails learning verbal techniques to diffuse encounters with civilians where the use-of-force may be required which may reduce the likelihood that civilians are killed by police officers. For instance, training materials for the Arlington Police Department states: “An employee shall allow an individual time and opportunity to submit to verbal commands before force is used, if such de-escalation tactic may be used without compromising the safety of the employee or another and without resulting in the destruction of evidence, escape of a suspect, or commission of a crime. Whenever possible, the employee shall utilize de-escalation techniques and other reasonable alternatives for higher levels of force which are consistent with department training before the employee reasonably deploys actual and necessary force” (Arlington, Texas Police Department, 2020).
Second, use-of-force continuum identifies the departments with policies defining or limiting the type and amount of force that can be used in specific circumstances. Many departments explicitly prescribe the types of actions officers can take against civilians to gain compliance that is commensurate with the actions and level of resistance from the civilians. For instance, the Detroit Police Department describes a range of levels of resistance that officers may encounter from civilians followed by a list of acceptable forms of force that may be used if they experience a particular level of resistance (Detroit Police Department, 2020). This policy could reduce OID by limiting the degree of force officers may use in specific situations. Third, ban on chokeholds and strangle-holds classifies the police departments that ban chokeholds and strangle-holds. For example, the Boston Police Department's policy states, “A law enforcement officer shall not use a chokehold. A law enforcement officer shall not be trained to use a lateral vascular neck restraint, carotid restraint or other action that involves the placement of any part of law enforcement officer's body on or around a person's neck in a manner that limits the person's breathing or blood flow” (Boston Police Department, 2020).
Fourth, warning before shooting measures the departments requiring officers to give a verbal warning before using deadly force. The San Antonio Police Department policy states: “Unless there is a serious threat of serious harm officers shall, identify themselves as police officer and issue verbal warnings prior to using deadly force” (San Antonio Police Department, 2021). Fifth, restricts shooting at moving vehicle captures the departments that restrict officers from using deadly force against a vehicle unless the driver poses a deadly threat by means other than the vehicle. The Columbus Police Department manual states that: “Sworn personnel may fire a weapon at the driver or occupant of a moving vehicle or from a moving vehicle only when there is an articulable, reasonable belief that the subject poses an immediate threat of death or serious physical harm to him or herself or others” (Columbus Police Department, 2020). Sixth, exhaust all other means before shooting identifies the police departments that require police officers to exhaust all other reasonable alternatives before using deadly force. For example, the Newark Police Department states that “Police Division members shall de-escalate the use-of-force at the earliest opportunity and will make efforts to exhaust all other reasonable means available before resorting to the use-of-force, as long as the member's safety or that of other persons is not compromised” (Newark Police Department, 2018, p.2) 6 . Seventh, duty to intervene indicates the police departments that require officers to stop or intervene when other officers are using excessive force against a civilian. The Las Vegas Police Department policy states that “Any officer present and observing another officer using force that is clearly beyond what is objectively reasonable under the circumstances will, when in a safe position to do so, intercede to prevent the use of unreasonable force.” (Las Vegas Police Department, 2020, p. 5).
Finally, requires comprehensive reporting designates the police departments that require officers to report both uses of force and threats of force against civilians. For instance, The San Francisco Police Department requires that “Any reportable use of force shall be documented in detail in an incident report, supplemental incident report, or statement form” (San Francisco Police Department, 2021, p. 17). This policy might reduce the number of OID by holding officers who use force accountable and ensuring that their actions are reviewed by supervisors and consistent with their agency's policies. Each of these dependent variables was measured dichotomously, where “0” indicated that the police department did not have that policy as of 2016 and “1” indicated that the police department did have that policy as of 2016.
Control Variables
The estimates in the current study were adjusted through the inclusion of 17 control variables. Using the MPV data set, the location of the police department was used to indicate whether the police department was located in a rural or urban area as defined by the U.S. Census (“0” = Rural; “1” = Urban). The LEMAS data were used to create 10 of the 17 control variables 7 . Total number of officers represented the number of full-time or part-time sworn personnel. Male to female ratio of sworn officers captured the number of full-time or part-time male officers divided by the number of female officers. White to Black ratio of sworn officers (full-time) measured as the number of full-time White officers divided by the number of Black officers Educational requirements captured the minimum educational requirement for new officers. Educational requirements were coded where “0” = No Educational Requirements, “1” = High School Diploma, “2” = Associate Degree, “3” = Bachelor's Degree, and “4” = Master's degree. The ratio of budget to community population represents the ratio of expenditure to the population of the jurisdiction and was included to adjust for budget differences by the size of the community. The departmental budget was the total operating budget for the 12-month period between January 1, 2013 and December 31, 2013. Community policing training was a dichotomous indicator identifying police departments in which at least half of the sworn officers have completed 8 h of in-classroom and 8 h of in-service community policing training (“0” = No; “1” = Yes). Problem-oriented policing strategies identified the police departments that—during the 12-month period ending on December 31, 2012—encouraged patrol officers to engage in SARA problem-solving projects 8 . POP strategies were coded, where “0” represented that the department did not encourage officers to engage in problem-solving and “1” indicated that the department did encourage officers to engage in problem-solving.
Community survey was a dichotomous indicator identifying the police departments that—during the 12-month period ending December 31, 2012—conducted a survey of residents about crime, fear of crime, or satisfaction with law enforcement. Restrictions on vehicle pursuit captured the departmental policy on pursuing suspects with vehicle (“0” = permitted up to officer discretion; “1” permitted but restricted based upon circumstances, “2” permitted but restricted based upon circumstances and subject to review by superior officers). Restrictions on foot pursuit captured policies restricting when officers can pursue a suspect on foot (“0” = No written policies exist to restrict foot pursuit; “1” written policies exist to restrict foot pursuit).
The 2013 UCR captured the total number of violent crimes and the total number of property crimes reported by each police department in 2013. The 2013 ACS was used to capture estimated number of White residents and the estimated number of Black residents within the jurisdiction of each department. Additionally, the ratio of White to Black residents was used to adjust for the racial diversity of the jurisdiction. Finally, the 2018 CCES data captured state-level racial resentment scores. The aggregate state-level score on four CCES items captured racial resentment, and items were coded so that higher values indicate greater racial resentment 9 .
Analytical Strategy
First, descriptive statistics were produced. Second, to evaluate the effectiveness of the eight department policies on reducing OID, three random effects Bayesian models were estimated. Bayesian statistics are among the foremost strategies for estimating the potential effectiveness of criminal justice policies because of the ability to quantify the distribution of potential outcomes for each case in a sample (Gelman et al., 2013). 10 Specifically, Bayesian random effects models can generate expectations about the range of outcomes each case might experience under observed or unobserved conditions (West, 2020). Bayesian models provide the ability to (1) generate a potential range of OID each department should have expected to experience during the six-year period, (2) examine the reduction in OID in each department by implementing policies, and (3) compare the potential range of OID between departments. Thus, a more fluid interpretation of the effectiveness of policies on OID is made possible with a Bayesian random effects model compared to the false dichotomy created by p-values (Steenbergen, 2019).
For the current study, total number of OID, total number of officer-involved Black deaths, and total number of officer-involved Hispanic deaths (2013–2019) were each regressed on the independent and control variables using a random effects Bayesian model. The three Bayesian random effects models were estimated using a Gaussian distribution, random intercepts across police departments, a delta of .995, and five chains of 20000 iterations each (estimated with Monte Carlo Markov Chains). Due to the limited research on the association between departmental policies and OID, the default normally distributed priors with a slope of 0 and a standard error of 2.5 were used to estimate the model (Gelman et al., 2013).
Finally, the posteriors 11 were used to forecast a six-year estimate for the total number of OID, total number of officer-involved Black deaths, and total number of officer-involved Hispanic deaths for each police department. 12 After estimating the number of specified deaths for each department, if their policies remained as they were in 2016, the forecasts were replicated while altering the implementation status of each policy the department had not implemented by 2016. For example, if a department had not implemented de-escalation training as of 2016, the implementation status was altered to indicate that the police department had implemented de-escalation training. An overall forecast, where all nonimplemented policies were changed to implemented, was estimated as well. The forecasted total number of OID [six-year period], total number of officer-involved Black deaths [six-year period], and total number of officer-involved Hispanic deaths [six-year period]) for nine police departments are presented below, and the remaining 57 departments are shown in Figures S1–S57.
Results
Table 2 provides the descriptive statistics for the 66 police departments within the analytical sample. The average total number of OID from 2013–2019 for a department was 24, with the lowest total number of OID for a single department being 6 and the highest being 124. Concerning OID of Black and Hispanic civilians, there were an average of ten OID of Black civilians and an average of six OID of Hispanic civilians. Regarding the key policies, the majority of departments had implemented a use-of-force continuum (88%) and required a warning before shooting as of 2016 (62%), but fewer departments required de-escalation training, banned chokehold and strangleholds, restricted shooting at moving vehicles, required officers to exhaust all other means before shooting, required officers to have a duty to intervene, and had departmental policies related to comprehensive reporting of use-of-force incidents as of 2016. Table S5 lists the policies implemented by 2016 and all additional department characteristics.
Descriptive Statistics for the Analytical Sample.
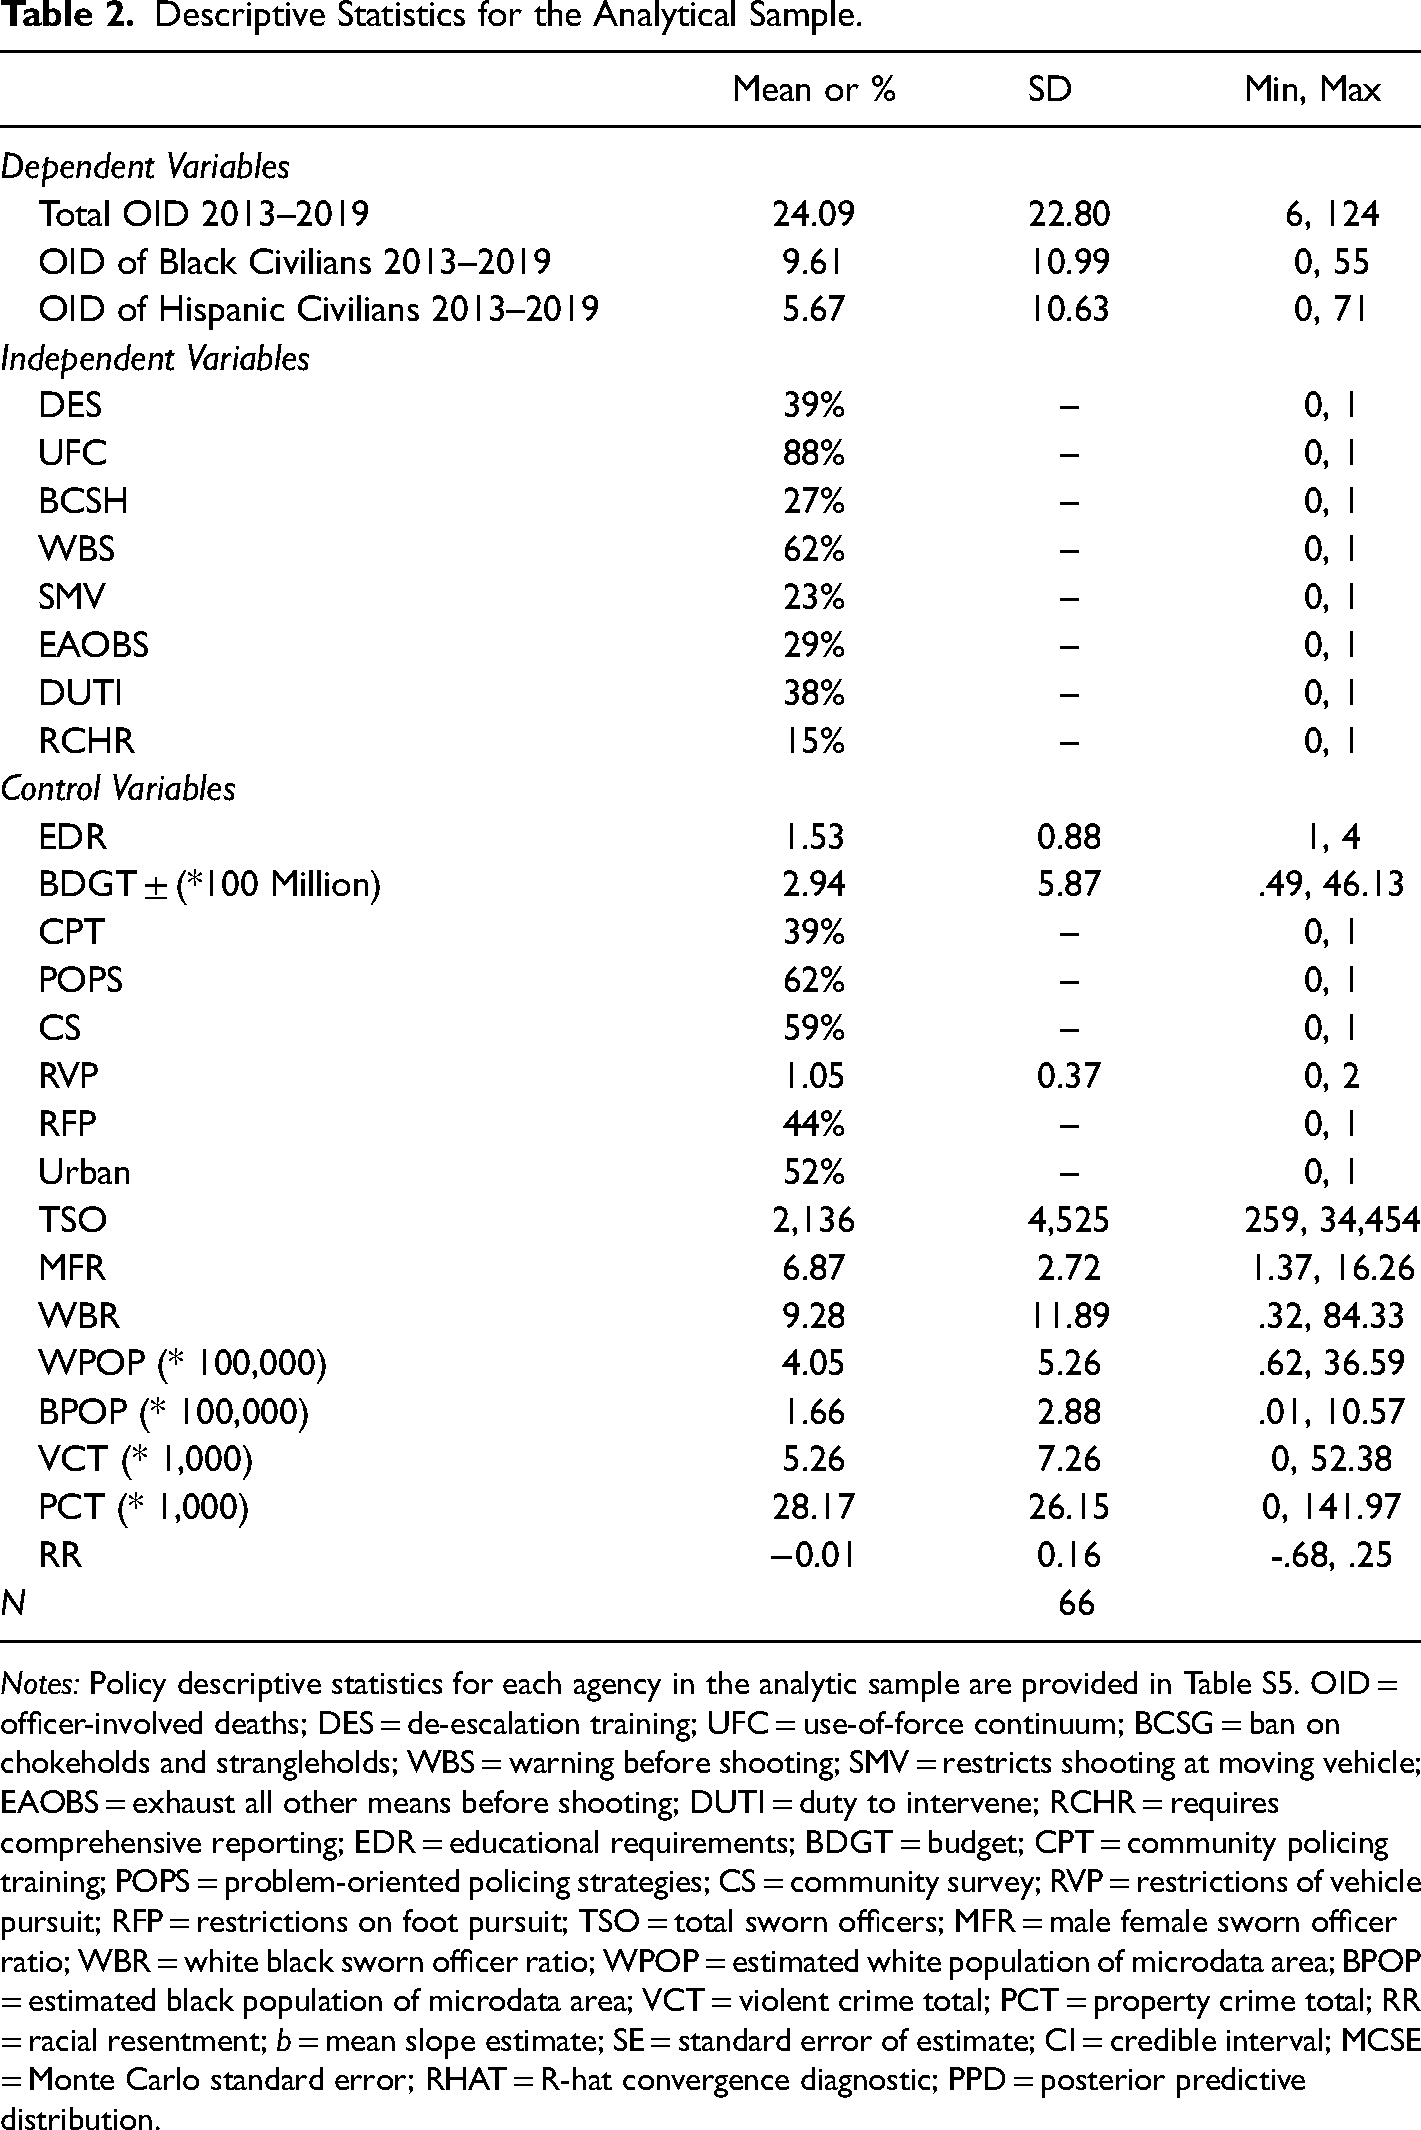
Notes: Policy descriptive statistics for each agency in the analytic sample are provided in Table S5. OID = officer-involved deaths; DES = de-escalation training; UFC = use-of-force continuum; BCSG = ban on chokeholds and strangleholds; WBS = warning before shooting; SMV = restricts shooting at moving vehicle; EAOBS = exhaust all other means before shooting; DUTI = duty to intervene; RCHR = requires comprehensive reporting; EDR = educational requirements; BDGT = budget; CPT = community policing training; POPS = problem-oriented policing strategies; CS = community survey; RVP = restrictions of vehicle pursuit; RFP = restrictions on foot pursuit; TSO = total sworn officers; MFR = male female sworn officer ratio; WBR = white black sworn officer ratio; WPOP = estimated white population of microdata area; BPOP = estimated black population of microdata area; VCT = violent crime total; PCT = property crime total; RR = racial resentment; b = mean slope estimate; SE = standard error of estimate; CI = credible interval; MCSE = Monte Carlo standard error; RHAT = R-hat convergence diagnostic; PPD = posterior predictive distribution.
The results of the Bayesian regression models (see Figures S1–S57) suggested that implementing de-escalation training (b = −5.89), implementing a ban on chokeholds and strangleholds (b = −.67), and requiring comprehensive reporting (b = −4.27) reduced the total number of OID (by approximately or greater than one OID over a six-year period). Concerning OID of Black civilians, regression models suggested that implementing de-escalation training (b = −2.95), implementing a ban on chokeholds and strangleholds (b = −2.66), and implementing duty to intervene policies (b = −.14) reduced the total number of OID. Implementing de-escalation training (b = −2.95), requiring warnings before shooting (b = −.49), restricting shooting at moving vehicles (b = −.26), and requiring comprehensive reporting of use-of-force incidents (b = −4.27) reduced the number of OID of Hispanic civilians. These results were then used to forecast OID of all civilians, Black civilians, and Hispanic civilians that each police department may experience if they implemented policies that reduced the number of OID by .5 or more (rounded up to one OID) that they had not yet implemented by 2016. 13
Figures 1–3 provide results of the forecasted number of OID for all civilians, Black civilians, and Hispanic civilians for nine of the 66 police departments in the analytic sample. 14 We selected these nine police departments based on (1) the size of the metropolitan population and (2) the geographical location of the department within the four U.S. Census Regions in order to present results across a range of different-sized jurisdictions across the country. Figures S1–S57 in the supplemental text provide the predicted number of OID for all civilians, Black civilians, and Hispanic civilians for departments in the analytic sample but not the main text.
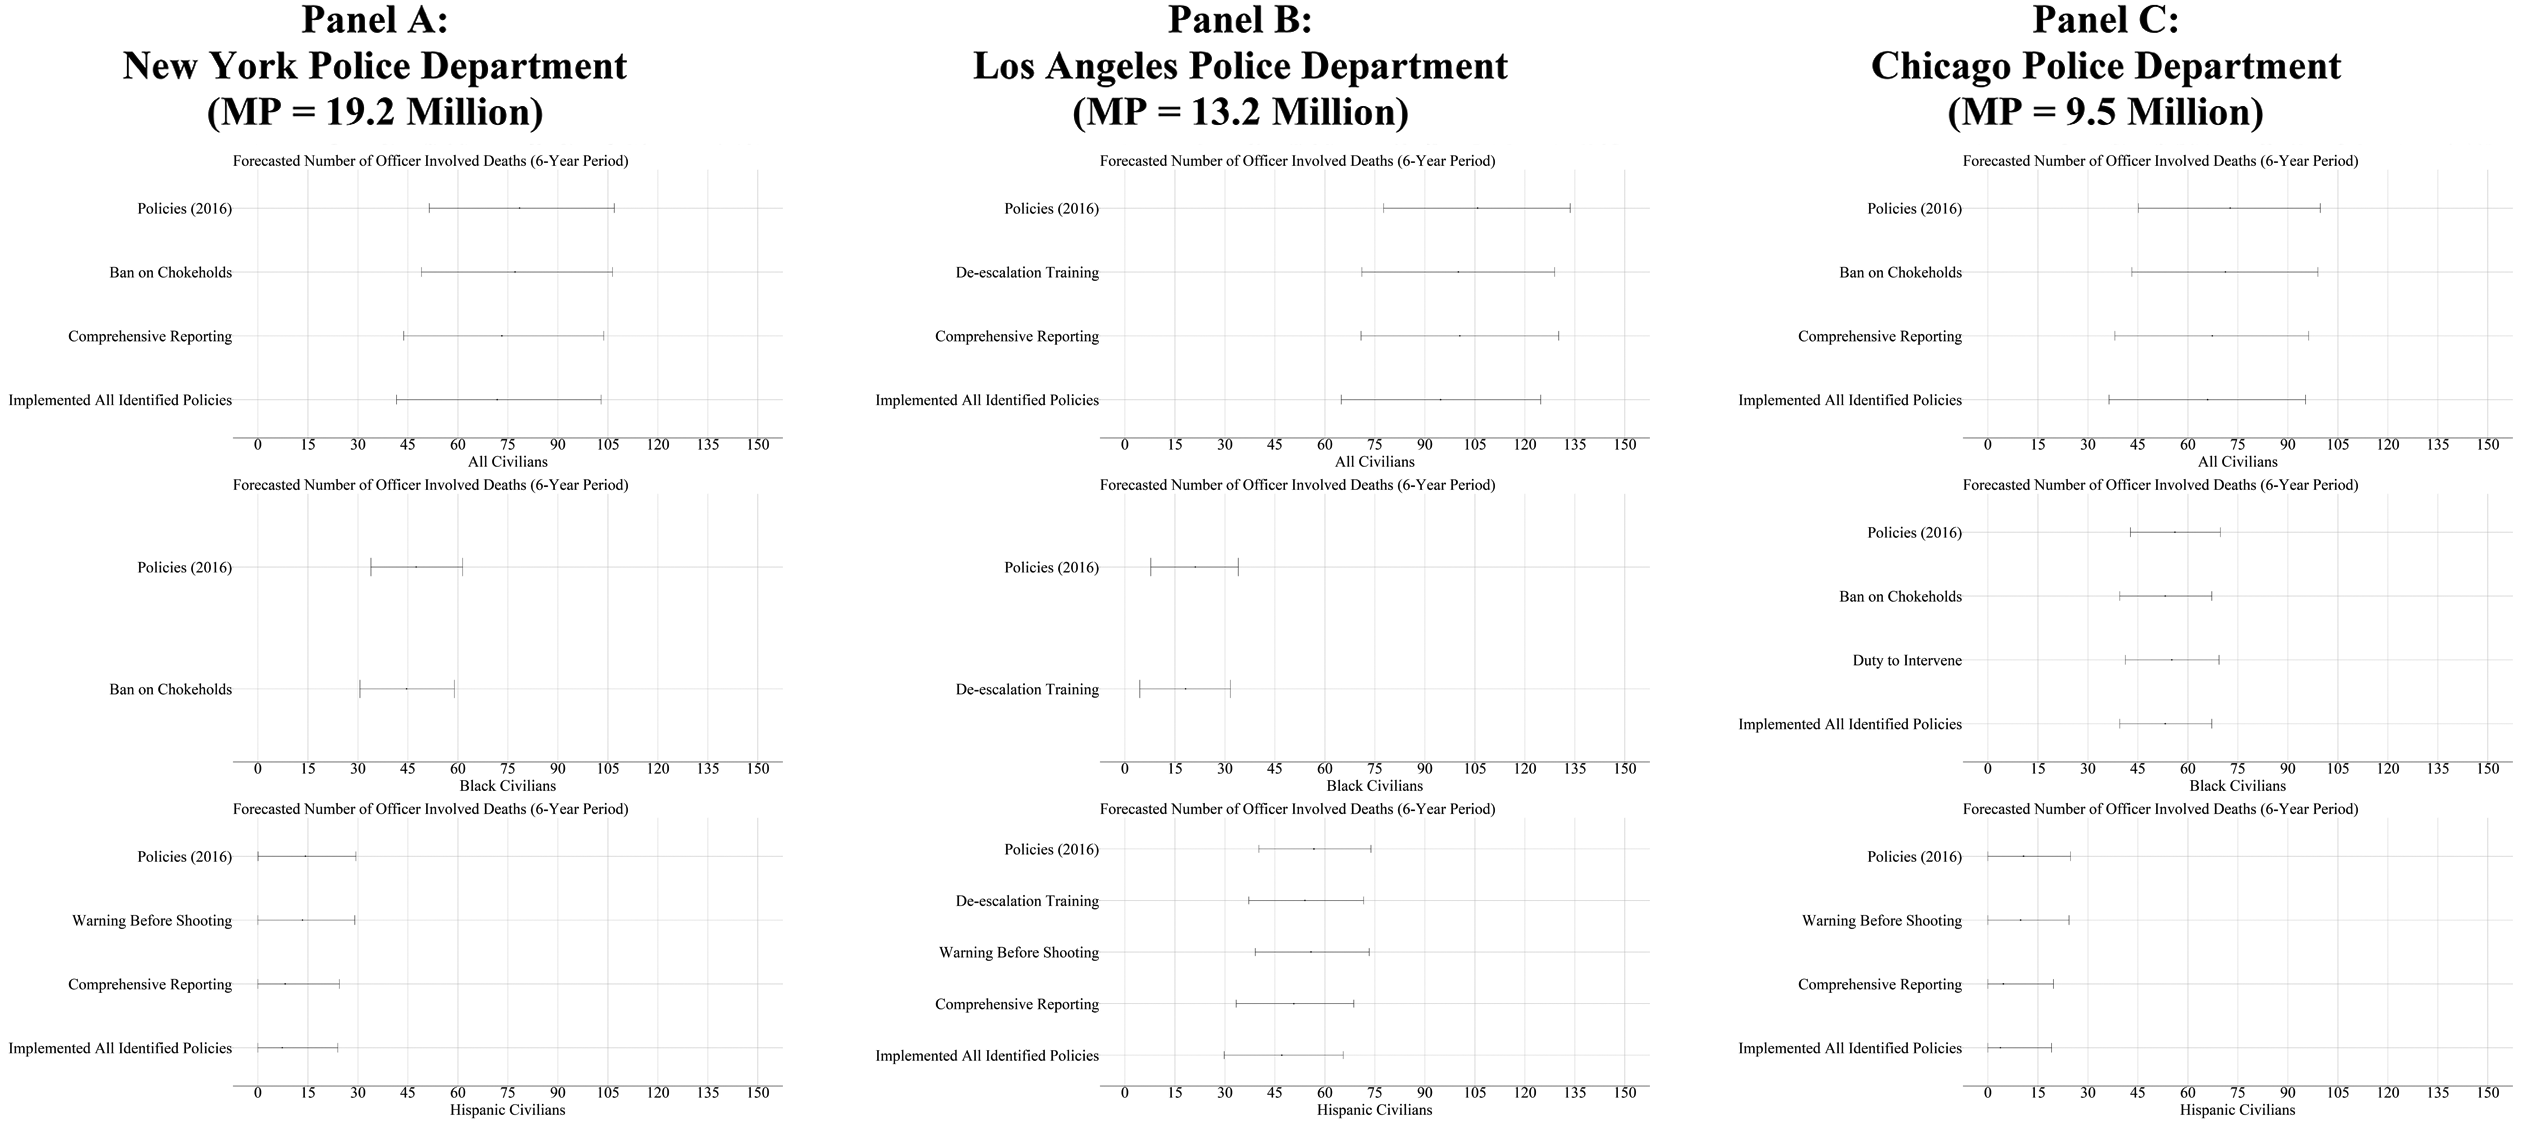
Forecasted officer-involved deaths and posterior predictive intervals (95%; six-year average) from police departments serving the largest metropolitan populations. Notes: “MP” = Metropolitan Population; The forecasted six-year average and posterior predictive intervals (95%) were derived from Bayesian random intercept models, where the number of OID for all civilians, Black civilians, or Hispanic civilians were regressed on the identified police policies and additional control variables (see Tables S2–S4 for the full models). “Policies (2016)” represents the forecasted number of OID for the specified police department if the policies remained the same as identified in 2016 (PUFPA); “Implement all identified policies” represents the forecasted number of OID for the specified police department if the department implemented all of the policies identified above that were not implemented by the department in 2016 (PUFPA). Only those policies found to reduce the number of OID by .5 (or 1 when rounded up) are included in each panel. The square identifies the forecasted average number of OID for a six-year period, and the error bars identify the 95% posterior predictive intervals for the average. The specifications for the forecasts are provided in text supplemental text S3.
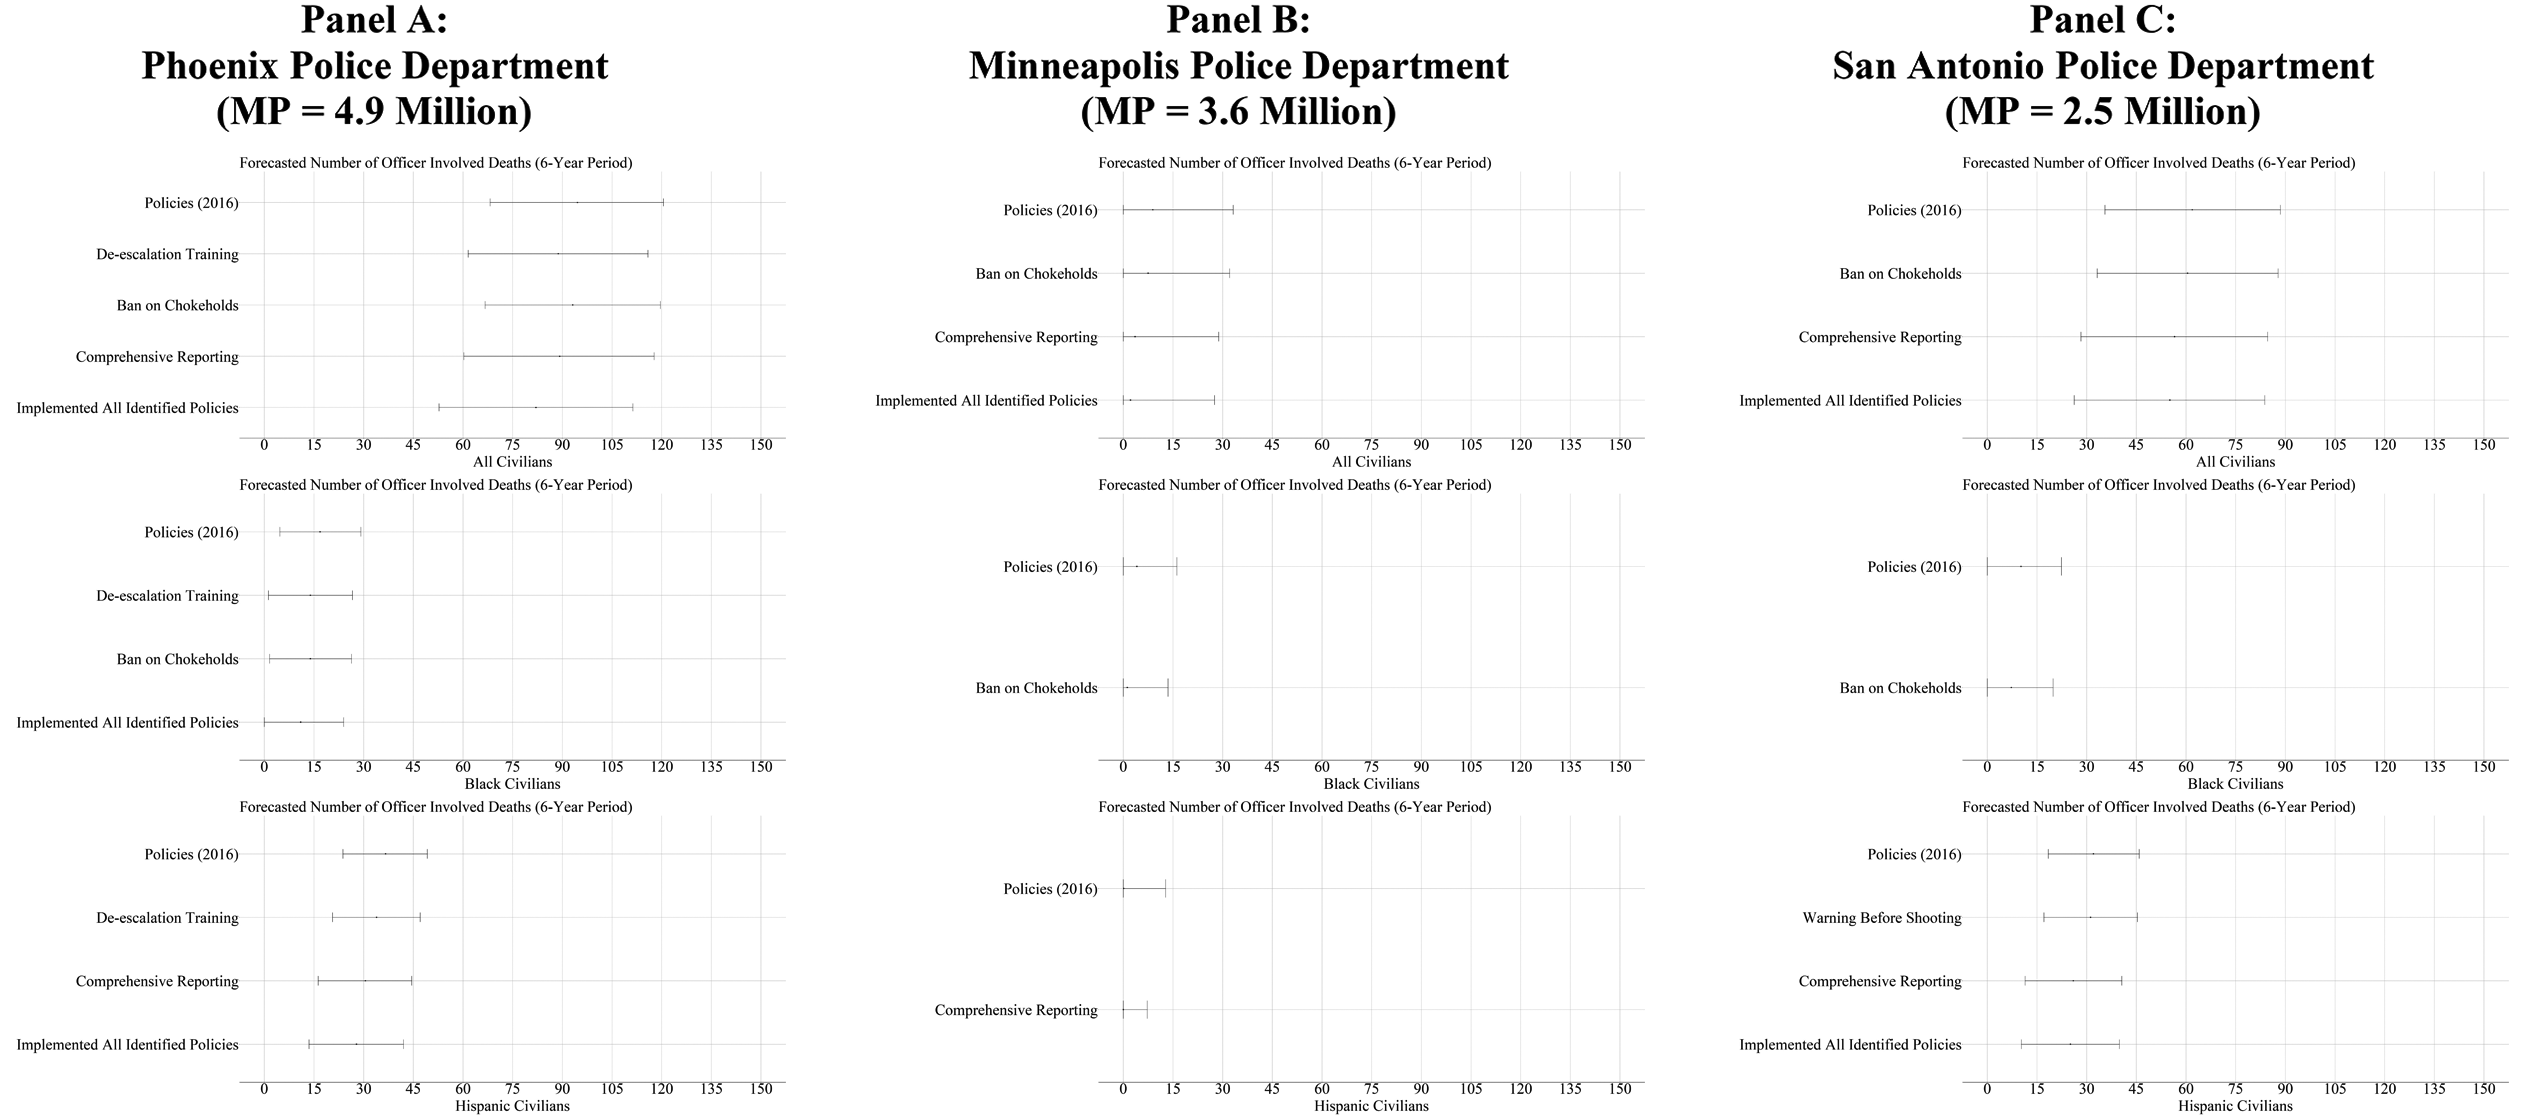
Forecasted officer-involved deaths and posterior predictive intervals (95%; six-year average) from police departments Medium-sized metropolitan populations. Notes: “MP” = Metropolitan Population; The forecasted six-year average and posterior predictive intervals (95%) were derived from Bayesian random intercept models, where the number of OID for all civilians, Black civilians, or Hispanic civilians were regressed on the identified police policies and additional control variables (see Tables S2–S4 for the full models). “Policies (2016)” represents the forecasted number of OID for the specified police department if the policies remained the same as identified in 2016 (PUFPA); “Implement all identified policies” represents the forecasted number of OID for the specified police department if the department implemented all of the policies identified above that were not implemented by the department in 2016 (PUFPA). Only those policies found to reduce the number of OID by .5 (or 1 when rounded up) are included in each panel. The square identifies the forecasted average number of OID for a six-year period, and the error bars identify the 95% posterior predictive intervals for the average. The specifications for the forecasts are provided in text supplemental text S3.
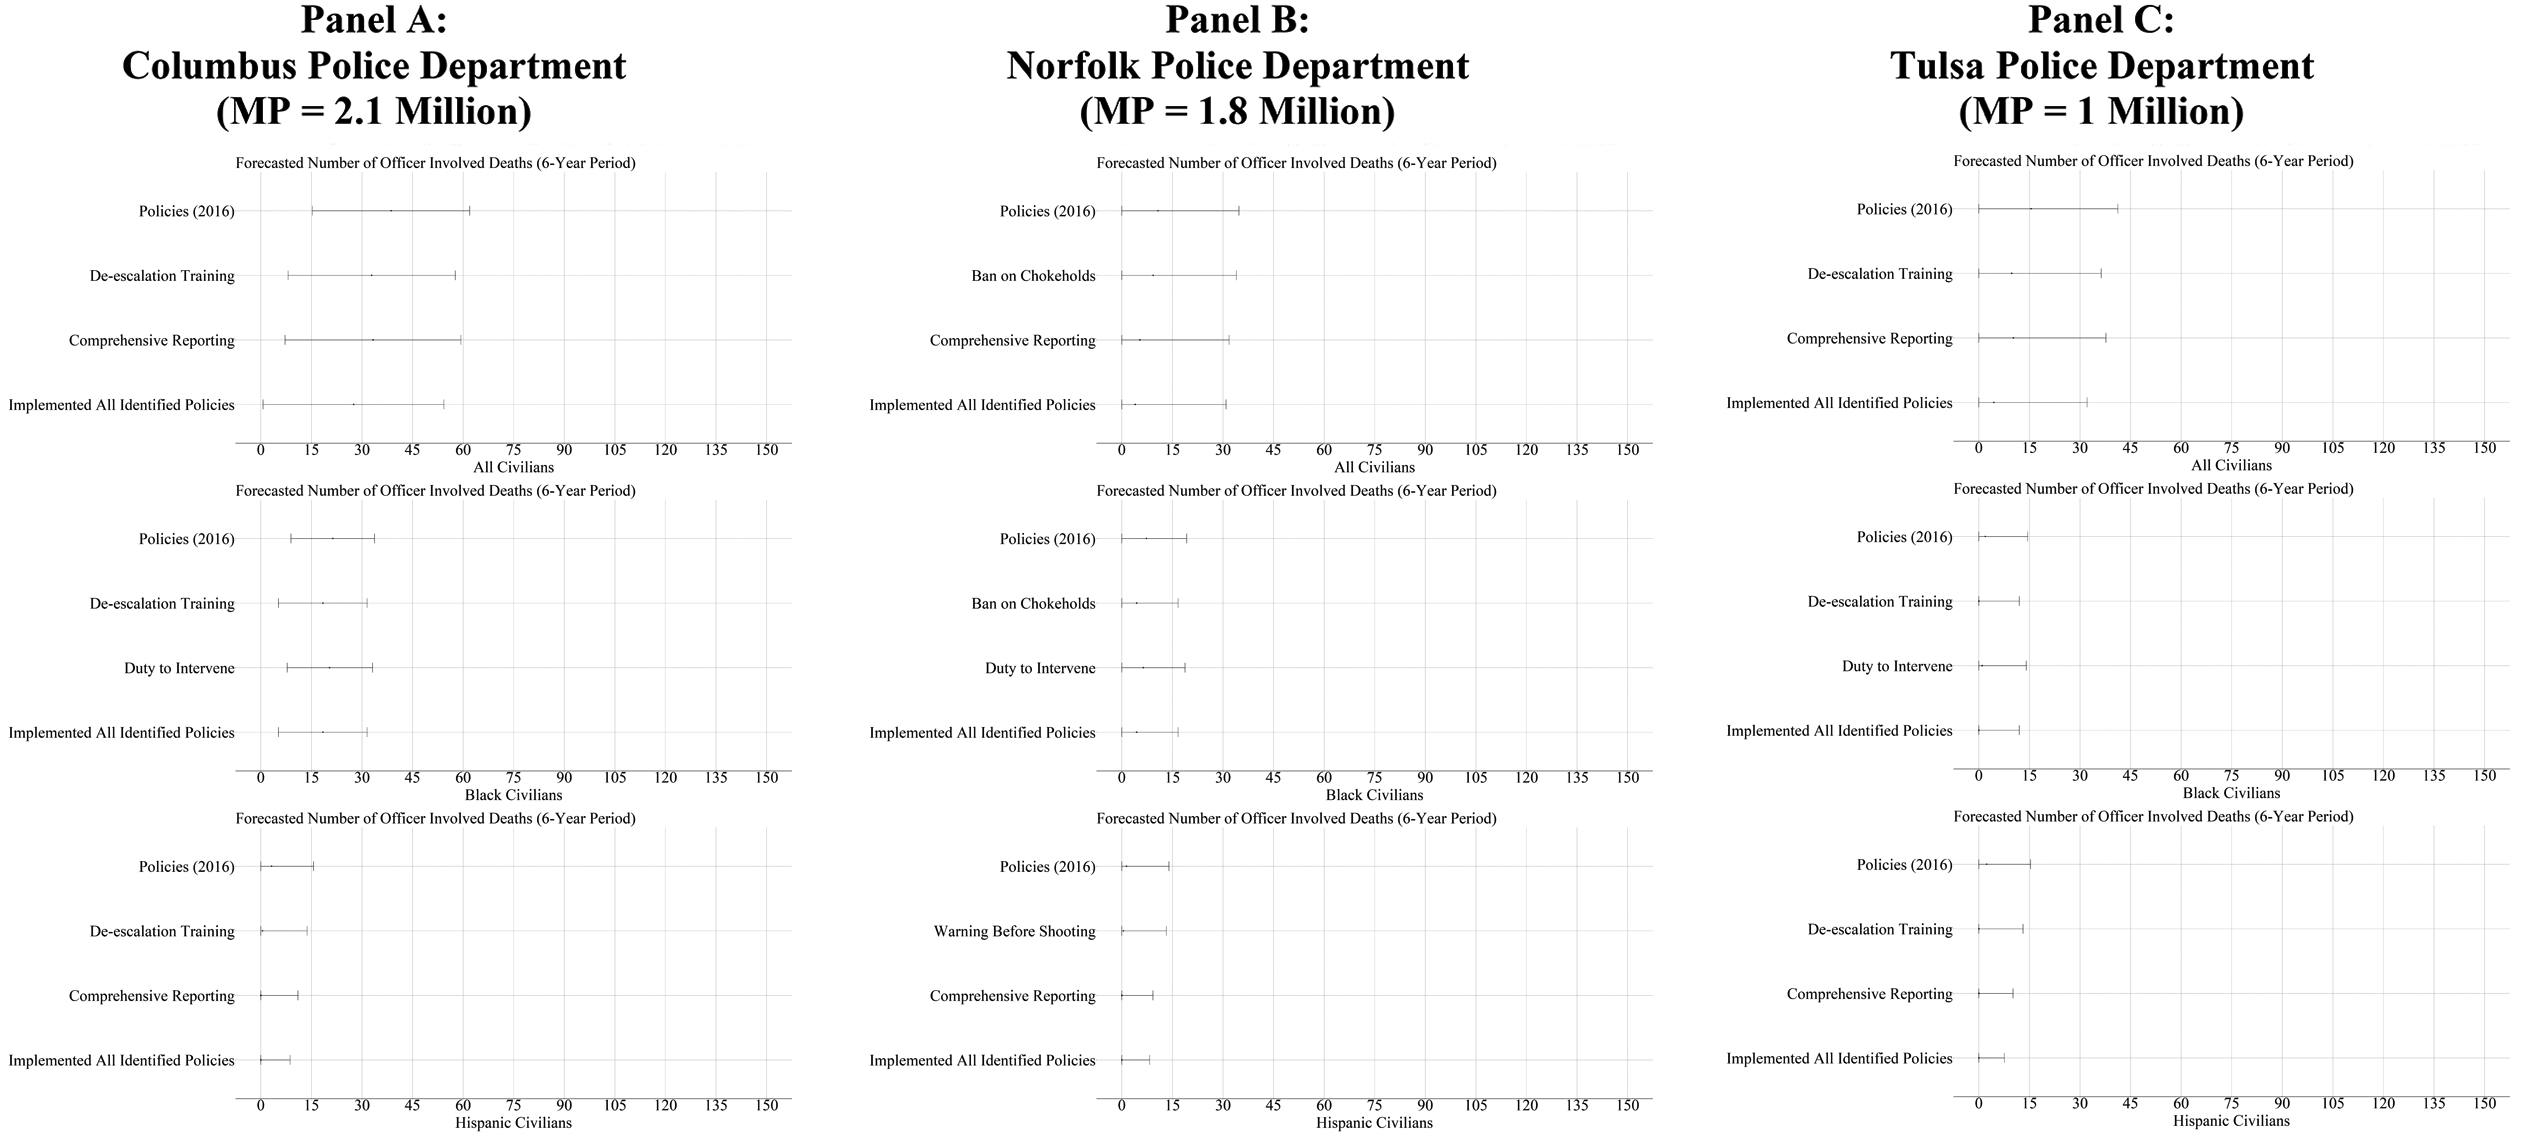
Forecasted officer-involved deaths and posterior predictive intervals (95%; 6-year average) from police departments serving small metropolitan populations. Notes: “MP” = Metropolitan Population; The forecasted six-year average and posterior predictive intervals (95%) were derived from Bayesian random intercept models, where the number of OID for all civilians, Black civilians, or Hispanic civilians were regressed on the identified police policies and additional control variables (see Table S2–S4 for the full models). “Policies (2016)” represents the forecasted number of OID for the specified police department if the policies remained the same as identified in 2016 (PUFPA); “Implement all identified policies” represents the forecasted number of OID for the specified police department if the department implemented all of the policies identified above that were not implemented by the department in 2016 (PUFPA). Only those policies found to reduce the number of OID by .5 (or 1 when rounded up) are included in each panel. The square identifies the forecasted average number of OID for a six-year period, and the error bars identify the 95% posterior predictive intervals for the average. The specifications for the forecasts are provided in supplemental text S3.
Figure 1 provides the forecasted number of OID for the police departments that serve the largest metropolitan populations in the U.S.: the New York Police Department (NYPD), the Los Angeles Police Department (LAPD), and the Chicago Police Department (CPD). If the NYPD, LAPD, and CPD continue to operate with policies implemented in 2016 alone, we can expect that officers in these agencies will be involved in the deaths of around 49–112, 75–139, and 41–107 civilians over a six-year period, respectively. However, the number of OID may be reduced by the integration of new policies. If these three agencies integrate all policies not implemented by 2016, each department may reduce the range of OID by nine civilians. A similar pattern was observed for OID of Black and Hispanic civilians, but variation between policies that reduced all civilian deaths, Black civilian deaths, and Hispanic civilian deaths was evident. For example, in all nine departments, comprehensive reporting might reduce OID of civilians overall, and of Hispanic civilians in particular, but may not affect the number of OID of Black civilians.
Figures 2 and 3 provide the forecasted number of OID for three police departments servicing medium-sized metropolitan populations (2.5–5.0 million individuals; Phoenix Police Department, Minneapolis Police Department, and the San Antonio Police Department) and three police departments servicing small metropolitan populations (fewer than 2.5 million individuals; Columbus Police Department, Norfolk Police Department, and the Tulsa Police Department). The forecasted number of OID of all civilians, Black civilians, and Hispanic civilians for the departments servicing medium and small metropolitan populations was generally lower than the NYPD, LAPD, and CPD. However, the Phoenix Police Department was expected to be involved in the deaths of approximately 52–119 civilians over a six-year period if they do not integrate any new policies. Figures 2 and 3 show that the integration of all the policies not implemented by 2016 could decrease the number of OID in all civilians. The integration of new polices, however, would only slightly attenuate the number of OID of Black and Hispanic civilians for police departments servicing smaller metropolitan populations. Findings associated with the remaining 57 police departments are generally consistent with the nine police departments in Figures 1–3.
Discussion and Conclusion
This study provides additional evidence for the effectiveness of police policies intended to reduce the use of lethal force. The estimated models suggested that five of the eight polices examined in the current study were associated with a lower number of OID of all civilians and Black civilians, and four of the eight polices examined were associated with a lower number of OID of Hispanic civilians. On the one hand, the results of the models suggest that some policies will reduce the number of OID. On the other hand, they suggest that these policies might not have a uniform effect across racial or ethnic groups. It is not clear why the effects of these policies vary by race/ethnicity. One possibility is that suspect race/ethnicity might impact officers’ lethal use-of-force decisions. Studies have found that Black suspects are more likely to resist arrest than White or Hispanic suspects (Belvedere et al., 2005) and suspect resistance is a salient predictor of police use-of-force (Bolger, 2015). Thus, policies such as banning chokeholds may be effective at reducing OID of Black citizens, as we observed. Similarly, given the historically strained relationship between Black communities and police, policies like comprehensive reporting may not improve these relations enough in Black communities to reduce OID of Black civilians.
Implementing the five policies associated with fewer OID across departments would reduce (by 5–10) the number of OID for the majority of the 66 police departments included. This reduction is a large portion of the total number of OID for some departments. However, implementing these policies may only result in a minor reduction (less than 10%) in the forecasted number of OID for other police departments. The uncertainty estimates suggest that some police departments may have no OID during a six-year period after implementing these policies, while others are likely to still have at least 30 OID after implementation.
Despite these important findings, this study has a handful of limitations that readers should consider. First, although this study examines many of the policies intended to reduce OID of civilians, it was not possible to include all policies, programs, or strategies. For instance, the use of body-worn cameras was not included. Similarly, 9 of the 100 largest U.S. police departments did not provide information about their use-of-force policies and were excluded. Although most agencies provided this information, results may differ if had they been included.
Second, while the sample includes 66 of the police departments that serve the 100 largest U.S. jurisdictions, the estimated effects of the policies on OID likely cannot generalize to rural police departments. More research is needed to evaluate whether these policies can reduce OID among police departments serving smaller communities. Third, due to data limitations, we were unable to use analytical techniques to establish the temporal order of the analysis (Wing et al., 2018). We were also unable to directly determine whether the implementation of these policies would cause any reduction in OIDs for White, Black, and Hispanic populations. Race/ethnicity was measured as a single variable in the MPV data, and those who identified as Black and Hispanic were recorded as having a single race/ethnicity based on the official source documenting their death.
Finally, the MPV data have been criticized by Nix and Lozada (2021) because some OID incidents were misclassified (e.g., cases where individuals were killed in accidental crashes with police vehicles, incidents involving family members, spouses, friends, and acquaintances that were killed by off-duty officers). These cases are unlikely to have been influenced by policy changes. Still, the MPV data remain one of the most comprehensive sources of OID data.
The results of the current study have several implications for police agencies and researchers. First, widespread policy changes among police agencies are likely to only marginally reduce OID. Despite the observation that a handful of policies do appear to reduce OID, they are certainly not the proverbial silver bullet that policymakers and the public may hope for. These small reductions may not satisfy the public and policy makers who seek substantial reductions in or complete elimination of OID of civilians. However, each OID represents human life and any reduction in officer-involved civilian deaths is meaningful.
Second, results suggest that tailored approaches to reducing police violence in individual police agencies are needed. Substantial variation in OID among departments means that more serious reforms are needed in some places, but perhaps not others. Developing tailored solutions for OID incidents is consistent with arguments that the police are more effective when they develop solutions for specific problems (Eck, 2003). Although Eck's (2003) arguments explain the effectiveness of POP, they may also be helpful in this context. Specifically, if police and policy makers continue to rely on “one-size-fits-all” approaches to curb lethal use-of-force and other OID scenarios, they will probably not achieve meaningful reductions in OID. For instance, implementing de-escalation training will not result in substantial reductions in OID if most incidents in a department do not involve verbal confrontations that escalate to violence.
Third, although this study contributes evidence for the effectiveness of policies intended to reduce OID, research examining these policies remains limited. The limits of this evidence have been the subject of recent studies (Engel et al., 2020). We join the authors of these studies in calling for more research to assess the effectiveness of policies designed to reduce the deaths of civilians, and especially Black civilians who are disproportionately involved in OID incidents.
Supplemental Material
sj-docx-1-raj-10.1177_21533687231167607 - Supplemental material for Reducing Officer-Involved Deaths of Civilians in Urban Areas: Forecasting the Effects of Departmental Policies
Supplemental material, sj-docx-1-raj-10.1177_21533687231167607 for Reducing Officer-Involved Deaths of Civilians in Urban Areas: Forecasting the Effects of Departmental Policies by James D. Kelsay, Ian A. Silver, and Leah C. Butler in Race and Justice
Footnotes
Author's Note
Leah C. Butler, School of Criminal Justice, University of Cincinnati, Cincinnati, OH, USA.
Declaration of Conflicting Interests
The author(s) declared no potential conflicts of interest with respect to the research, authorship, and/or publication of this article.
Funding
The author(s) received no financial support for the research, authorship, and/or publication of this article.
Supplemental Material
Supplemental material for this article is available online.
Notes
Author Biographies
References
Supplementary Material
Please find the following supplemental material available below.
For Open Access articles published under a Creative Commons License, all supplemental material carries the same license as the article it is associated with.
For non-Open Access articles published, all supplemental material carries a non-exclusive license, and permission requests for re-use of supplemental material or any part of supplemental material shall be sent directly to the copyright owner as specified in the copyright notice associated with the article.