
Abstract
Background: Little is known about readmission rates for total hip and total knee arthroplasty (THA and TKA). Our objective was to examine readmission rates and whether hospitals with high and low readmission rates at baseline remain outliers in subsequent years. Methods: We identified Medicare beneficiaries who underwent THA (N = 245 995) and TKA (N = 517 867) between 2003 and 2005. We created four different hospital cohorts: low and high volume for THA and TKA. We calculated 30-day risk-standardized readmission rates (RSRRs) for each hospital for each year. Hospitals were defined as having low (lowest 25% of all hospitals), high (highest 25% of hospitals), and intermediate readmission rates (all others) for each year. Hospitals were labeled outliers if they had consistently low or high readmission rates for all years. We examined the number and characteristics of outlier and nonoutlier hospitals. Results: Unadjusted readmission rates in 2003 for THA ranged from 0% to 94.7% (inter-quartile range: 0%-7.0%) and for TKA from 0% to 94.4% (inter-quartile range: 0.7%-5.9%). Of 255 low-volume THA hospitals with low readmission rates in 2003 (RSRRs ≤3.5%), 34 were outliers for all 3 years—significantly more than predicted (P < .0001). Likewise, of 256 low-volume THA hospitals with high readmission rates (RSRRs ≥5.8%) in 2003, 33 were outliers for all 3 years (P < .0001). Outlier and nonoutlier hospitals did not differ in meaningful ways (teaching status and staffing ratios). Results were similar for other hospital cohorts. Conclusions: Using a 3-year window allows for identification of hospitals with consistently higher and lower readmission rates than predicted.
Background
Approximately 250 000 patients undergo primary total hip arthroplasty (THA) and 400,000 undergo primary total knee arthroplasty (TKA) annually in the United States, making these two of the most common elective surgical procedures. 1,2 Both procedures are extremely safe with major complication rates of less than 10% and mortality of less than 1%. 3,4 At the same time, patients typically require intensive postoperative rehabilitation and hospital readmission is common in the postoperative period. 5–7
Hospital readmissions have long been of interest as a potential measure of hospital quality. 8 Researchers and policy makers have proposed that variation in readmission rates across hospitals represents wasteful spending that could be eliminated if hospitals were given appropriate incentives. 9–11 Yet implementation of policy changes to incentivize hospitals to reduce readmission rates have not occurred because of residual concern about whether readmission rates are a valid measure of hospital quality or simply reflect variations in patient case mix and other factors that are outside of the control of hospitals and physicians. 12,13
The debate over reimbursement for hospital readmissions has been reinvigorated in recent years by increasing concerns over the short-term solvency of the Federal Medicare program. 14,15 A 2005 report by the Medicare Payment Advisory Commission (MedPAC) suggested potential cost savings of $12 billion/year through reductions in readmissions 16 and other studies have reached similar conclusions. 17
Despite widespread interest in reducing hospital readmission rates, our understanding of hospital readmission rates remains limited. In particular, while a number of studies have examined trends in readmission rates over time 18,19 far fewer studies have focused on outliers—hospitals with particularly good performance (low readmission rates) or bad performance (high readmission rates). 14 There is also uncertainty whether hospitals identified as outliers during an initial year continue to be outliers during subsequent years. 20
The broad objective of our study was to examine variation in hospital readmission rates for primary THA and TKA. Our primary hypothesis was that there would be discrete groups of positive outliers (low readmission rates) and negative outliers (high readmission rates) whose outlier status persisted for 3 consecutive years. Our secondary hypothesis was that there would be a number of identifiable patient and hospital factors that differentiated positive and negative outliers from other hospitals.
Methods
Data
We used Medicare Provider Analysis and Review (MedPAR) Part A data files to identify all fee-for-service beneficiaries who underwent primary THA and TKA (International Classification of Diseases, Ninth Revision, Clinical Modification [ICD-9-CM] procedure codes 81.51 for THA and 81.54 for TKA) in 2003, 2004, and 2005. The Part A files contain a range of data collected from discharge abstracts for all hospitalized fee-for-service Medicare enrollees including patient demographics; ICD-9-CM codes for primary and secondary diagnoses and procedures; admission source (eg, elective, emergency department or transfer from outside hospital); admission and discharge dates; discharge disposition (eg, home, nursing home, transfer to another acute-care hospital, dead); death occurring up to 3 years after discharge; each patient’s unique Medicare beneficiary number allowing for identification of patient readmissions; and each hospital’s unique 6-digit identification number. Comorbid illnesses were identified using algorithms described by Elixhauser et al, which consider 30 specific conditions and exclude comorbid conditions that may represent complications of care or that are related to the primary reason for hospitalization. 21,22
Since primary THA and TKA are typically elective procedures, we excluded nonelective patients including those with acute fractures, those admitted through the emergency department, and/or after transfer from another acute-care hospital. 3,4 To avoid counting a second primary THA (or TKA) performed as part of a planned staged primary procedure (ie, a first primary followed by a contralateral primary performed sequentially during consecutive hospitalizations) as a readmission, we limited our study to the first THA (or TKA) performed on each patient during a 12-month period. This was achieved using a 12-month “look back” to ensure that each included procedure (primary THA or primary TKA) was the first of its kind. To implement this “look-back,” we limited our study to patients of age 66 years and older with 12 months of prior Medicare enrollment. We also excluded index admissions that took place after November 30, 2005 to allow for a full 30-day follow-up period to assess readmissions.
Analyses were conducted separately for the THA and TKA cohorts. We excluded all hospitals that did not perform the relevant procedure (THA or TKA) for each of the 3 years of our study. We also excluded hospitals with extremely low procedural volumes as such facilities would not have a large enough sample size for us to reliably calculate readmission rates. 17 More specifically, we excluded hospitals in the lowest quartile of THA volume (<24 THA procedures over 3 years), resulting in the exclusion of 736 hospitals. Likewise, we excluded hospitals in the lowest quartile of TKA volume (<45 TKA procedures) resulting in the exclusion of 910 hospitals and 15 268 patients). A detailed schematic depicting the generation of our THA and TKA study cohorts is provided as Appendices A and B. We linked the MedPAR data to the American Hospital Association (AHA) annual survey to obtain hospital level data on teaching status, number of hospital beds, and geographic region. We linked each patient in the MedPAR data to US Census data to obtain zip code level socioeconomic measures (eg, median household income).
Our primary outcome for both the THA and TKA cohorts was patient readmission to an acute-care hospital within 30 days of surgery for any cause.
Analysis
First, we examined the demographic characteristics and comorbidity of the THA and TKA patients for each of the 3 study years; all analyses were performed separately for the THA and TKA cohorts. We used the t test for comparisons of continuous variables and the Mantel-Hanzel chi-square test for categorical variables. We compared the average number of comorbid conditions among the THA and TKA cohorts across the 3 study years by adding the number of comorbid conditions present among each patient and then dividing this by the total number of patients in each cohort during each year. 23
Second, eligible hospitals were stratified into low-volume and high-volume groups for THA and TKA so as to achieve roughly similar numbers of hospitals in each volume group. For THA, low-volume hospitals were defined as those performing 83 or fewer procedures over the 3-year study period; all others were defined as high volume. For TKA, low-volume hospitals were defined as those performing 170 or fewer procedures over the 3-year period with all others defined as high volume. The rationale for stratifying hospitals according to volume was 2-fold. Lower-volume hospitals would, by nature of their smaller sample size, have less precision in their calculated readmission rates. In addition, given robust prior data linking lower hospital volume with poorer outcomes, 5,24,25 we felt it inappropriate to compare readmission rates among hospitals with vastly different procedural volumes.
Third, we calculated risk-standardized 30-day all-cause readmission rates (risk-standardized readmission rates [RSRRs]) for each hospital for each year by adapting risk-adjustment methods that have been used previously. 14,19 Risk-standardization uses statistical methods to adjust for differences in the demographics and comorbidity of patients served by each hospital to create an “apple-to-apple” comparison that accounts for the fact that different hospitals may care for patients with higher and lower risk of readmission. In particular, hierarchical generalized linear models were used to calculate 30-day readmission as a function of patient’s age, gender, race (black, white, and other), and the number of comorbidities. Models included hospital-specific random effects for each of the 3 study years. Risk-standardized 30-day readmission rates each year were obtained as the ratio of predicted to expected 30-day readmission rates multiplied by the overall unadjusted rate.
Finally, within the low- and high-volume strata, hospitals were divided into quartiles based upon their risk-standardized 30-day readmission rates for each study year. Then we defined a group of low readmission rate hospitals—as those with readmission rates in the lowest (first) quartile for RSRR for each of the 3 study years. Similarly, we defined high readmission rate hospitals as those with readmission rates in the highest (fourth) quartile for RSRR for each of the 3 study years. All other hospitals were defined as intermediate readmission rate hospitals. Thus, a hospital was only defined as a low readmission rate hospital if its RSRR ranked in the lowest 25% of all hospitals for all 3 study years and similar criteria were required to be defined as a high readmission rate hospital.
We compared the characteristics of hospitals (eg, bed size, teaching status, patient household income) with low, intermediate, and high readmission rates using t test for continuous variables and chi-square test for categorical variables. We also examined indications for readmission in the 3 hospital groups using ICD-9-CM codes. All analyses were conducted separately among low- and high-volume hospitals for the THA and TKA cohorts.
To assess the robustness of these results, an array of sensitivity analyses were then conducted. In particular, these analyses were repeated after adding back excluded patient populations (eg, fracture patients) and examining 90-day readmission rates instead of 30-day readmission rates. These analyses were also repeated looking at all THA and TKA hospitals without stratification by procedure volume and using alternative thresholds to define low and high readmission hospitals (eg,. lowest quintile, lowest decile).
All P values are 2-tailed, with P values less than .05 deemed statistically significant. All statistical analyses were performed using SAS 9.2 (SAS Institute Inc., Cary, North Carolina). This project was approved by the University of Iowa Institutional Review Board.
Results
We identified 304 884 Medicare beneficiaries who underwent primary THA in 3287 short-stay hospitals between 2003 and 2005 (Appendix A). After applying all exclusion criteria, our final THA cohort consisted of 245 995 patients (80.7% of all THA patients) in 2048 hospitals (62.3% of all THA hospitals); 11 582 patients (4.7%) were readmitted within 30-days of the index admission. Our TKA cohort consisted of 610 423 hospitalizations in 3321 short-stay hospitals (Appendix B). After applying all exclusion criteria, our final TKA cohort consisted of 517 867 patients (84.8% of all TKA patients) in 2213 hospitals (66.6% of all TKA hospitals); 22 295 patients (4.3%) were readmitted within 30 days of the index admission.
The mean age of THA and TKA recipients increased modestly during the study period as did the prevalence of diabetes and obesity (Table 1 ). The mean number of comorbid conditions increased from 1.7 to 1.9 among the THA population and from 1.8 to 2.0 among the TKA population (P < .0001 for both).
Characteristics of Medicare Beneficiaries Receiving Primary THA and TKA in 2003, 2004, and 2005

Abbreviations: THA, total hip arthroplasty; TKA, total knee arthroplasty; CHF, congestive heart failure; SD, standard deviation.
Of 1023 low-volume THA hospitals (mean annual primary THA volume 16.0), we defined those with RSRR in the 25th percentile or lower (RSRRs < 3.5%) as having low readmission rates in 2003 (N = 255). Of these 255 hospitals, 87 had low readmission rates in both 2003 and 2004 and 34 (P < .0001) had low readmission rates for all 3 study years (Table 2 and Figure 1 ). Alternatively, we defined those RSRRs in the 75th percentile or higher (RSRRs >5.8%) as having high readmission rates in 2003 (N = 256; Table 2 and Figure 1). Of these 258 hospitals, 85 had high readmission rates in both 2003 and 2004 and 33 (P < .001) had high readmission rates for all 3 study years.
Number of Hospitals With Low Readmission Rates and High Readmission Rates for THA and TKA in 2003, 2004, and 2005
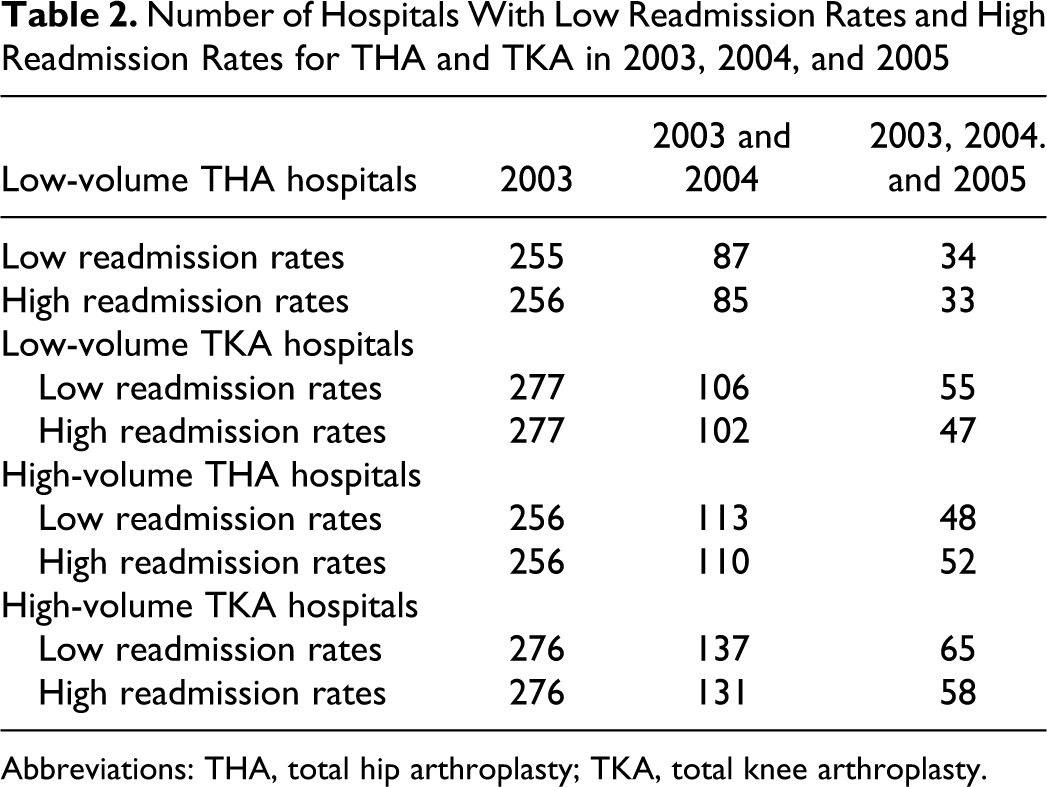
Abbreviations: THA, total hip arthroplasty; TKA, total knee arthroplasty.
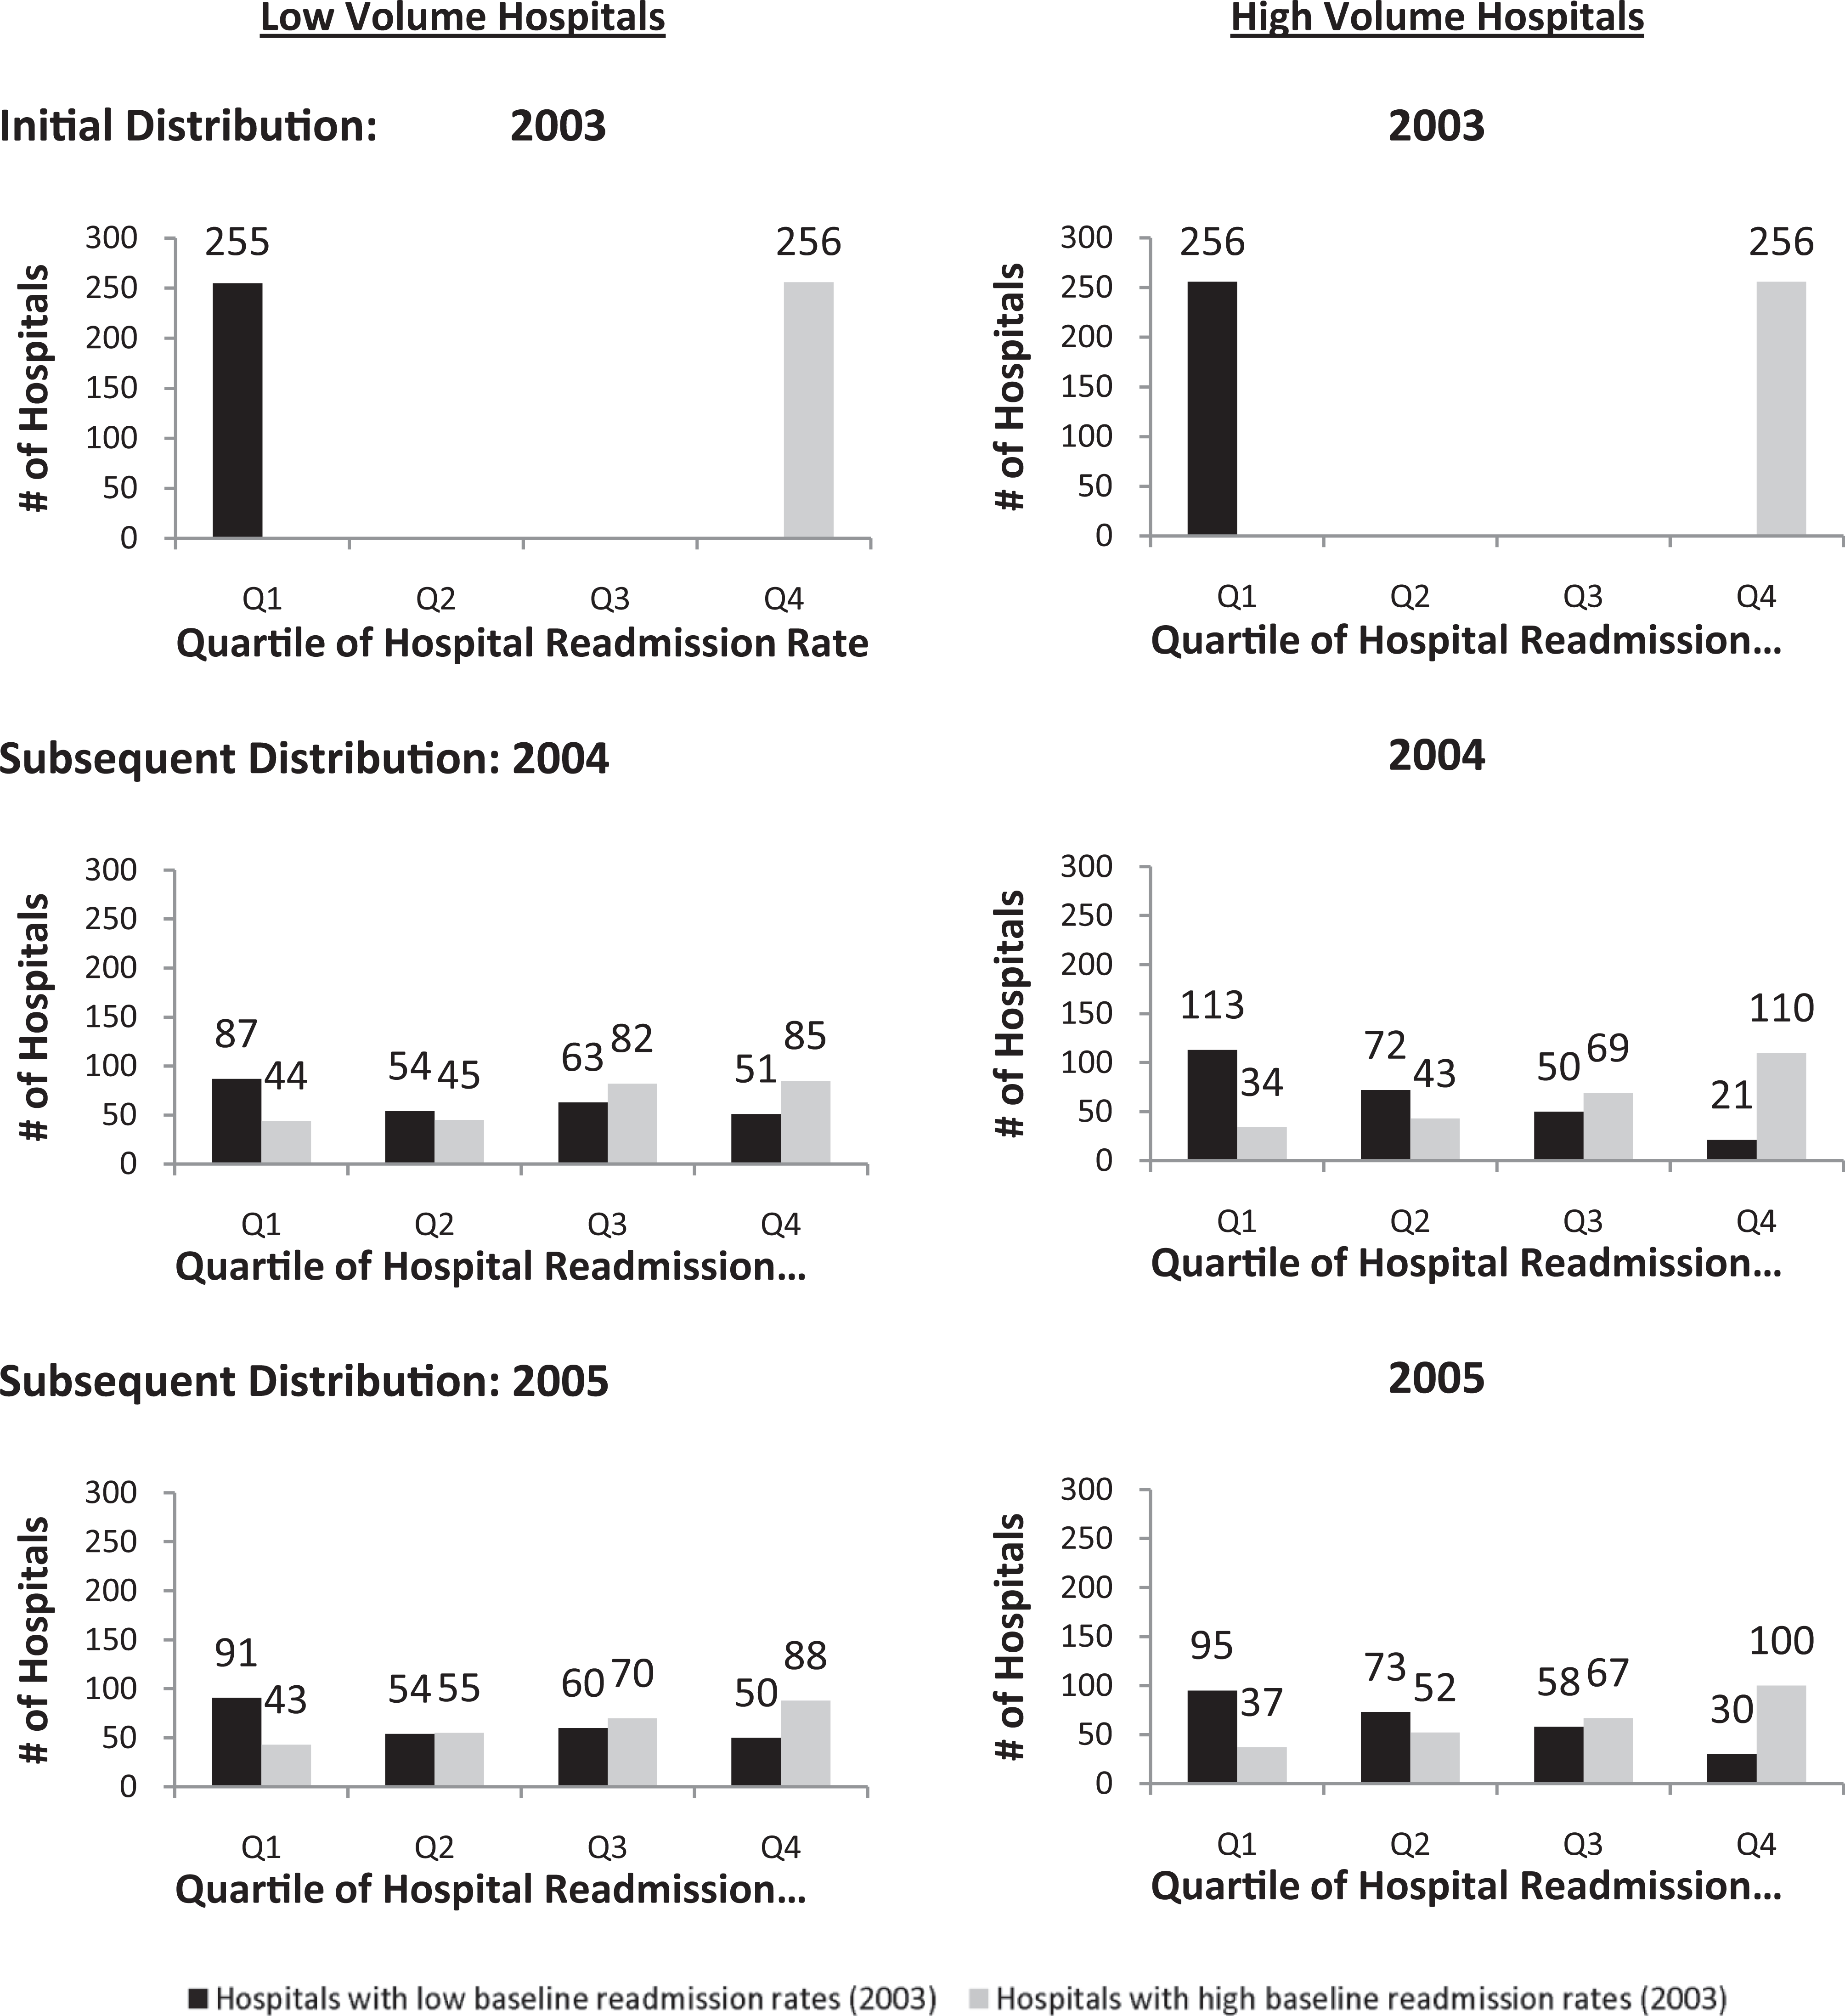
Changes in readmission rates for total hip arthroplasty (THA) outlier hospitals between 2003, 2004, and 2005. Quartile 1 is defined as hospitals in the lowest 25% of all hospitals for risk-standardized readmission rates. Quartile 4 is defined as hospitals in the highest 25% of all hospitals for risk-standardized readmission rates. For example, of the 255 low-volume hospitals with low readmission rates in 2003 (lowest quartile of all hospitals), 87 had low readmission rates in 2004 and 91 had low readmission rates in 2004. Alternatively, of the 256 high-volume hospitals with high readmission rates in 2003 (highest quartile of all hospitals), 110 had high readmission rates in 2004 and 100 had high readmission rates in 2005.
Looking instead at high-volume THA hospitals, we found that of 256 initially defined as having low readmission rates, 113 had low readmission rates for 2 consecutive years and 48 (P < .0001) for all 3 study years, while 110 had high readmission rates for 2 years and 52 (P < .0001) for all 3 study years (Table 2). Findings were similar when looking at both high-volume and low-volume TKA hospitals (Table 2). We also examined how hospitals identified as outliers in 2003 (RSRR in the top or bottom 25%) performed with regard to readmission rates in subsequent years (Figures 1 and 2 ). For example, of 255 low-volume THA hospitals with low readmission rates in 2003, only 87 of these hospitals had low readmission rates in 2004 while 51 actually had high readmission rates in 2004 (Figure 1). Findings were similar looking at high-volume THA hospitals (Figure 1) and both high- and low-volume TKA hospitals (Figure 2).

Changes in readmission rates for total knee arthroplasty (TKA) outlier hospitals between 2003, 2004, and 2005. Quartile 1 is defined as hospitals in the lowest 25% of all hospitals for risk-standardized readmission rates. Quartile 4 is defined as hospitals in the highest 25% of all hospitals for risk-standardized readmission rates. For example, of the 277 low-volume hospitals with low readmission rates in 2003 (lowest quartile of all hospitals), 106 had low readmission rates in 2004 and 105 had low readmission rates in 2004. Alternatively, of the 276 high-volume hospitals with high readmission rates in 2003 (highest quartile of all hospitals), 131 had high readmission rates in 2004 and 109 had high readmission rates in 2005.
We then compared the characteristics of hospitals with consistently low and high readmission rates for low-volume and high-volume THA and TKA hospitals. For THA, hospitals with low readmission rates appeared to have higher volumes than hospitals with high readmission rates (Table 3 ), but otherwise hospitals with low and high readmission rates appeared similar with regard to most key factors (eg, teaching status, nurse staffing, for-profit status). Low-volume THA hospitals with higher readmission rates had longer hospital length of stay; on the other hand, high-volume THA hospitals with lower readmission rates had longer length of stay (Table 3). Analyses focusing on TKA hospitals yielded similar results (Table 4 ).
Characteristics of THA Hospitals With Low, High, and Intermediate Readmission Rates a
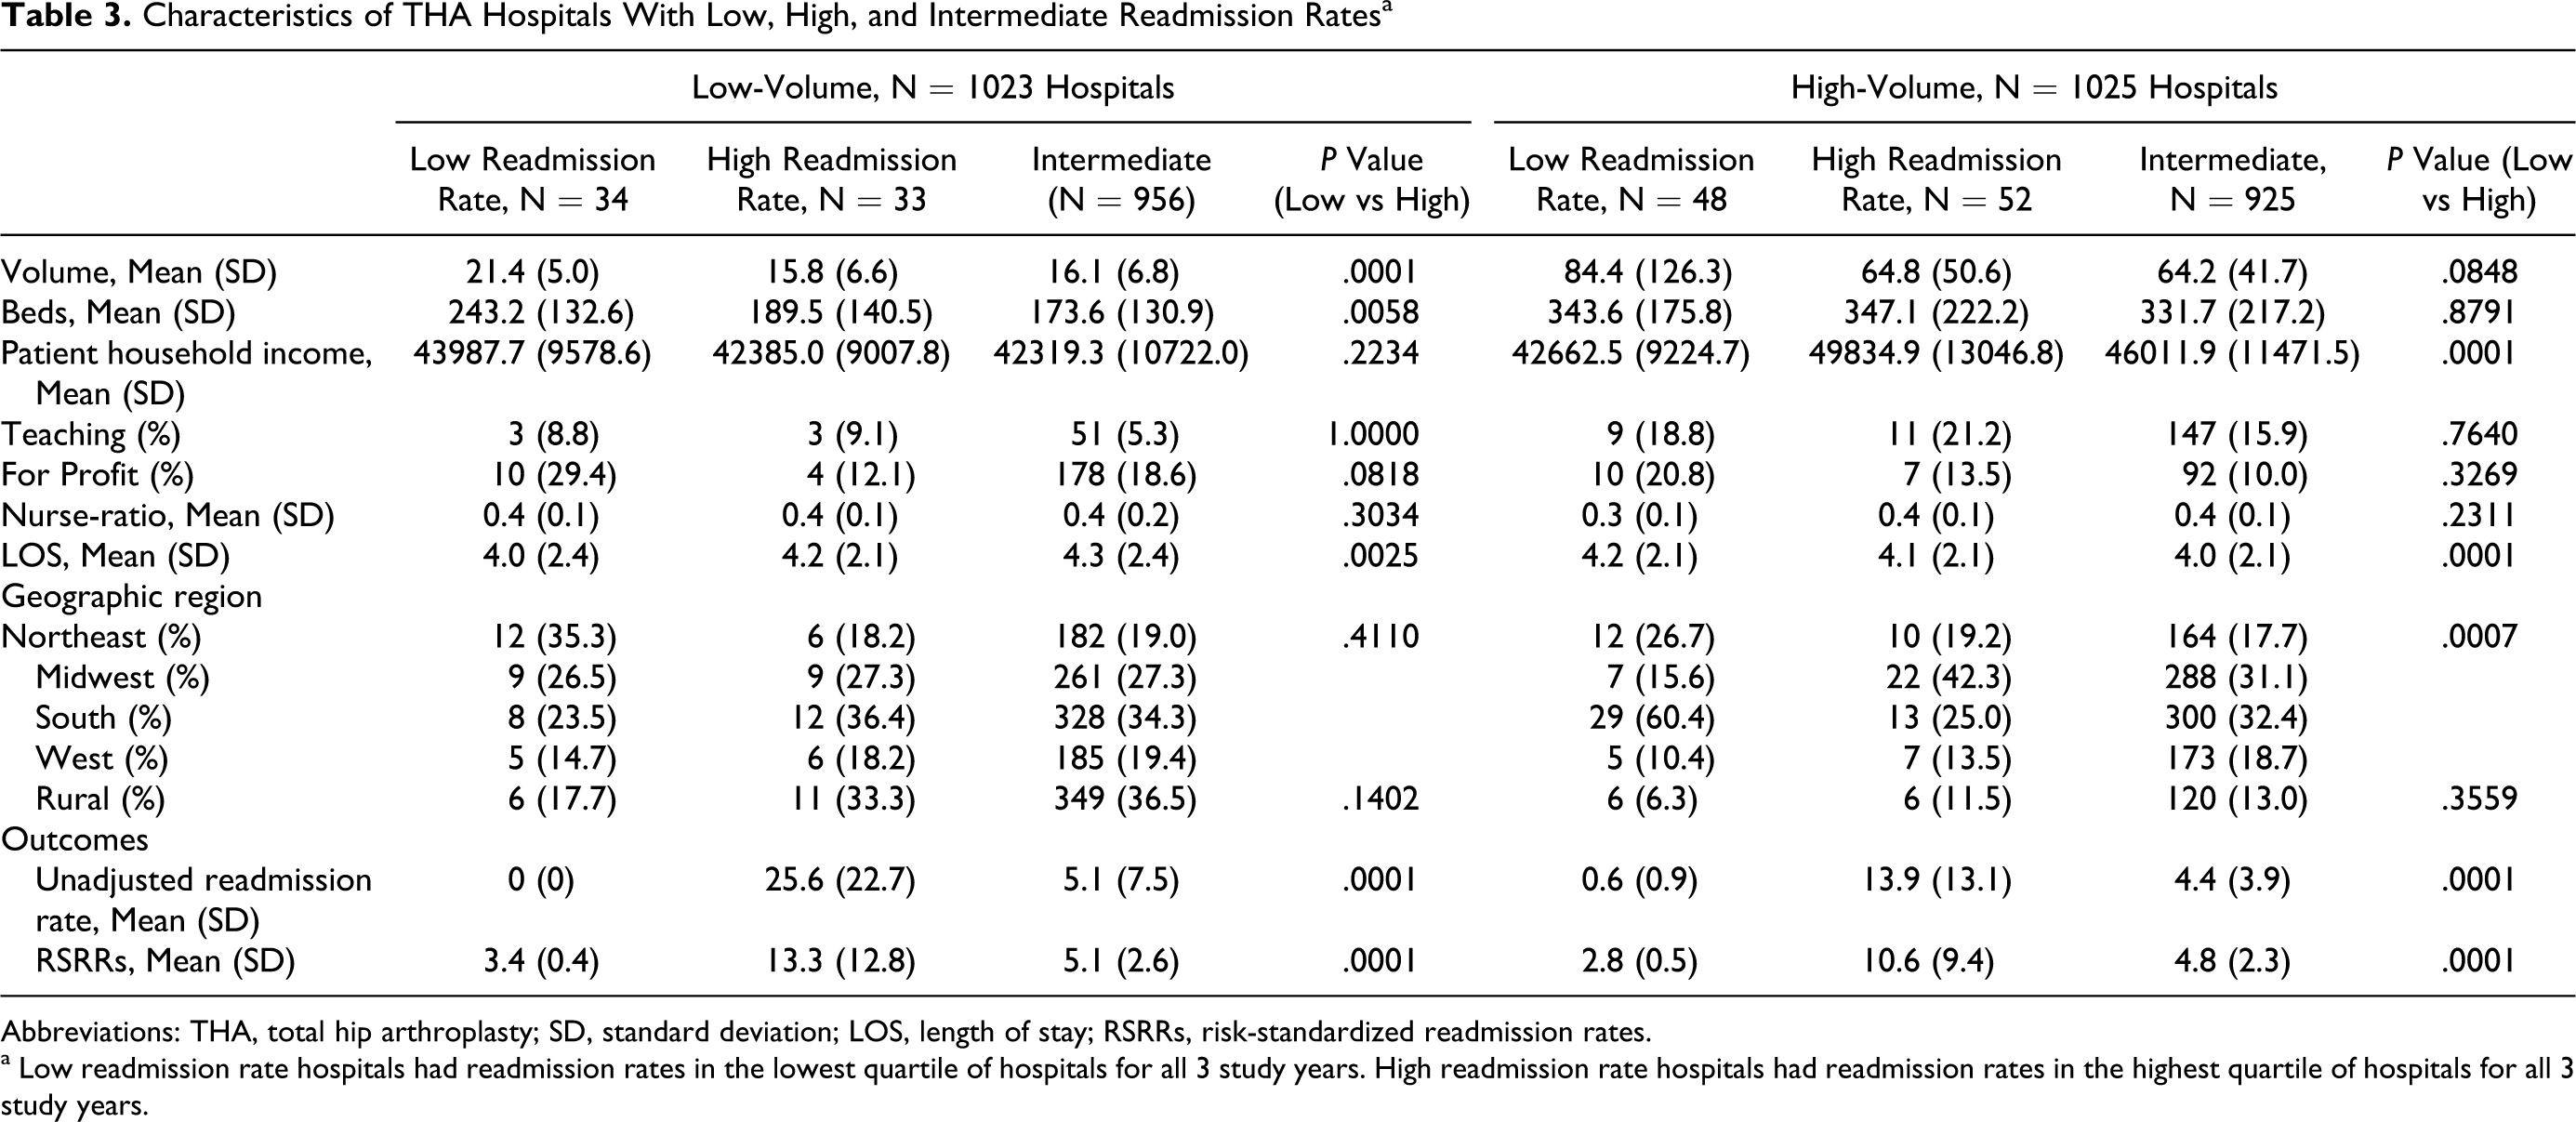
Abbreviations: THA, total hip arthroplasty; SD, standard deviation; LOS, length of stay; RSRRs, risk-standardized readmission rates.
a Low readmission rate hospitals had readmission rates in the lowest quartile of hospitals for all 3 study years. High readmission rate hospitals had readmission rates in the highest quartile of hospitals for all 3 study years.
Characteristics of TKA Hospitals With Low, High, and Intermediate Readmission Rates a

Abbreviations: THA, total hip arthroplasty; SD, standard deviation; LOS, length of stay; RSRRs, risk-standardized readmission rates.
a Low readmission rate hospitals had readmission rates in the lowest quartile of hospitals for all 3 study years. High readmission rate hospitals had readmission rates in the highest quartile of hospitals for all 3 study years.
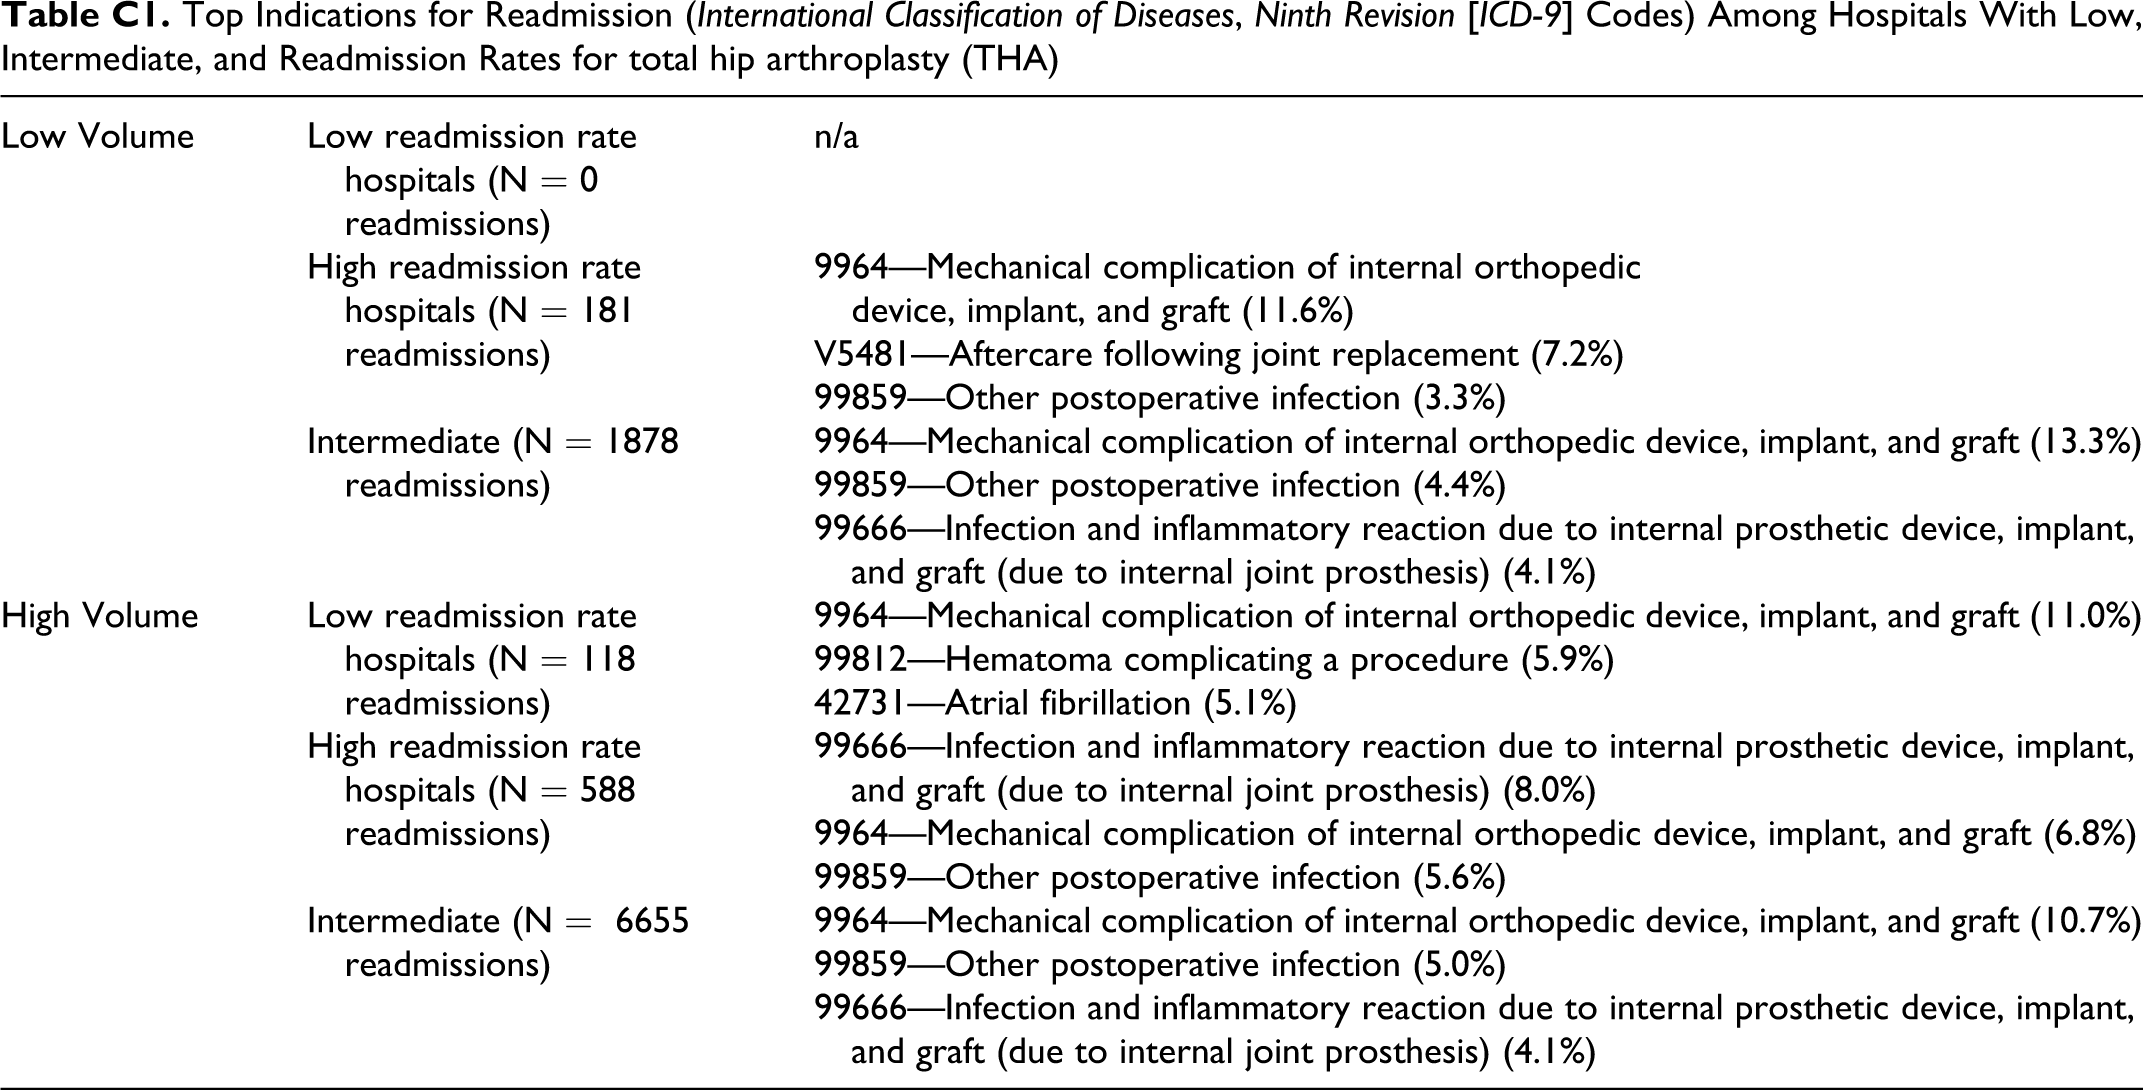
We conducted an array of supplementary analyses. We examined the number of hospitals that had consistently high and low readmission rates across all 3 study years for both THA and TKA. We found that only 5 low-volume hospitals and 14 high-volume hospitals had low readmission rates for both THA and TKA; likewise, we found that only 7 low-volume hospital and 16 high-volume hospitals had high readmission rates for both THA and TKA. We examined the diagnoses associated with readmission in each of our hospital groups (low-volume and high-volume THA and TKA) and found no obvious differences among hospitals with low, intermediate, and high readmission rates (Appendices C and D). In sensitivity analyses, results were similar when excluded patients and hospitals were added back to our cohorts, when alternative thresholds for volume were used, and when we used different cutoffs for defining hospitals with low and high readmission rates.
Discussion
In an analysis of Medicare administrative data, we were able to identify groups of outlier hospitals that had consistently lower and higher readmission rates than might be expected for primary THA and primary TKA over a 3-year period. Alternatively, we were unsuccessful in identifying specific hospital characteristics that associated with consistently higher or lower readmission rates. In total, our findings suggest that there are discrete groups of hospitals with consistently low readmission rates and consistently high readmission rates but were unable to uncover common factors among these outliers that might explain their performance.
A number of our findings merit further discussion. First, it is important to briefly review the mathematics behind our results. The number of outlier hospitals, while numerically small, is significantly higher than predicted based upon probability theory alone. 26 Beginning, for example, with the 1032 low-volume THA hospitals, there would be, by definition, 25% of hospitals (1032 × .25, or 258) with readmission rates in the lowest quartile of all hospitals in 2003 and 25% with readmission rates in the highest quartile in 2003. According to simple probability theory, one would expect that 25% of these hospitals (0.25 × 258, or 65) to have readmission rates in the lowest (or highest) quartile for 2 years in a row. And one would expect that 1/16th of these hospitals ([.25 × .25] × 258, or 16) would have readmission rates in the lowest (or highest) quartile for 3 years in a row. Instead, our method identified significantly more (P < .01) low-performing hospitals (ie, high readmission rates) and high-performing hospitals (ie, low readmission rates) than chance alone would predict for each subgroup. Our results confirm our hypothesis that there are discrete groups of hospitals that appear to have consistently low and high readmission rates after primary joint arthroplasty.
It is important to discuss our approach for identifying outliers, also called positive deviants and negative deviants in other studies, and the implications of this work. 27 In recent years a number of analyses focusing on cardiovascular disease have used longitudinal data to demonstrate that there are groups of hospitals with consistently excellent and consistently poor performance. 18,19 None of these previous analyses have focused on readmission rates or included joint arthroplasty. Now that we and others have demonstrated that an outlier approach works, the next challenge will be to better understand why certain hospitals are consistently excellent and others consistently lag behind; Curry et al have already begun to explore these issues through site visits and interviews with staff at outlier cardiovascular programs. 28 Ultimately, however, the objective of our work is to identify high- and low-performing hospitals and then find ways to implement practical, low-cost, sustainable interventions that can drive improvement. 29 From this perspective, the current study simply represents the first step.
It is also important to point out that we had limited success in identifying specific hospital factors that were associated with hospitals with consistently high or low readmission rates (our secondary hypothesis). We did find that hospitals with low readmission rates tended to have higher case volume and more hospital beds providing further evidence of potential efficiencies and improvements afforded by high-volume hospitals. 25,30 There was also a suggestion that hospitals with high readmission rates may care for patients who reside in less affluent neighborhoods. This is consistent with existing literature on the important relationship between patients' socioeconomic status and outcomes. 31 We also found a suggestion that high readmission rate hospitals were disproportionately located in the South and Midwest, while low readmission rate hospitals tended to be located in the Northeast and West. Alternatively, we found little evidence that nurse staffing ratios, teaching status, or for-profit status were associated with higher or lower readmission rates.
This study has a number of limitations that warrant brief mention. First, this study was limited to fee-for-service Medicare beneficiaries and thus the readmission rates identified among Medicare enrollees may differ from the readmission rates seen in the non-Medicare population. That said, more than 60% of all arthroplasty procedures are performed on Medicare enrollees, making this an appropriate data set for studying this issue. 5,32 Second, this study relied upon administrative data and thus our ability to fully evaluate the causes of readmission was limited to causes reported by the hospitals. Third, we limited this analysis to patients undergoing elective hip and knee arthroplasty. Fourth, our application of RSRRs to joint arthroplasty are somewhat novel, though measurement of RSRRs in cardiovascular disease is now commonplace. 19
In conclusion, using Medicare administrative data we were able to identify groups of hospitals with consistently lower and higher readmission rates than expected over a 3-year period. Hospitals with consistently low readmission rates should be used as models for national quality improvement efforts; their approaches should be studied and implemented at lower-performing hospitals. Hospitals with consistently high readmission rates should be targeted for increased oversight and quality improvement.
Footnotes
Appendix A
Flow diagram for generation of primary total hip arthroplasty (THA) cohort.
Appendix B
Flow diagram for generation of primary total knee arthroplasty (TKA) cohort.
Appendix C
Top Indications for Readmission (International Classification of Diseases, Ninth Revision [ICD-9] Codes) Among Hospitals With Low, Intermediate, and Readmission Rates for total hip arthroplasty (THA)
| Low Volume | Low readmission rate hospitals (N = 0 readmissions) | n/a |
| High readmission rate hospitals (N = 181 readmissions) | 9964—Mechanical complication of internal orthopedic device, implant, and graft (11.6%) | |
| V5481—Aftercare following joint replacement (7.2%) | ||
| 99859—Other postoperative infection (3.3%) | ||
| Intermediate (N = 1878 readmissions) | 9964—Mechanical complication of internal orthopedic device, implant, and graft (13.3%) | |
| 99859—Other postoperative infection (4.4%) | ||
| 99666—Infection and inflammatory reaction due to internal prosthetic device, implant, and graft (due to internal joint prosthesis) (4.1%) | ||
| High Volume | Low readmission rate hospitals (N = 118 readmissions) | 9964—Mechanical complication of internal orthopedic device, implant, and graft (11.0%) |
| 99812—Hematoma complicating a procedure (5.9%) | ||
| 42731—Atrial fibrillation (5.1%) | ||
| High readmission rate hospitals (N = 588 readmissions) | 99666—Infection and inflammatory reaction due to internal prosthetic device, implant, and graft (due to internal joint prosthesis) (8.0%) | |
| 9964—Mechanical complication of internal orthopedic device, implant, and graft (6.8%) | ||
| 99859—Other postoperative infection (5.6%) | ||
| Intermediate (N = 6655 readmissions) | 9964—Mechanical complication of internal orthopedic device, implant, and graft (10.7%) | |
| 99859—Other postoperative infection (5.0%) | ||
| 99666—Infection and inflammatory reaction due to internal prosthetic device, implant, and graft (due to internal joint prosthesis) (4.1%) |
Appendix D
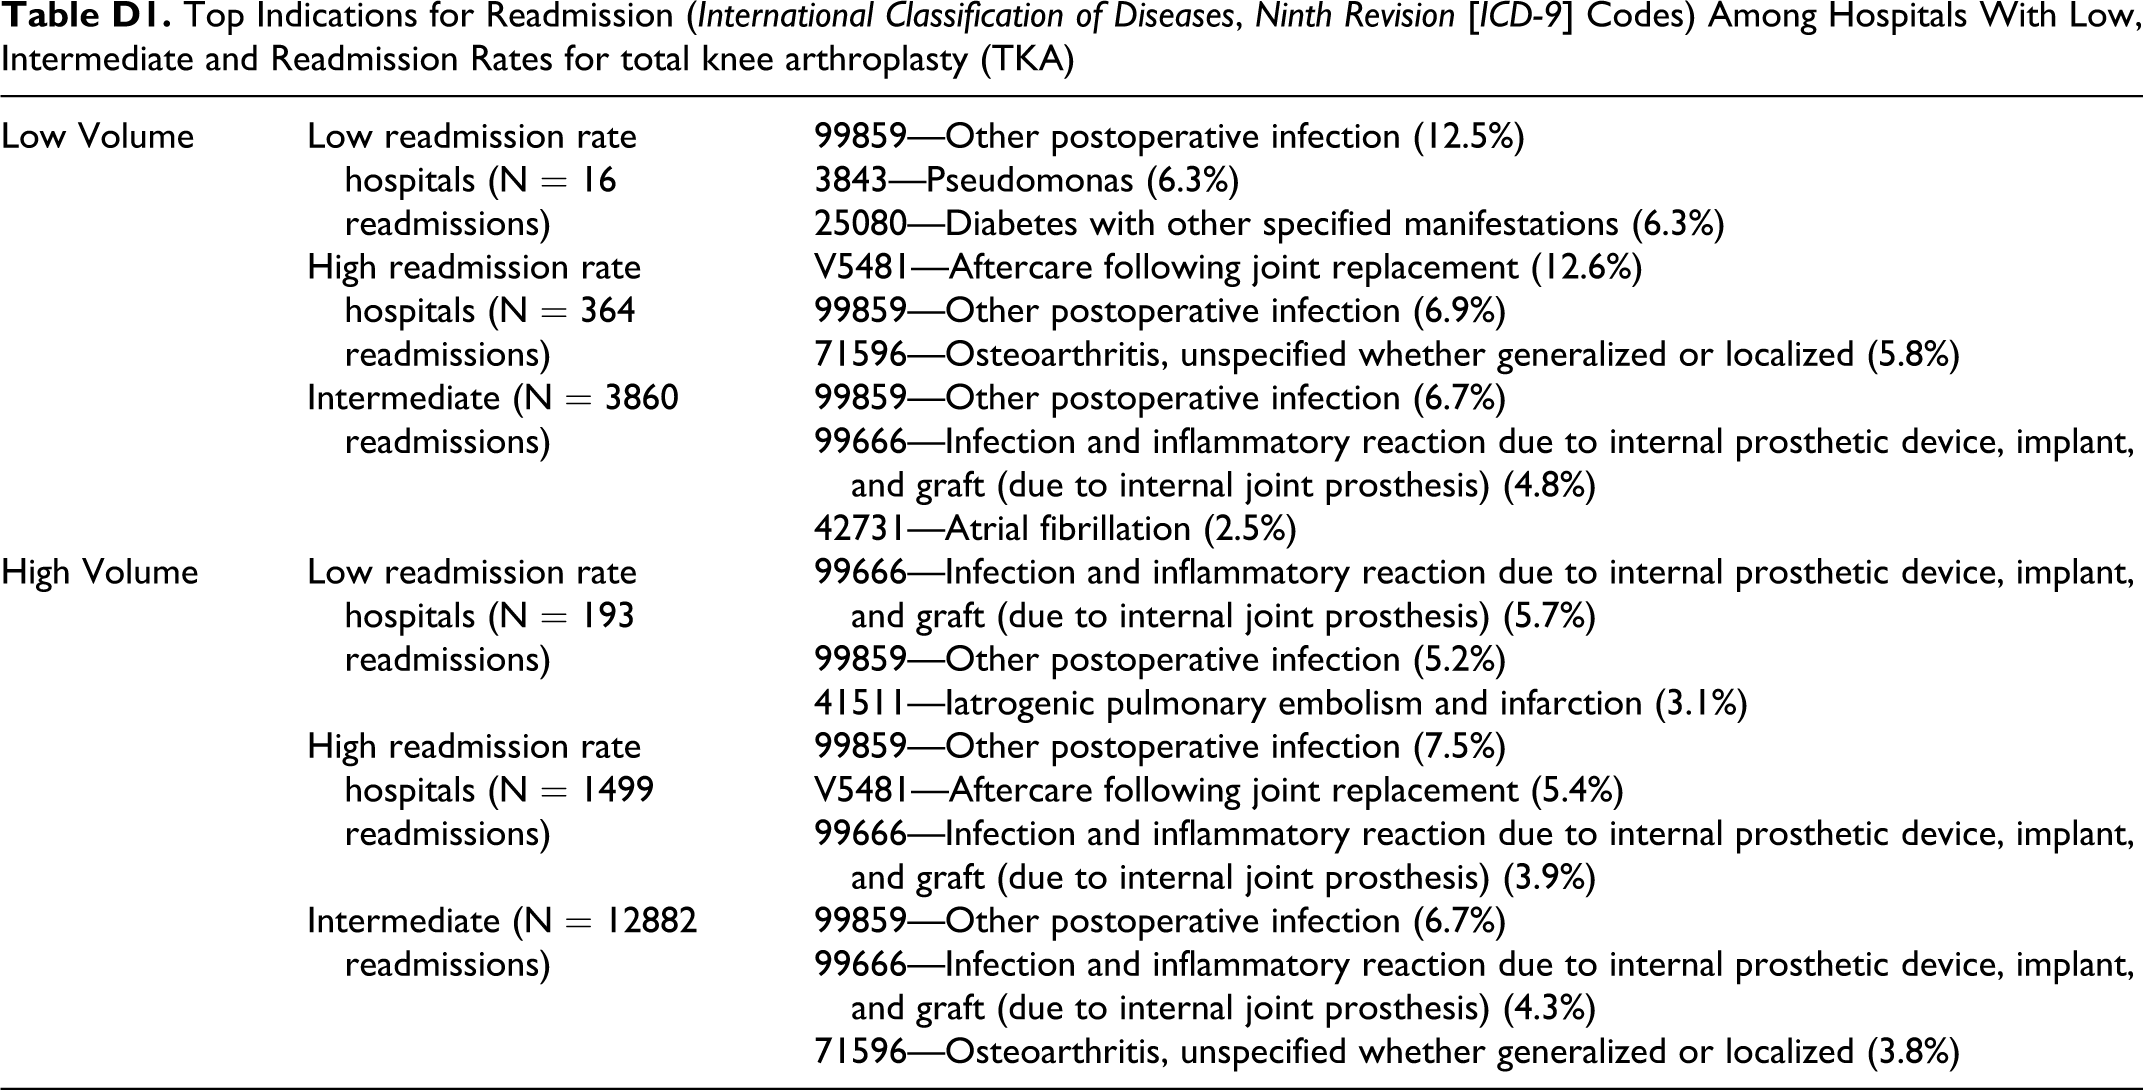
Top Indications for Readmission (International Classification of Diseases, Ninth Revision [ICD-9] Codes) Among Hospitals With Low, Intermediate and Readmission Rates for total knee arthroplasty (TKA)
| Low Volume | Low readmission rate hospitals (N = 16 readmissions) | 99859—Other postoperative infection (12.5%) |
| 3843—Pseudomonas (6.3%) | ||
| 25080—Diabetes with other specified manifestations (6.3%) | ||
| High readmission rate hospitals (N = 364 readmissions) | V5481—Aftercare following joint replacement (12.6%) | |
| 99859—Other postoperative infection (6.9%) | ||
| 71596—Osteoarthritis, unspecified whether generalized or localized (5.8%) | ||
| Intermediate (N = 3860 readmissions) | 99859—Other postoperative infection (6.7%) | |
| 99666—Infection and inflammatory reaction due to internal prosthetic device, implant, and graft (due to internal joint prosthesis) (4.8%) | ||
| 42731—Atrial fibrillation (2.5%) | ||
| High Volume | Low readmission rate hospitals (N = 193 readmissions) | 99666—Infection and inflammatory reaction due to internal prosthetic device, implant, and graft (due to internal joint prosthesis) (5.7%) |
| 99859—Other postoperative infection (5.2%) | ||
| 41511—Iatrogenic pulmonary embolism and infarction (3.1%) | ||
| High readmission rate hospitals (N = 1499 readmissions) | 99859—Other postoperative infection (7.5%) | |
| V5481—Aftercare following joint replacement (5.4%) | ||
| 99666—Infection and inflammatory reaction due to internal prosthetic device, implant, and graft (due to internal joint prosthesis) (3.9%) | ||
| Intermediate (N = 12882 readmissions) | 99859—Other postoperative infection (6.7%) | |
| 99666—Infection and inflammatory reaction due to internal prosthetic device, implant, and graft (due to internal joint prosthesis) (4.3%) | ||
| 71596—Osteoarthritis, unspecified whether generalized or localized (3.8%) |
Acknowledgments
Dr Cram is supported by a K23 career development award (RR01997201) from the NCRR at the NIH and the Robert Wood Johnson Physician Faculty Scholars Program. This work is also funded by R01 HL085347-01A1 from NHLBI at the NIH. The views expressed in this article are those of the authors and do not necessarily represent the views of the Department of Veterans Affairs. The funding sources had no role in the analyses or drafting of this manuscript. None of the authors have any conflicts of interest. Dr Cram has received consulting fees from The Consumers Union (publisher of Consumer Reports Magazine) and Vanguard Health Inc. for work advice on quality improvement initiatives. Dr Kates is a recipient of the AHRQ National Orthopaedic Outcomes Registry grant, American Geriatrics Society/John A. Hartford Foundation grants, AO Research Foundation grant and Synthes USA Institutional Research grant.
Dr Cram and Ms Lu had full access to all the data in the study and take responsibility for the integrity of the data and the accuracy of the data analysis.
The author(s) declared no potential conflicts of interest with respect to the research, authorship, and/or publication of this article.
The author(s) received no financial support for the research, authorship, and/or publication of this article.