
Abstract
Introduction
Research on malnutrition in hospitals and other acute-care settings is long-standing.1,2 However, in spite of efforts to increase awareness of the importance of nutrition screening and possible intervention, rates of malnutrition in the United States remain high and up to 50% of adults are malnourished when hospitalized or experience a further decline in their nutrition status during hospitalization.3-6 Effective nutrition interventions are intended to improve nutrition status and treat or prevent malnutrition as well as reduce medical treatment costs and help relieve some of the financial burden imposed by malnutrition on patients and healthcare systems.7,8
Malnutrition has traditionally been studied in the institutional setting, which offers an accessible population and the ability to collect and record data, consistently. While institutional settings are often the source of nutrition-related data in the United States, researchers from other countries study malnutrition/risk and associated risk factors in community settings. For example, an 11-year longitudinal study in Sweden found that nearly 25% of community-dwelling older adults were at risk of malnutrition. 9 A study of elderly adults entering the hospital for major surgery in Belgium found that the risk of malnutrition increased with age, reaching 66% for those aged older than 70 years. 10 In a meta-analysis of malnutrition in European adults ≥65 years of age, prevalence rates of malnutrition risk were reported for 3 settings: hospitals, residential care, and the community. 11 Pooled prevalence rates of high malnutrition risk for these 3 settings were 28.0%, 17.5%, and 8.5%, respectively.
There has been less emphasis on nutrition risk and implementation of simple but effective interventions such as oral nutritional supplementation (ONS) utilization in community settings in the United States, particularly among the older adult population.12,13 The goals of the present study were to (1) explore the utilization rate of ONS use among community-dwelling adults ≥55 years of age, (2) describe characteristics of ONS users versus non-ONS users, and (3) understand predictors of ONS consumption. We hypothesized that ONS usage will be greater for adults at high versus low nutrition risk.
Methods
A detailed description of the study methods has been published previously.12,13 Briefly, this was a cross-sectional study conducted in Chicago, Illinois, United States, an urban environment rich in ethnic variability and health disparities. 14 The study was led by the Survey Research Laboratory at the University of Illinois at Chicago. Data were collected by the Interviewing Service of America (ISA, Van Nuys, California). Interviews were conducted by English- and Spanish-speaking, trained ISA interviewers over the course of four months in 2017. The sample frame included both listed and random-digit-dial (RDD) phone numbers (cell and landline). For additional details, see Sheean et al 12 and McKeever et al. 13
Participants with a land or cell line with a Chicago area code and residing within the city’s limits were eligible based on self-affirmation that they were age 55 years or older; non-Hispanic white, non-Hispanic black, or Hispanic; English- or Spanish-speakers; and willing to participate in the study. To maximize the likelihood of capturing various aspects of nutrition risk via telephone survey, we used two tools to classify participants. Neither tool necessitated in-person assessment of physical measures. The first was the abridged Patient-Generated Subjective Global Assessment (abPG-SGA), which is often used in the oncology setting. 15 The abPG-SGA is relevant to the current study because it includes specific nutrition-impact symptoms (eg, anorexia, constipation, dry mouth) that are clinically relevant, not captured in other commonly used screening tools, such as the MUST, DETERMINE, or SNAQ65+ and easily assessed over the phone.16-18 Additionally, abPG-SGA was chosen over the SNAQ65+ due to the targeted age group for our study population being less than 65 years of age. A score greater than 6 on the abPG-SGA indicates high nutrition risk, while a score less than 6 indicates a low risk.
The second tool used to assess nutrition risk was the DETERMINE Checklist, which calculates a nutrition risk score based on “yes/no” answers to questions related to nutritional health in older adults. While originally tested in adults >70 years of age, it has been validated for use in adults as young as age 60 years. 19 Additionally, the checklist was not designed as a stand-alone screening tool and its main focus is to offer to clinicians important information about the unique dietary and nutrition education needs of older adults.20,21 Scores range from 0 to 21, with 0 to 2 considered good, 3 to 5 as moderate nutrition risk, and ≥6 as high nutrition risk. The DETERMINE Checklist questions utilized in this study have been previously published.13,17
We asked respondents to describe themselves as “dependent” (needing supervision, direction, personal assistance, or total care) or “independent” (not needing supervision, direction, or personal assistance) in performing 6 activities of daily living (ADLs). 22 We also asked if they “ate alone most of the time” as a proxy for social isolation.
Respondents were asked a set of questions related to their utilization of health care services in the past 6 months, including visits to the emergency room (ER), hospital, admission to skilled nursing and/or inpatient rehabilitation facilities, and the receipt of home care services. We asked if participants “took 3 or more different prescribed or over-the-counter medications per day” as a proxy for polypharmacy. This wording is supported by the DETERMINE Checklist. 20
Participants were asked whether they had consumed ONS in the past 6 months. We described ONS as supplements that typically come in a liquid form (as a beverage) and explained that people may drink these when their diet alone cannot meet their daily calorie, protein, and other nutrient needs. We also mentioned that people may drink ONS when they have trouble chewing, when they do not have the appetite or time to eat or cook, or to supplement their diet with extra nutrition. We told respondents that ONS are found in the pharmacy area of the grocery store or in a special section at the drug store. We shared examples of ONS (eg, Ensure, Glucerna, etc) and noted that there are other liquid beverages, which are not considered ONS (eg, yogurt smoothies, protein shakes, etc).
Respondents who reported consuming ONS in the past 6 months were compared with those who did not on a variety of demographic, nutrition risk, ADL, and health care utilization variables using 2-sample t tests for continuous variables, tests for row mean score difference for ordinal variables, and chi-square or Fisher’s exact tests for other categorical variables. A logistic regression model applying stepwise selection was used to explore independent predictors of ONS use. Records with missing values for any of the covariates were excluded from the analysis. Covariates were tested for collinearity, with a Pearson correlation coefficient >0.8, tolerance <0.1, or a variance inflation factor >10 considered to be indicators of multicollinearity. All statistical analyses were conducted using SAS (version 9.4); a P value <.05 denoted statistical significance.
Results
From the 64 445 phone numbers available in the ISA database, 7064 contacts were made. A total of 1166 respondents were eligible for the study and 1001 completed the interview, reflecting an 85.8% response rate. Of the 1001 participants surveyed, 996 (99.5%) participants provided data on ONS use in the past 6 months, which was reported to be 11% (114) and will form our analytic sample moving forward. High nutrition risk was confirmed in 26% (n = 261) of the respondents according to their abPG-SGA score.
There were few demographic differences between ONS users and nonusers in our sample. The average age of ONS users was 67.9 ± 7.2 years, which was slightly older than the average age of non-ONS users (66.8 ± 6.3 years), though the difference was not statistically significant (P = .08). ONS users were somewhat less likely to be female than the nonusers (61% vs 70%, P = .053). Race, education, and body mass index (BMI) did not differ significantly between ONS users and nonusers in our sample (Table 1).
Demographic Characteristics.

Abbreviations: BMI, body mass index; GED, General Equivalence Diploma; ONS, oral nutritional supplementation; SD, standard deviation.
Responses of “don’t know” or “refused” were treated as missing and excluded from the denominator. Five participants who did not know whether they had consumed ONS in the past 6 months were excluded from the analysis.
Tests for differences between participants who consumed and did not consume ONS: t tests with pooled variance for age and BMI, test for row mean score difference for ordinal variables (education and BMI categories), and chi-square tests for other categorical variables.
The average amount of ONS consumed by those able to quantify their intake (n = 103/114) was 4.7 ± 4.4 cans or bottles per week. Among ONS users, 37% had received a recommendation to use it from their primary care physician or a specialist.
Comparing ONS users to nonusers, ONS users were more likely to be at high nutrition risk based on both abPG-SGA (43% vs 24%, P < .001) and DETERMINE (68% vs 48%, P < .001) scores (Table 2). ONS users were also less likely to report functioning independently based on all 6 ADLs (86% vs 92%, P = .03). In terms of health care utilization, ONS users were significantly more likely to have reported an ER visit, a hospital admission, a skilled nursing facility admission, or receipt of home health care services than nonusers (all P values <.05, Table 2). They were also significantly more likely to take ≥3 medications/day (77% vs 53%, P < .001), a proxy measure we use to assess the potential risk of polypharmacy.
Nutrition Risk, Activities of Daily Living, and Health Care Utilization.

Abbreviations: abPG-SGA, abridged Patient-Generated Subjective Global Assessment; ADLs, activities of daily living; ER, emergency room; ONS, oral nutritional supplementation; SD, standard deviation; SNF, skilled nursing facility.
Responses of “don’t know” or “refused” were treated as missing and excluded from the denominator. Five participants who did not know whether they had consumed ONS in the past 6 months were excluded from the analysis.
Tests for differences between participants who consumed and did not consume ONS: test for row mean score difference for ordinal variables (Nutrition Health Score), Fisher’s exact test for individual ADLs and SNF admission, and chi-square tests for other categorical variables.
Nutrition risk as defined by the abPG-SGA with scores <6 points = low risk and scores ≥6 points = high risk.
Based on the DETERMINE checklist developed by the Nutrition Screening Initiative.
We estimated a logistic regression model to explore the impact of each predictor on ONS use. Results revealed (Table 3) a higher nutrition risk score (per abPG-SGA) was significantly associated with ONS use (odds ratio [OR] = 2.07, 95% confidence interval [CI] =1.26-3.42; P = .004), as was taking ≥3 medications/day (OR = 2.47, 95% CI = 1.41-4.32; P = .002). Lower BMI and having been hospitalized in the past 6 months were also independently significantly (P < .05) associated with ONS use (OR = 0.95, 95% CI = 0.92-0.99 and OR = 2.09, 95% CI = 1.12-3.92, respectively). There were no indications of multicollinearity; the lowest tolerance value was 0.6, and the highest variance inflation factor was 1.6.
Logistic Regression Analysis for Predicting Consumption of Oral Nutritional Supplements (ONS) Use (N = 807) a
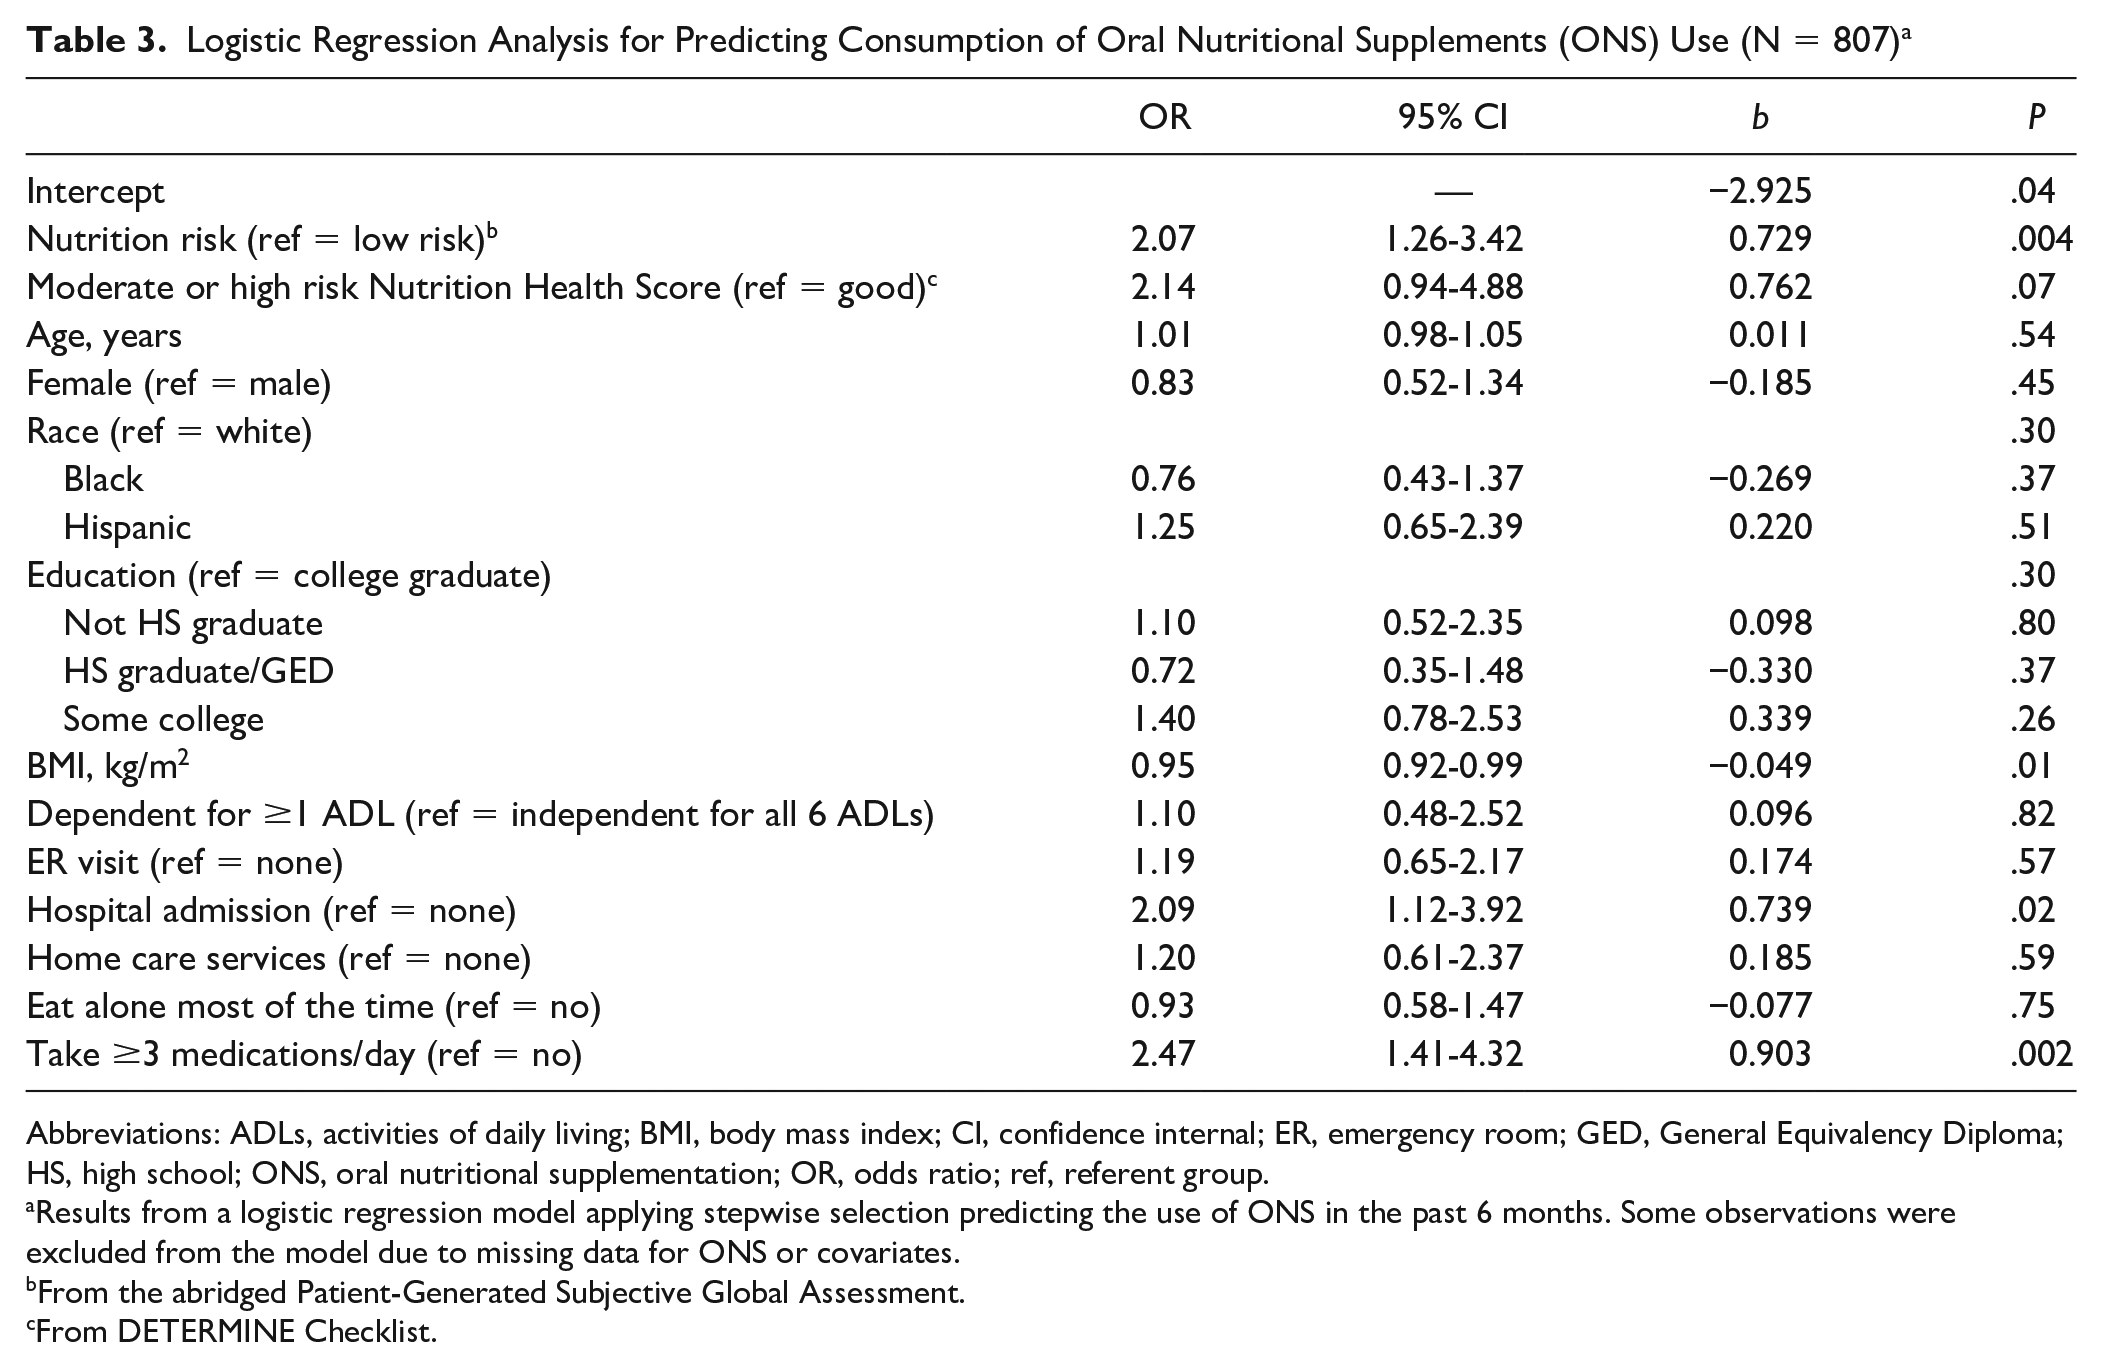
Abbreviations: ADLs, activities of daily living; BMI, body mass index; CI, confidence internal; ER, emergency room; GED, General Equivalency Diploma; HS, high school; ONS, oral nutritional supplementation; OR, odds ratio; ref, referent group.
Results from a logistic regression model applying stepwise selection predicting the use of ONS in the past 6 months. Some observations were excluded from the model due to missing data for ONS or covariates.
From the abridged Patient-Generated Subjective Global Assessment.
From DETERMINE Checklist.
Discussion
Our study found that 1 in 4 (26%) urban community-dwelling adults (≥55 years of age) was at nutrition risk. The overall ONS consumption rate in the past 6 months among our sample was 11%, while participants classified as high nutrition risk were twice more likely to consume ONS than participants classified as low nutrition risk.
Preventing and treating malnutrition or poor nutrition in older adults is a public health priority. In comparison to adequately nourished patients, malnourished patients are at increased risk of death and have fewer quality-adjusted life years. 23 Patients with malnutrition are also more likely to have longer hospital stays and higher readmission rates.24,25 The ONS users in our study were significantly more likely to have reported an ER visit, hospital admission, skilled nursing facility admission, or home health care services than nonusers and significantly more likely to take ≥3 medications/day (a proxy for risk of polypharmacy).
Our results build on a separate analysis of the same group of community-dwelling older adults. 13 In that study, McKeever and colleagues evaluated factors predictive of “inadequate dietary intake” (≤2 meals/day) and/or “poor diet quality” (consumption of few fruits, vegetables, or milk products). Their goal was to identify factors that could help predict which participants would benefit most from ONS. The significant, independent predictors of likely benefit from ONS included those who reported social isolation, low income, less educational attainment, heavy daily alcohol intake (≥3 drinks/day), compromised ADLs, and polypharmacy (≥3 medications/day). Recent data found that malnutrition disproportionately affects people with lower incomes and those aged 65 years and older.24,25 The findings are consistent with the present study. These findings are helping define factors that can be targeted for improved nutrition assessments and interventions, both of which can be implemented in primary care and community health settings. In our study, 37% of ONS users had received a recommendation for ONS use from a primary care physician or specialist.
Quality improvement programs (QIPs) focused on nutrition risk and malnutrition have been shown to alleviate the burden of malnutrition in the hospital setting, to ameliorate negative outcomes for patients with or at risk of malnutrition,26-28 and to create potential cost-savings by reducing both 30-day readmissions and length of hospital stays. 29 Riley et al 26 reported on a nutrition-focused QIP conducted in a home health agency (HHA) setting. Their study included over 1,500 at-risk/malnourished patients screened via the Nutritional Health Screen tool (utilized by Medicare-certified HHAs). Hospitalization rates and healthcare costs incurred within 90 days of HHA enrollment were substantially reduced in comparison to both historic and concurrent control groups, with an average per-patient savings from reduced health care resource utilization of $1500 (total savings was estimated at over $2.3 million).
Sriram et al 28 published results of a separate nutrition-focused QIP that included nutrition screening and early provision of ONS to over 1200 inpatients determined to be at-risk/malnourished at admission via the Malnutrition Screening Tool. They found an approximately 4% reduction in 30-day readmission rates (relative risk reduction [RRR] of 19.5%), and a reduction in hospital length of stay of nearly 2 days post-QIP compared with the pre-QIP control group (25% RRR). These improvements resulted in cost-savings of over $4.8 million total or net savings of over $3800. 29 The findings of both hospital and home health-based nutrition QIPs provide important insights on potential actions that clinicians and administrators of primary care and community health clinics can undertake to optimize nutrition care for their patient population. Such initiatives included nutrition screening, patient education, ONS supplementation, and follow up mechanisms to promote patient compliance with recommended nutrition regimens.26-29
Although malnutrition is commonly associated with undernutrition, it is important to note that the average BMI of our study population was 29.3 kg/m2, thus confirming that many community-dwelling adults at nutrition risk are either overweight or obese. Overnutrition is a major public health priority in the United States since more than 1 in 3 adults is overweight or obese. 30 However, nutrition interventions including ONS have been proven effective in the treatment of overnutrition and assisting patients with their weight management goals (similarly to the underweight patient populations). More specifically, ONS that have high-protein and low-caloric formulations for weight loss or diabetes-specific formulations for control of blood glucose have been found to improve the health outcomes of diabetes patients (eg, physical functioning, general health, etc).31-33
This study has several limitations. Based on our cross-sectional survey design, we were unable to infer causality from any of the assessed associations. We also chose a sample frame based on telephone access, so that anyone without a cell phone or landline was excluded from our survey. This may have led to selection bias and resulted in a less representative sampling of the population than we intended. While our response rate was good, about 15% of our sample frame did not respond and it is possible that the nonresponders differed from respondents in meaningful ways. Recall bias is another limitation of this study as ONS use and healthcare utilization were self-reported by an older population (mean age of 67.4 years) who may experience poor or incomplete memory recall. Therefore, future studies should employ study designs that can help reduce respondent’s recall bias. Additionally, we did not collect information regarding the type of ONS products consumed and patterns. Finally, information around other factors that could have affected ONS use, such as certain underlying health conditions that were not collected in the survey were not addressed as residual confounders and should be accounted in future research. Despite these limitations, we surveyed a large sample of adults ≥55 years of age, multiethnic, urban, community-dwelling individuals and combined the results of 2 tools (abPG-SGA and the DETERMINE Checklist) to assess nutrition risk. Our results support the importance of implementing nutrition-related programs to address the nutrition needs of community-dwelling adults.
Conclusions
Because malnutrition is both underrecognized and undertreated, there is an urgent need for more effective screening processes to identify and assess at-risk patients across different care settings—not just in hospitals.13,34 To this end, an international group of experts (The Global Leadership Initiative on Malnutrition, or GLIM) has been working toward the goal of defining and promoting an agreed-upon set of criteria to diagnose malnutrition. 35 The GLIM has proposed a scale that is derived from readily available, validated tools using phenotypic and etiologic criteria. Although use of this scale has not yet been validated or become common practice, it represents a logical and simple advancement for the identification of patients at risk of malnutrition. It also allows for grading of the severity of the phenotypic criteria (eg, low body mass index, nonvolitional weight loss, or reduced muscle mass) and suggests that etiologic criteria (eg, reduced food intake or assimilation, and inflammation or disease burden) can be used to help guide nutrition-related interventions. Adoption of such an approach requires global dedication to continuously educating healthcare professionals on the importance of preventing and treating malnutrition across different settings of care.
In our study of urban community-dwellers aged 55 years and older, only 11% reported ONS consumption even though more than 25% were at high risk for malnutrition. We found that the adults most likely to use ONS were those who had functional limitations and health conditions requiring multiple medications. This suggests that wider use of ONS, in patients at nutrition risk, could yield positive health outcomes. Greater efforts are needed to identify older adults at nutrition risk in community settings and outpatient clinics, paired with methods to implement effective nutrition education and ONS recommendations. Future research studies should focus on further exploring effective strategies to optimize how community-dwellers get screened, educated regarding different nutrition risk factors including weight management techniques (weight loss or gain), and offer nutrition interventions that can improve their health and economic outcomes.
Supplemental Material
CCBY-NC-with-BY-option-fillable-PDF_Signed – Supplemental material for Community-Dwelling Adults at Nutrition Risk: Characteristics in Relation to the Consumption of Oral Nutritional Supplements
Supplemental material, CCBY-NC-with-BY-option-fillable-PDF_Signed for Community-Dwelling Adults at Nutrition Risk: Characteristics in Relation to the Consumption of Oral Nutritional Supplements by Suela Sulo, Linda Schiffer, Patricia Sheean, Isabel Farrar, Jamie Partridge and Marian Fitzgibbon in Journal of Primary Care & Community Health
Footnotes
Acknowledgements
We would like to thank C. Hofmann and Associates for assistance with manuscript preparation.
Authors’ Note
Portions of this project were presented at the 2019 American Society for Nutrition Conference, Baltimore, Maryland.
Declaration of Conflicting Interests
The author(s) declared the following potential conflicts of interest with respect to the research, authorship, and/or publication of this article: I. Farrar, M. Fitzgibbon, and P. Sheean received salary support from Abbott. S. Sulo is an employee and stockholder of Abbott. J. Partridge was an employee and stockholder of Abbott during the conduct of the study.
Funding
The author(s) disclosed receipt of the following financial support for the research, authorship, and/or publication of this article: This study was funded by a grant from Abbott (#HA28).
References
Supplementary Material
Please find the following supplemental material available below.
For Open Access articles published under a Creative Commons License, all supplemental material carries the same license as the article it is associated with.
For non-Open Access articles published, all supplemental material carries a non-exclusive license, and permission requests for re-use of supplemental material or any part of supplemental material shall be sent directly to the copyright owner as specified in the copyright notice associated with the article.