
Abstract
Introduction
Mental health illness refers to various mental health conditions that influence mood, thinking, and behavior. 1 Given today’s rapidly urbanizing society, mental health illness affects one-fourth of people worldwide, placing it as one of the main contributing factors of disease burden. 2 Mental health illness has severe negative impacts on physical health, society, and economic burden. 1 Fortunately, mental health illness can be avoided with appropriate preventive measures, such as participation in a healthy lifestyle, coping with stress, and receiving social support. 3
The issues of mental health illness in developed and developing countries are similar. Today, mental health illness has become one of the main public health concerns in Malaysia and is predicted as the next cause of health problems after cardiovascular diseases in the near future.4,5 This is because increasingly more people will be facing work and family pressures. According to the national health report, the number of people suffering from mental health illness has increased by almost 200% from 1996 to 2015, 6 while the prevalence of depression and generalized anxiety disorder (GAD) has increased by approximately 17% from 2011 to 2015. 4 In 2008, more than 400 000 patients consulted psychiatrists in public hospitals, and this figure is predicted to increase. 5
The objective of the present study was to investigate sociodemographic, lifestyle, and health factors associated with depression and GAD among adults in Malaysia. To date, numerous studies related to factors associated with mental health illness, especially depression have been conducted in Malaysia. The studies found that mental illness was significantly associated with income,7-11 age,8,11-16 gender,7-9,13,15,16 ethnicity,11,17 education,7,11,18,19 marital status,7,8,14-17,20 employment status,11,14,15,18 smoking, 19 and health status.12,15 In the present study, we extended the analysis of previous studies by using a better statistical model, that is, bivariate probit model, to examine mental illness. Since depression and GAD are closely related, omission of GAD variable from the regressions previously may not produce the most accurate results. Utilizing the bivariate probit model, which differs from logistic regression model, this problem may be resolved by allowing the error terms of the regression for depression and GAD to be correlated. The regressions for these 2 explained variables were estimated simultaneously.
Methods
Sampling Method and Data Collection
The present study used a secondary analysis of cross-sectional data extracted from the National Health and Morbidity Survey 2011 (NHMS 2011). 21 The survey period was between 17 April 2011 and 27 July 2011. Although NHMS 2011 is not the latest dataset, it is nationally representative and consists of comprehensive information on individuals’ sociodemographic, lifestyle, and health profiles. The data collection of the NHMS 2011 was based on a 2-stage stratified sampling. The first stage sampling unit was based on enumeration blocks (EBs). A total of 794 EBs were selected, and each EB consisted of 500 to 600 people. The second stage sampling unit was based on living quarters (LQs). Twelve LQs were randomly selected from each EB. Members in all households within the selected LQs were interviewed. Inclusion criterion was noninstitutionalized individuals who resided in urban and rural areas of every state in Malaysia for a minimum of 2 weeks prior to the survey. Exclusion criterion was institutionalized individuals, such as those staying at hotels, hostels, prisons, and hospitals, and individuals who stayed in Malaysia for less than 2 weeks. A written consent form was distributed to each respondent prior to the survey. The respondents were not interviewed if their consent was not obtained. Ethical approval of NHMS 2011 was obtained from the Medical Research and Ethics Committee of Ministry of Health Malaysia.
Sample Size
The sample size of the NHMS 2011 was calculated based on a sample size calculation formula for a prevalence study.22,23 The formula was expressed as:
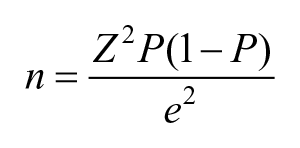
where n is sample size, Z is confidence interval of 95%, P is expected prevalence or proportion of diseases and health-related problems in the population (based on the previous NHMS), and e is margin of error (between 1% and 5%). The targeted respondents were 17 857, but only 16 343 were interviewed, which was equivalent to the response rate of 91.5%.
The Questionnaire and Variables
The interviewers used the piloted questionnaires to interview (face-to-face) the respondents. The questionnaires consisted of 18 modules: (1) sociodemographic, (2) load of illness, (3) health service utilization, (4) dental or oral health care, (5) outpatient care, (6) health care costs for appliance, (7) promotion and preventive care, (8) health problems, (9) general health, (10) personal risk factors, (11) dietary practices, (12) physical activity, (13) diabetes mellitus, (14) hypercholesterolemia, (15) hypertension, (16) home injury, (17) mental health, and (18) clinical assessment. In order to assess the respondents’ bodyweight (kg) and height (cm), Tanita Personal Scale HD 319 and Body Meter SECA 206 were used. A pilot study was carried out based on the sample of EBs in some areas of Port Dickson, such as Taman Jimah Jaya, Taman Springhill, and Kampung Sungai Sendayan. The purpose of this pilot study was to examine the skills of interviewers, logistic preparation, scouting activities, central monitoring, and logistic support.
The original language of the questionnaires was Malay. Given that Malaysia has multiethnic populations, the questionnaires were translated into English, Chinese, and Tamil languages in order to facilitate a better understanding. Prior to interview, 150 interviewers, 50 team leaders, and 100 health professionals participated in an 8-day training course. In this 8-day training course, interviewers and team leaders were trained to understand the questionnaires, improve their communication skills, and develop a good teamwork. Questionnaire explanations and mock interviews were covered by the training course. In addition, health professionals were trained to use various clinical equipment and handle respondents with health problems. In order to provide a practical guide and reference, a comprehensive fieldwork manual was prepared. In an effort to improve the reliability of data collection, a thorough quality control of the entire survey was conducted. Field supervisors were appointed to closely monitor the interview and check all the answered questionnaires during the data collection period. More details about the questionnaire were described elsewhere. 21
The dependent variables used in the present study were depression and GAD, which were the most common mental health illnesses.24,25 They were formatted as categorical variables with a dichotomous outcome. The questions used to assess depression and GAD were designed by the Ministry of Health Malaysia. 21 The questions were: “Were you ever depressed or down, most of the time, nearly every day, for 2 weeks?” and “Were you excessively anxious or worried about several routine things, over the past 6 months?” Those who answered “yes” for the first question were considered to have depression, while those who answered “yes” for the second question were considered to have GAD.
The independent variables used in the present study were composed of sociodemographic (income, age, household size, gender, ethnicity, education, marital status, and employment), lifestyle (physical activity and smoking), and health (self-rated health) profiles. Self-reported monthly individual income (in Ringgit Malaysia [RM]) was obtained during the survey. In terms of age and household size, the respondents were asked to declare their date of birth and the number of family members who stayed with them.
The respondents’ ethnic background was recorded and categorized into 4 categories: Malay, Chinese, Indian, and Others. The respondents were asked to report their highest education level. Three categories were formed based on their answers (ie, tertiary, secondary, and primary). In addition, the respondents were asked, “What is your marital status?” and “Are you working currently?” For the first question, the respondents’ answers were grouped into 2 categories: married and unmarried. For the second question, the respondents who answered “yes” were considered to be employed.
The respondents’ physical activity level was assessed based on metabolic equivalents (METs). Those who achieved ≥600 METs minutes per week were considered to be physically active. 26 Few questions related to physical activity were asked, “In the past 7 days, how many days have you done vigorous/moderate physical activity?” and “On the day you carry out the vigorous/moderate physical activity, how long do you do this activity?” The answers were used to calculate METs minutes per week. The question on smoking was straightforward. The respondents who answered “yes” for the question “Do you currently smoke?” were considered as a smoker. In terms of self-rated health, the respondents were asked, “In general, how would you rate your health?” with the answers of “very good,” “good,” “fair,” “not good,” and “very bad.” To facilitate comparisons, the answers were categorized into 3 groups: good (very good or good), fair, and poor (not good or very bad). The indicator of poor health did not depend on the respondents’ responses on how good or bad they felt on medical tests. Hence, there was no correlation between self-rated health outcomes and feeling about medical tests.
Statistical Analysis
Prior to the regression analysis, Pearson’s χ2 test was utilized to examine the associations between depression and GAD, and other variables. In terms of multivariate analysis, a bivariate probit model was used to examine factors associated with the likelihood of developing depression and GAD. Since depression was linked to GAD, the error terms of the regressions for depression and GAD were correlated. Hence, bivariate probit model was appropriate. 27 The marginal effect of each independent variable was calculated. Rho (ρ) was estimated to ensure that the error terms were significantly correlated. Wald statistic was used to determine the overall significance of the model. The significance level was based on a P value of less than .05. All the statistical analyses were performed using Stata statistical software. 28
Results
Out of 16 343 respondents, only 10 141 were used for analyses because some respondents did not report complete information. In other words, the respondents were selected based on the basis of completeness. The average monthly individual income of the total respondent was RM 1653.33. The respondents, on average, aged 41 years and had 4 family members. Less than half (46.11%) of the respondents were males. The ethnic breakdown consisted of 51.78% Malays, 25.43% Chinese, 10.16% Indian, and 12.63% Others. The majority of the respondents had secondary-level education (47.52%), followed by those with tertiary-level (26.39%), and primary-level education (26.09%). A large proportion of the sample was married (68.21%) and employed (64.66%). Considering the lifestyle variables, 61.37% were physically active and 78.80% did not smoke. More than two-thirds (79.99%) of the respondents self-rated their health as good, and only a small proportion self-rated their health as fair (18.17%) and poor (1.84%) (Table 1).
Summary Statistics of Independent Variables. a

Source: National Health and Morbidity Survey 2011. For continuous variables, the values refer to mean and SD. For categorical variables, the values refer to percentage and frequency.
The results of Pearson’s χ2 test showed that depression (2.95% vs 1.78%) and GAD (2.14% vs 1.33%) were more common among females than males. Of all the ethnic groups, depression (5.63%) and GAD (4.27%) were most prevalent among Indians. A higher proportion of unmarried individuals compared with married individuals had depression (3.44% vs 1.92%) and GAD (2.61% vs 1.37%). Approximately, 13.98% and 5.15% of those with poor and fair self-rated health had depression, respectively, compared with only 1.52% of those with good self-rated health. A significantly higher proportion of those with poor (9.68%) and fair self-rated health (3.74%) had GAD compared with those who had good self-rated health (1.13%) (Table 2).
Proportion of Those Having Depression and Generalized Anxiety Disorder (GAD). a

Source: National Health and Morbidity Survey 2011. P values are based on the Pearson’s χ2 test statistic.
The estimated value of
Sociodemographic, Lifestyle, and Health Factors Associated With Depression and Generalized Anxiety Disorder (GAD). a

Source: National Health and Morbidity Survey 2011.
Holding other variables constant, an additional year of age reduced the probability of having depression and GAD by approximately 0.1%. In terms of gender, males were 1.0% and 0.5% less likely to acquire depression and GAD, respectively, than females. Compared with Indians, Malays, Chinese, and Others, on average, had a 1.1% to 2.2% lower probability of getting depression. They also displayed a 0.9% to 1.3% lower probability of developing GAD. Education level was negatively associated with depression. The results showed that individuals who had tertiary- and secondary-level education had a 0.9% to 1.0% lower likelihood of acquiring depression than their counterparts with primary-level education (Table 4).
Marginal Effects of Independent Variables. a

Source: National Health and Morbidity Survey 2011.
Considering unmarried individuals with the same characteristics, married individuals were 0.7% and 0.3% less likely to have depression and GAD, respectively. There were negative relationships between self-rated health and depression, and GAD. Individuals who rated their health as good were 3.8% and 2.1% less likely to have depression and GAD, respectively, than their peers who rated their health as poor. Moreover, setting individuals with poor self-rated health as the reference group, individuals with fair self-rated health had a 1.0% to 1.9% lower likelihood of acquiring depression and GAD.
Discussion
In an effort to acquire wider knowledge of the pattern of mental health illness, factors associated with depression and GAD, such as sociodemographic, lifestyle, and health were examined. Instead of estimating depression and GAD by 2 separate logistic regression models, a single bivariate probit model was used. This was to ensure accurate results. The regression results shared similarities with the outcomes of Pearson’s χ2 test for proportion. The variables that were found to be significant were age, gender, ethnicity, education, marital status, and self-rated health.
A review of previous studies showed that the relationship between age and mental health illness was mixed. Younger individuals were found to be more likely to have depressive symptoms than older individuals.8,12 However, other studies showed that older people had a higher likelihood of suffering from depression than younger people.11,13-15 The results of the present study were not very strong due to poor response rate, but they were consistent with those of Akhtar-Danesh and Landeen 8 and Din and Noor. 12 Thereby, an intervention measure to reduce the prevalence of mental health illness among certain groups of young adults could be considered. The fact and figures that more and more young adults are suffering from mental illnesses in this age of urbanization are suggested to be advertised in social media. 29 The purpose of this advertising is to inform some youngsters that depression and GAD are common diseases of young age.
With reference to the issue of gender, Manaf et al 15 found that males rather than females were prone to suffering from anxiety and depression. However, Akhtar-Danesh and Landeen, 8 Barua et al, 13 and Krishnaswamy et al 9 found that females rather than males had a higher probability of suffering from depression and other mental health disorders. Although the findings of the present study on gender were not very representative, they appeared to be consistent with those of Akhtar-Danesh and Landeen, 8 Barua et al, 13 and Krishnaswamy et al. 9 With regard to policy implication, more attention could be given to females than to males, and in this regard, the government could consider a strategy to lower the stress level among some females. As a recommendation, a campaign that educates certain groups of women about the plausible association between stress and breast cancer could be held frequently. 30 Hence, these women may be more aware of the serious negative consequences of stress and consequently make every effort to reduce their stress level and prevent mental illnesses.
Based on ethnic comparison, Indians rather than Malays, Chinese, and Others were more prone to suffering from depression and GAD. Although findings from this study may not be generalized, they were correlated with those of previous studies.9,17 In order to acquire a better understanding of the relationship between ethnicity and mental health illness, it is imperative that an in-depth qualitative study should be carried out. In light of the findings that some Indians were more likely than Malays, Chinese, and Others to suffer from mental illnesses, a policy output focusing on improving mental health among certain Indians is recommended. Government could provide some Indians with adequate financial supports in an effort to improve their socioeconomic status. A reduction in racial inequality could also be given consideration. It is the government’s responsibility to ensure that all the ethnic groups are given equal ethnic opportunities. However, the effectiveness of such policy should be analyzed in future studies that use more representative data.
The findings of the present study were consistent with those of previous studies that level of education was negatively associated with mental health illness.7,11,19 This may be because education improved individuals’ knowledge about the consequences of diseases, as well as techniques to improve health. Overall, based on such results, some less educated people could at least be given attention by policy makers. Education programs about mental illnesses and how to reduce stress could be established through several multilingual media, so that some less educated people can easily gain access to information on mental health.
On another dimension, being married instead of unmarried was associated with a reduced likelihood of suffering from depression and GAD, which was similar to the findings of previous studies.7,8,16,17,20 Due to data limitation, the causality between marital status and mental health illness was not tested, thereby, how marriage could improve mental health over time remained poorly understood and warranted a detailed longitudinal study to look into this phenomenon. Nonetheless, our findings call for policy makers to pay special attention to some unmarried individuals. Government is urged to fund a counselling association that is managed by professional counsellors with the aim of offering free counselling services for unmarried individuals who have mental health disorder. Furthermore, the advantages of being married could be well highlighted in non-nationwide mental health related campaigns. While this policy that aims at promoting marriage may seem desirable, it should be implemented with caution as it may encourage early marriage with dire consequences.
Apart from sociodemographic factors, our findings suggested that self-rated health was associated with depression and GAD among certain amount of population. Previous studies showed likewise that poor health was associated with mental health disorders.12,15 This indicated that individuals with poor health suffered from a low quality of life and more stress. 11 The indicators of quality of life were physical symptoms, physical well-being, psychological well-being, existential well-being and support issues. 31 While findings of the present study could not be generalized, they somewhat supported findings of previous studies. In order to examine the relationships between health profiles and mental health illness in great detail, other health-related variables, such as being diagnosed with noncommunicable diseases and presence of health risk factors should be included in the analysis and a larger sample size should be used. Based on our findings, policy makers could focus on some individuals who have poor health in order to reduce the prevalence of mental health illnesses. Two intervention strategies are recommended. First, public health administrators could focus on improving health of some population by introducing health promotion programs. Second, government may consider improving the well-being of some ill people by providing them with adequate medical necessity and other needs.
A limitation of the present study is the reduction in the usable data. The data used in the present study are only represented by 56.8% of respondents because of incomplete information reported by some. Hence, the findings cannot be generalized. Several recommendations for future study are highlighted. First, with data availability, the causal relationships between mental health and sociodemographic, lifestyle, and health variables could be examined. Second, other variables that could affect depression and GAD, such as work stress and history of family mental health illnesses could be taken into account. Overall, the present study had provided key contributions to literature, as well as made important suggestions for policy development. With a high-quality data and relevant findings, this study had enabled a better understanding of mental health illness and its impacts on depression and GAD.
Conclusion
In light of the seriousness of mental health issue in Malaysia, the objective of the present study was to examine sociodemographic, lifestyle, and health factors associated with depression and GAD among Malaysian adults. The research question was that what kind of population were more or less likely to suffer from depression and GAD. This study found that younger adults, females, Indians, less educated people, unmarried individuals and individuals with poor self-rated health were more likely to develop depression and GAD. There were sociodemographic (age, gender, ethnicity, education, and marital status) and health (self-rated health) profiles that were significantly associated to the risk of depression and GAD. These findings may be utilized to enable policy-making decisions and policy outputs for the benefit of patients in Malaysia with mental health illnesses.
Footnotes
Acknowledgements
The authors would like to thank the Director General of Health, Malaysia for his permission to use the data from the National Health and Morbidity Survey 2011 and to publish this paper.
Declaration of Conflicting Interests
The author(s) declared no potential conflicts of interest with respect to the research, authorship, and/or publication of this article.
Funding
The author(s) disclosed receipt of the following financial support for the research, authorship, and/or publication of this article: This research received funding from the Fundamental Research Grant Scheme (FRGS) (KOD SO 14218), which is sponsored by the Ministry of Education Malaysia.