
Abstract
Objectives:
To assess how social risk factors and socioeconomic status (SES) affect health care costs at a large, integrated health system of 45 clinics in Iowa, Minnesota, and Wisconsin.
Methods:
We retrospectively reviewed administrative patient cost data from January 1 through December 31, 2022. Social risk factors (lack of financial resources, food insecurity, intimate partner violence, unmet transportation needs, and housing instability) were determined with patient questionnaires. Cost z-scores were compared across all risk-factor quartiles. We used a housing-based measure to objectively determine SES.
Results:
We analyzed data from 410 624 patients empaneled with 689 family medicine clinicians. Self-reported risk factor data were incomplete for 219 321 patients. Costs were higher for those with higher social risk (mean cost z-score: high risk = 0.38, low risk = 0.11; P < .001). In addition, higher costs were associated with increasing age, greater medical complexity (higher Adjusted Clinical Group scores), White race, and lack of financial resources. Although we observed geographic variations in cost, urban and rural locations did not have significant cost differences. Costs were similar across all quartiles of SES, and the absolute difference in cost z-scores between the highest and lowest SES quartiles was only 0.04. The multivariate analysis, which adjusted for age, medical complexity, race, sex, and objective SES, showed that these specific associations were substantially decreased and no longer significantly associated with mean cost z-scores.
Conclusions:
Patient-reported social risk factors were significantly associated with increased cost of care in a large, multispecialty health system in the midwestern US. These associations were decreased in the multivariate analysis. Results should be interpreted cautiously for readers outside the midwestern US, given potential responder bias and the racial homogeneity (92% White) of the study cohort.
Keywords
Introduction
Social determinants of health (SDOH) have been described in the sociological and public health literature for decades.1 -3 SDOH are nonmedical factors that significantly affect health outcomes. These SDOH are largely social conditions or dynamics, often referred to as social risk factors, that can adversely impact the well-being of individuals, communities, and entire societies. A robust body of evidence supports the notion that, particularly in the US,4 -6 health can be negatively affected by such social risk factors, which include inadequate finances, unemployment, lack of education, and high-risk living conditions. 7 Access to and quality of medical care are not the only predictors of health outcomes—importantly, the context in which patients live their lives is the strongest predictor of outcomes.4,8 In short, social risk factors can predispose individuals to many diseases. 9
Despite having one of the highest health care expenditures per capita in the world, the US has some of the worst health outcomes among high-income countries. 10 Health care costs continue to increase at a rate that outpaces inflation, and costs remain an obstacle to appropriate health care access for many. 10 Although the main contributors to health care costs are health care service utilization and pricing, 11 social risk factors have a major effect on an individual’s health and health care use.12 -14 Health care institutions are increasingly screening patients for social risk factors in response to recent regulatory changes. 15 By incorporating social risk screening results into electronic health records (EHRs), health care institutions and researchers can examine the associations among patient-reported social risk factors, health outcomes, health care utilization, and cost. 16 Limitations of patient-reported social risk data include lack of standardization, missing data, and biased answers.17 -20 Additionally, patient-reported data often lack contextual information regarding social risk. To address the limitations in patient-reported data, a housing-based measure of socioeconomic status (SES) (HOUSES index) has been developed. 21
Prior academic work using the HOUSES index in a midwestern US population has shown strong associations between lower SES and poorer health outcomes, including higher hospitalization risk, suboptimal diabetes control, and reduced advance care planning.22 -25 These findings build upon a broader body of literature that emphasizes integrating SDOH into health care delivery to improve outcomes 26 and reduce health inequities. 27 Based on this established regional and international evidence, our study sought to provide a more current and comprehensive understanding of additional social risk factors and their relationship to the cost of care within an integrated health system during and after the COVID-19 pandemic.
Health care systems must identify and address the substantive effect of social risk factors on overall individual health status to improve the quality of health care and to decrease the cost of its provision.28,29 Thus, the primary objective of this study was to assess the associations of specific patient-reported social risk factors and the HOUSES index with the cost of care at a multispecialty health system in the midwestern US to determine how social risk factors affected the cost of care. We hypothesized that individual patient-reported social risk factors would be significantly associated with higher cost z-scores in an unadjusted model. We also wanted to measure how medical complexity (determined by Adjusted Clinical Group [ACG] scores) affected cost in a multivariate model. In addition, this study was undertaken to compare 2 distinct approaches to risk identification: (1) active screening using a subjective, patient self-report questionnaire and (2) passive screening using an objective, housing-based SES index. The latter addresses limitations of patient-reported data by providing accurate, individual SES information that can be calculated for nearly all patients, without requiring active reporting.
Methods
This retrospective study of administrative cost data was reviewed by the Mayo Clinic Institutional Review Board and deemed exempt under 45 CFR 46.104d, category 4. We confirmed that patients had provided Minnesota law—required prior research authorization 30 before data were extracted from patient records. Only those patients who had not denied access to their health records for research purposes were included in the analysis. The reporting of this study follows STROBE (Strengthening the Reporting of Observational Studies in Epidemiology) guidelines. 31
Study Setting and Patient Identification
Our integrated health system has 16 hospitals, 45 multispecialty clinics, and 1 mobile health clinic that are located in Iowa, Minnesota, and Wisconsin. The facilities are primarily regional medical centers and rural clinics, although patients requiring more specialized care may be referred to a tertiary academic medical center. Altogether, this health system serves (more than 600 000 patients annually, and patients have varying socioeconomic backgrounds.
We identified 689 family medicine clinicians (408 physicians, 281 advanced practice providers) in our health system who had a patient panel during the study period. We identified individual adult patients (age ≥18 years) who were empaneled with family medicine clinicians and seen from January 1 through December 31, 2022. Of the 438 484 potentially eligible empaneled patients, we excluded 27 860 (6.4%) because HOUSES index values could not be calculated. Some of the common reasons for not calculating the index include patient addresses mapping to nonresidential locations (eg, a post office box), invalid or incomplete addresses (unable to link the address to a property record), and missing or outdated public records.22,23 Patient data were deidentified to mitigate bias. The study size was determined by the number of eligible patients empaneled in primary care in our health system.
Social Risk Questionnaires and Cost Data Collection
We collected social risk data through EHR questionnaires. Our health system uses a standardized process for social risk screening, thereby simplifying the data collection process. The questionnaires assessed 5 social risk domains: lack of financial resources, food insecurity, intimate partner violence, unmet transportation needs, and housing instability. Patients completed questionnaires either through the Mayo Clinic online patient portal during a virtual visit or with an electronic tablet provided to the patient during an in-person clinic visit. No financial incentives were offered to patients for participating. Social risk questionnaires were sent to patients once every 6 to 12 months for updates, based on their birth date or if they had an upcoming appointment. The last recorded score was used in the analysis.
We calculated the total cost of care from billing data for each patient during the 12-month period by considering clinic visits, emergency department visits, hospitalizations, readmissions, and specialty visits. Total costs are reported as standardized z-scores, where 0 represents the mean value for the population, and a standard deviation above or below the mean is represented by a +1 or −1 change in z-score, respectively.
We used the Johns Hopkins ACG modeling system to assign medical complexity scores for the patients’ clinical diagnoses. 32 This tool categorizes patients on the basis of their health care needs, rather than by their diagnoses.
We investigated the relationship between individual SES and cost by using the HOUSES index. This index is an objective and accurate measure of individual SES that was developed using public housing data from county assessor offices. Public housing data include individual home size, estimated unit value, number of rooms, and number of bathrooms, and these data are widely available for US residential addresses. 21 Each property item corresponding to an individual’s address is standardized into a z-score, and a composite z-score is calculated for each property. A z-score is the measure representing the number of standard deviations between a data point and the mean. A higher z-score represents a higher SES estimate for the patient. The HOUSES z-scores were stratified into quartiles, with quartile 1 representing the lowest SES and quartile 4 representing the highest SES.
Statistical Methods
Demographic characteristics are reported with the total number of patients in each category, and the cost z-score (mean [SD]) is reported for each category. Patient records that were missing the HOUSES index were excluded from the analysis. No sensitivity analysis was performed. We used the Kruskal-Wallis test to determine whether z-scores differed by demographic category. We also reported cost z-scores for each social risk factor and used the Kruskal-Wallis test in a univariate analysis to determine whether cost z-scores differed among risk categories.
We used univariate and multivariate linear regression models to assess the effect of the social risk factor on total cost z-scores. Each social risk factor (lack of financial resources, food insecurity, intimate partner violence, unmet transportation needs, housing instability) was analyzed in a separate model to avoid multicollinearity problems and to avoid including only the patients who had reported data for all SDOH factors. We used variance inflation factors (VIFs) to test for multicollinearity, and VIFs ranged from 1.1 to 5.2. Further, the correlation coefficient between financial resources and food insecurity was 0.6, which also supported the decision to model factors separately. The multivariate linear regression models also adjusted for age, ACG risk score, sex, race, and HOUSES index quartiles. Age and ACG risk score were kept as continuous variables in the multivariate model. All 5 interaction terms were tested, and only food insecurity and intimate partner violence were retained because they were statistically significant (P < .001 for both). Thus, for the models of food insecurity and intimate partner violence, we added an interaction between the social risk factor and the ACG risk score. Estimates and their standard errors are reported for the linear regression models. Patients missing data for at least 1 SDOH factor and those who had complete SDOH data were compared across demographic characteristics to assess where sample bias may have affected the results (Supplemental Material). P values less than .05 were considered statistically significant for all analyses. Analyses were completed using SAS statistical software (version 9.4; SAS Institute Inc).
Results
In total, 410 624 adult patients were included in this analysis. Patient demographic characteristics are summarized in Table 1. The mean (SD) age was 51.1 (19.7) years. More than half the patients (n = 222 436 [54.2%]) were female, and most (n = 377 838 [92.0%]) were White. Cost z-scores progressively increased with age, with an approximate midpoint (z-score of 0) in the 50- to 59-year age group. Greater medical complexity (ie, higher ACG scores) was associated with higher cost z-scores, as was White race (relative to other racial groups). Although we observed geographic variation in cost z-scores, urban and rural locations did not have significant cost differences. Cost z-scores were similar across all quartiles of the HOUSES index, but they were slightly lower among those in quartile 4, which corresponded to the highest SES. However, the absolute difference in z-scores between the highest and lowest SES quartiles was only 0.04.
Demographic Characteristics of Adult Patients Empaneled in Family Medicine (N = 410 624).

Abbreviation: HOUSES, housing-based measure of socioeconomic status; SES, socioeconomic status.
Percentages were calculated using the number of patients with available data as the denominator. The “Missing data” group percentages were calculated using the full cohort (N=410,624) as the denominator.
Kruskal-Wallis test.
Continuous variable in the multivariate model.
The “Missing data” groups were not considered in the P value calculations.
Patients were stratified by risk level for each SDOH, and cost z-scores for each risk group are presented in Table 2. The proportion of patients in high-risk SDOH categories ranged from 3.0% for unmet transportation needs to 9.4% for housing instability. High-risk categories were associated with greater mean cost z-scores, and the greatest costs were associated with a lack of financial resources (mean cost z-score: 0.38 for high risk, 0.11 for low risk) and unmet transportation needs (mean cost z-score: 0.45 for high risk, 0.12 for low risk). The extent of missing data varied for each social risk factor (from 44.9% [unmet transportation needs] to 48.9% [housing instability]). For each SDOH, mean cost z-scores were lowest for the “missing data” groups.
Cost z-Scores for Adult Patients Empaneled in Family Medicine, Stratified by SDOH Risk Level (N = 410 624).

Abbreviation: SDOH, social determinant(s) of health.
Percentages were calculated using the number of patients with available data as the denominator. The “Missing data” group percentages were calculated using the full cohort (N=410,624) as the denominator.
Kruskal-Wallis test.
The “Missing data” groups were not considered in the P value calculations.
Each social risk factor was considered separately in the linear regression analysis that adjusted for age, ACG risk score, sex, race, and HOUSES index quartiles (Table 3 shows the univariate model; Table 4, the multivariate model). In the adjusted analysis, all relationships between social risk factors and cost z-scores were substantially attenuated. Specifically, lack of financial resources, unmet transportation needs, and housing instability were no longer significantly associated with mean cost z-scores. Although food insecurity and intimate partner violence remained significantly associated with z-scores in the adjusted analysis, their effects on cost were minimal.
Univariate Linear Regression Model for Cost z-Scores.

Abbreviations: ACG, Adjusted Clinical Group; NA, not applicable; SDOH, social determinant(s) of health.
Multivariate Linear Regression Models for Cost z-Scores.
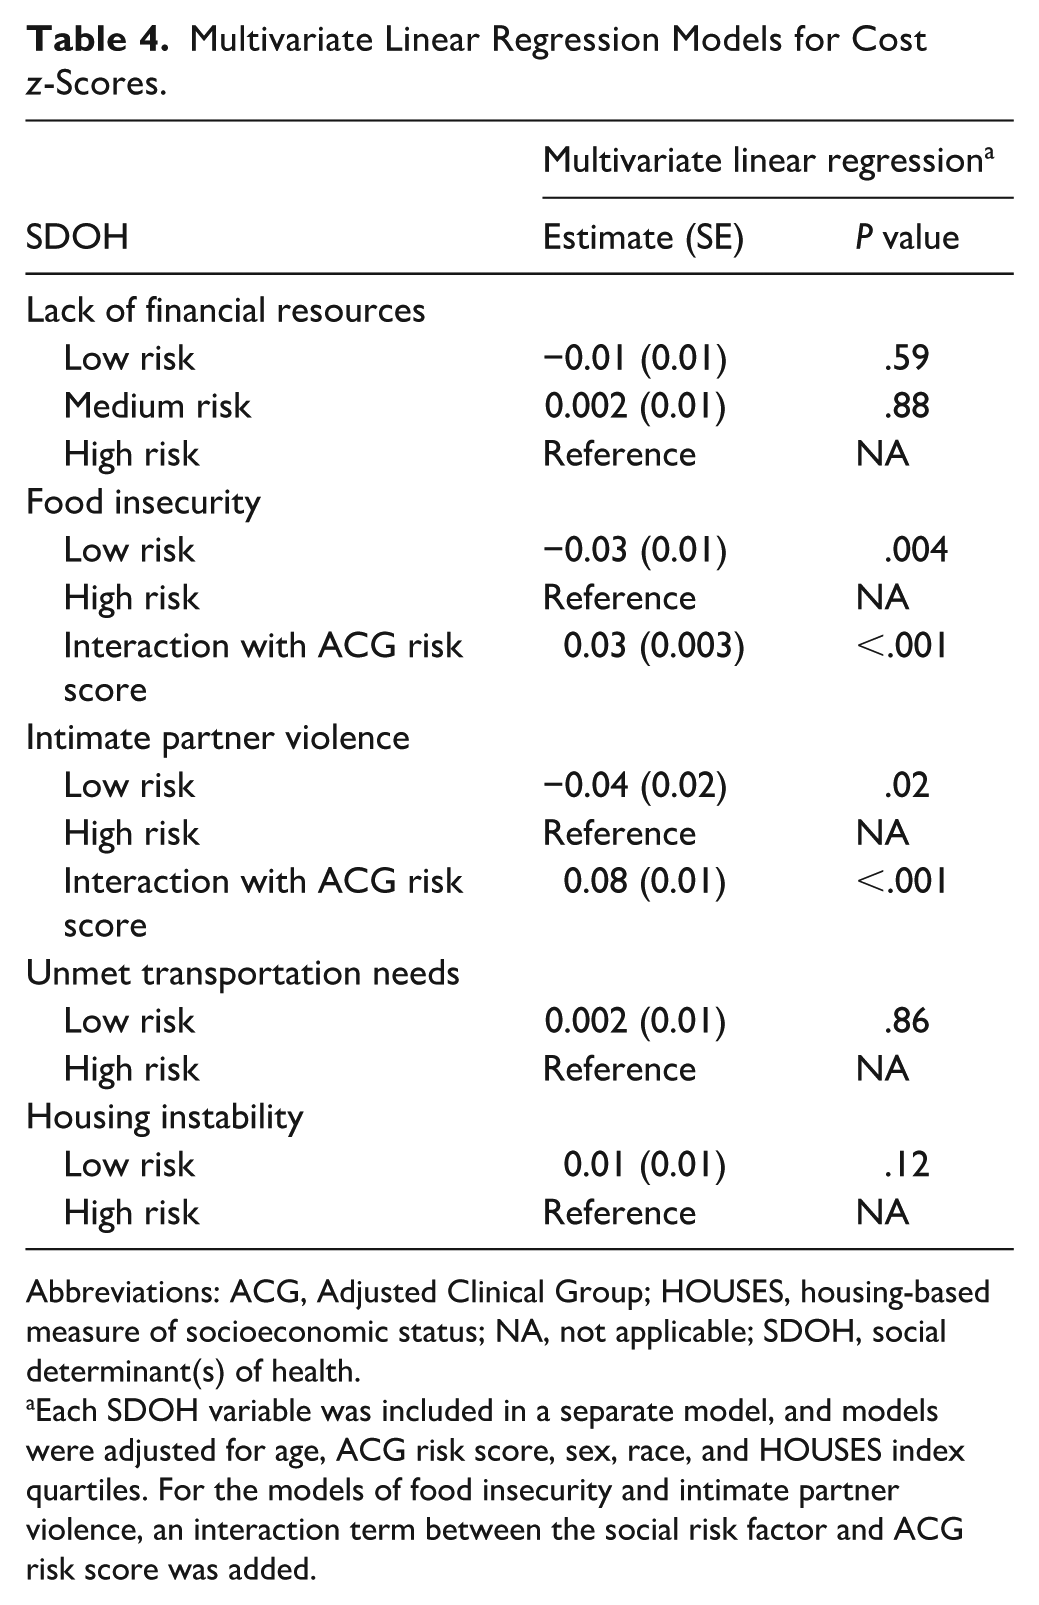
Abbreviations: ACG, Adjusted Clinical Group; HOUSES, housing-based measure of socioeconomic status; NA, not applicable; SDOH, social determinant(s) of health.
Each SDOH variable was included in a separate model, and models were adjusted for age, ACG risk score, sex, race, and HOUSES index quartiles. For the models of food insecurity and intimate partner violence, an interaction term between the social risk factor and ACG risk score was added.
Many patients did not have complete SDOH data. Table 5 summarizes differences between patients who were missing data for at least 1 SDOH factor and those who had complete SDOH data. Compared with patients who had complete data, those with missing data more commonly were younger, had lower ACG risk scores, and were male. Those in the lowest HOUSES index quartile were overrepresented in the group that was missing data (full population, 20.5%; missing-data group, 22.8%). The group with missing SDOH data had a higher percentage of patients from racial and ethnic minority backgrounds, as compared with those who had complete SDOH data.
Demographic Characteristics of Adult Patients, Comparison of Groups With Complete vs Partial SDOH Data.

Abbreviations: HOUSES, housing-based measure of socioeconomic status; SDOH, social determinant(s) of health; SES, socioeconomic status.
Percentages were calculated using the number of patients with available data as the denominator. The “Missing data” group percentages were calculated using the total listed in the column heading as the denominator.
χ2 test.
Continuous variable in the multivariate model.
The “Missing data” groups were not considered in the P value calculations.
Discussion
This study showed that patient-reported social risk factors, particularly economic factors, were significantly associated with an increased cost of care for patients empaneled with a family medicine clinician at a multispecialty health system in the midwestern US. These associations were notably weakened after adjusting for clinical and demographic factors. Across all 5 social risk factors, patients with higher risk had higher costs. After adjusting for medical complexity (ACG scores), the greatest cost increases were associated with a lack of financial resources (the difference in mean cost z-scores between the high-risk and low-risk subgroups was 0.27) and unmet transportation needs (mean cost z-score increase of 0.33). Further, only food insecurity and intimate partner violence remained statistically significant predictors in the adjusted model, and their effects on cost were minimal.
These findings align with those from a recent, large study of national survey data 33 and with prior evidence showing that chronic disease management is influenced by economic stability (ie, patients with lower income levels more commonly have multiple comorbid conditions). 34 Our data further emphasize that these risk factors contribute to the overall cost of care and thus must be addressed with interventions aiming to decrease costs and make access to health care more affordable for all. 35
Patient-reported data (active screening) categories outperformed the passive, objective, HOUSES index in identifying patients with increased risk of higher medical costs. Despite the attenuation noted in the multivariate model, patient-reported data are valuable for targeted intervention within the clinic setting.
Current evidence suggests that early childhood education, housing, urban planning and community development, employment, and income enhancements are most likely to improve social risk factors and subsequently improve individual health outcomes. 7 In turn, individual cities and countries have instituted some features of a universal basic income (an unconditional, guaranteed minimum income) for residents for this very reason. 36 Preliminary findings in these communities show improved health and financial outcomes. The authors of 1 income study also noted the relationship between income volatility and poor health outcomes and posited that a guaranteed income could be a powerful public health intervention. 37
Importantly, in our sample, we had patient-reported social risk factor data for only slightly more than 50% of our sample. The partial dataset reflects our dependence on the patient providing this information and highlights the need for further study regarding the most effective and consistent way to gather this important information from our patients because current practices are heterogenous. 17 Accurate information about social risk factors will better identify those patients or groups at risk for poor health outcomes. The HOUSES index is 1 tool that can help in this regard because (1) it does not require patients to actively report data, (2) it can be calculated for any patient with a home address, and (3) it has a proven track record, with prior studies showing a link between SES and various disease outcomes and health care use.22 -25 Passive screening for social risk factors can be used accurately in clinical practice, 19 although in the current study, risk categories based on patient-reported data outperformed the passive HOUSES index in identifying patients with increased risk of higher medical costs. However, in the adjusted analysis, the associations of individual social risk factors with cost were substantially attenuated, indicating that SDOH may be less important than age, sex, race, and medical complexity in determining the cost of care.
The study took place during the COVID-19 pandemic, a period in which US medical care patterns were shifting markedly. Ambulatory volumes decreased and then only partially rebounded, with modality and service-mix changing. 38 Preventive services and cancer detection protocols were disrupted: early-stage diagnoses decreased in 2020, and screening recovery remained incomplete from 2021 through 2023. 39 Elective procedures were also curtailed during pandemic surges, thereby altering use and spending. 40 Multiple studies have shown that pandemic-era telemedicine use was stratified by socioeconomic position and access to technology. Eberly et al 41 showed that patients with lower income, Medicaid coverage, limited English proficiency, and residences in areas with poorer broadband internet access were associated with less video use and fewer completed telemedicine visits overall. Racial and ethnic differences in telemedicine usage persisted throughout the pandemic. 41 Broader evidence also documents socioeconomic and demographic inequalities in care disruptions during the pandemic. 42 These patterns are consistent with our finding that social risk factors are associated with higher costs; however, pandemic-related access differences may have contributed to cost variation across risk strata in 2022.
Our study was limited by several factors. Only patients who self-reported social risk factors were included. In addition, we were missing data for patient-reported social risk factors. Patients with missing social risk factor data are more likely to engage irregularly or sporadically in their care. By excluding them from the analysis, we compared health care costs of patients who engaged more regularly in their care and thus had higher costs of care in general. As a group, those with missing data for the 5 patient-collected social risk factors had lower cost z-scores (−0.14 to −0.16), likely due to responder bias, which may have inflated the cost for those classified as high risk. However, those with missing data for the HOUSES index, which is not influenced by responder bias, had a cost z-score slightly greater than the mean (0.04). Another limitation is that our patient population is racially homogenous (92% White), and results may not be applicable to different racial or ethnic groups. Additionally, the HOUSES index potentially excluded highly vulnerable patients (eg, those who are unhoused).
Future work in this area should assess patient populations with greater ethnic diversity to (1) determine how these risk factors affect cost in different communities and (2) potentially identify further socioeconomic inequalities. Further development of tools that passively collect social risk factor data, similar to the HOUSES index, is necessary to collect more complete information and to address the significant missing data and responder bias in patient-reported questionnaires. Our adjusted analysis showed that medical complexity appears to outweigh the individual social risk factors in driving overall cost. Future research should focus on how to integrate consideration of social risk factors into chronic disease management.
Conclusion
Patient-reported social risk factors were significantly associated with increased cost of care in a multispecialty health system in the midwestern US. In our cohort, the greatest costs were associated with a lack of financial resources and unmet transportation needs. Racial and ethnic minorities were underrepresented in our study population, and more work is needed to capture information from these patient groups. To help decrease the high cost of patient care, more work is needed to determine how to consistently and efficiently collect patient and population social risk factor data so that the best approaches to decrease these risks can be determined.
Supplemental Material
sj-pdf-1-jpc-10.1177_21501319261431146 – Supplemental material for Social Risk Factors and Their Effect on Health Care Costs in a Midwestern Health Care System
Supplemental material, sj-pdf-1-jpc-10.1177_21501319261431146 for Social Risk Factors and Their Effect on Health Care Costs in a Midwestern Health Care System by Matthew E. Bernard, Jessica L. Sosso, Dominika A. Jegen, Summer V. Allen, Karen M. Fischer, Gerald J. Sobolik, Jadyn R. Dickes, Randy M. Foss, Julie A. Maxson, Gregory M. Garrison, Michelle A. Lampman and Tom Thacher in Journal of Primary Care & Community Health
Footnotes
Acknowledgements
June Oshiro, PhD, ELS, Mayo Clinic, substantively edited the manuscript. The Scientific Publications staff at Mayo Clinic provided proofreading, administrative, and clerical support.
ORCID iDs
Ethical Considerations
This study (protocol 22-003643) was reviewed by the Mayo Clinic Institutional Review Board and deemed exempt under 45 CFR 46104d, category 4.
Consent to Participate
Only patients who authorized use of their health records for research were included in the study.
Author Contributions
Matthew E. Bernard, MD: Conceptualization; methodology; supervision; visualization; writing, original draft; and writing, review and editing. Jessica L. Sosso, MD, MPH: Conceptualization and writing, review, and editing. Dominika A. Jegen, MD: Writing, review, and editing. Summer V. Allen, MD: Writing, review, and editing. Karen M. Fischer, MPH: Data curation; formal analysis; and writing, review, and editing. Gerald J. Sobolik, MBA: Data curation and formal analysis. Jadyn R. Dickes: Data curation and formal analysis. Randy M. Foss, MD: Writing, review, and editing. Julie A. Maxson, CCRP: Project administration and writing, review, and editing. Gregory M. Garrison, MD: Formal analysis and writing, review, and editing. Michelle A. Lampman, PhD: Formal analysis and writing, review, and editing. Tom Thacher, MD: Conceptualization; formal analysis; and writing, review, and editing.
Funding
The authors disclosed receipt of the following financial support for the research, authorship, and/or publication of this article: This study was funded by the Department of Family Medicine, Mayo Clinic (Rochester, Minnesota). The funder had no role in the design, data collection, data analysis, and reporting of the present study.
Declaration of Conflicting Interests
The authors declared no potential conflicts of interest with respect to the research, authorship, and/or publication of this article.
Data Availability Statement
Blinded data are available upon request.
Supplemental Material
Supplemental material for this article is available online.
References
Supplementary Material
Please find the following supplemental material available below.
For Open Access articles published under a Creative Commons License, all supplemental material carries the same license as the article it is associated with.
For non-Open Access articles published, all supplemental material carries a non-exclusive license, and permission requests for re-use of supplemental material or any part of supplemental material shall be sent directly to the copyright owner as specified in the copyright notice associated with the article.