
Abstract
Sociodemographic factors are critical determinants of health outcomes and disparities, yet their documentation in electronic medical records is often sparse and confined to unstructured clinical text. This poses substantial challenges for automated extraction and integration into clinical decision-making. In this study, we systematically evaluate and compare 6 convolutional neural network architectures, including hybrid models that integrate traditional classifiers, for binary classification of multiple sociodemographic characteristics from EMR text using data from 4375 patients across 96 primary care clinics. The goal was to assess how model complexity and lexical diversity influence classification performance. Manual annotation achieved high inter-rater reliability (kappa: 0.98 for documentation status, 0.96 for documented information). We report performance using F1 score, precision, recall, area under the precision-recall curve, and Matthews correlation coefficient. Results showed that simpler architectures, particularly a single-layer CNN, consistently outperform deeper or hybrid models across most characteristics (F1 score: 90.99%), especially under conditions of data imbalance and varied documentation patterns. While hybrid models offered gains for well-documented factors like marital status, they were less effective for sparse or diverse characteristics. These findings provide a practical framework for developing efficient, interpretable clinical NLP pipelines and inform model selection strategies for real-world health equity and EMR research applications.
Keywords
Introduction
Social conditions expose certain groups to risk factors that can lead to disease onset, producing disease patterns in various populations. 1 One such social construct is the sociodemographic factors of individuals. These factors constitute the social structural conditions that are underlying determinants of health. 2 Extensive research has established associations between sociodemographic characteristics and numerous health outcomes. Race has been linked to mental health, healthcare delivery, cancer, heart failure, and pre-term birth.3-7 Marital status and education are associated with cancer outcomes, Alzheimer’s disease, and healthcare service utilization.3,8-12 Employment status predicts both physical and mental health, with unemployment linked to depression, anxiety, and suicide risk. 13 Sexual orientation and gender identity have been associated with elevated rates of mental distress, depression, substance misuse, and chronic conditions including asthma, chronic obstructive pulmonary disease, obesity, and diabetes.14-19 Understanding these sociodemographic patterns allows for identification of medically relevant risk factors underlying disease causation. If these risk factors are identified and addressed through intervention or prevention, health disparities in affected populations can be reduced. Furthermore, capturing this data at the community level enables population-level health risk prediction. Despite the well-established importance of sociodemographic factors in health outcomes, there is a critical need to improve their systematic identification and extraction from clinical documentation to support equity-driven research, patient-centered care, and accurate risk assessment. As healthcare systems increasingly adopt artificial intelligence to address documentation gaps and support clinical decision-making, understanding which model architectures offer optimal trade-offs in performance, efficiency, and interpretability has become essential.
Data collected through electronic medical records (EMRs) capture services provided by non-physicians, sociodemographic factors, and detailed diagnostic information, enabling a more complete understanding of primary care encounters.20,21 Sociodemographic characteristics documented in EMRs generally include information on place of birth, ethnicity/race, immigration/refugee status, partnership status, sexual orientation, education, and occupation. 22 This information is captured in both structured and unstructured formats. However, many sociodemographic characteristics such as marital status and race are often missing-not-at-random in structured data when compared to unstructured counterparts.23,24 Consequently, unstructured clinical narratives prove to be a rich data source for sociodemographic information. Nevertheless, many challenges come with medical text classification due to high dimensionality, data sparsity, and unstructured format. 25 Furthermore, medical text is characterized by long sentences with normalized medical terminology, poor grammar, and many spelling mistakes. Another challenge is the low prevalence of sociodemographic factors, causing class imbalance between absence and presence of characteristics. Therefore, identification and extraction of sociodemographic data from clinical text remain understudied areas of research. 26
The most common biomedical approach for extracting clinical text combines natural language processing and machine learning. 27 There are 2 main methods used for text classification: traditional machine learning and deep learning approaches. Traditional machine learning approaches are difficult to implement for large-scale training samples and require rigorous feature engineering. 28 Contrarily, deep learning approaches can efficiently represent long-range dependencies through deep hierarchical feature construction. 29 They are composed of multiple processing layers that help discover intrinsic patterns in the data and lessen the burden of feature engineering.30-32 This is especially useful when using free text data in EMRs, as these models can learn rich representations of medical vocabulary. 33 Convolutional neural networks (CNNs) and variations of recurrent neural networks are the most widely adopted deep learning methods for text categorization, as they are well suited for sequential data such as longitudinal patient records and clinical text.30,32,34 Specifically, CNNs have shown impressive results in sentence categorization.35-38
Recent advances in transformer-based language models, such as BERT and its clinical variants (ClinicalBERT, BioClinicalBERT), have significantly expanded the capabilities of natural language processing in healthcare. 39 These architectures employ self-attention mechanisms that enable contextual understanding across long sequences of text, supporting fine-grained tasks such as entity recognition and the extraction of social and behavioral information from complex clinical narratives.40-43 Prior studies have shown that transformer-based models can outperform earlier deep learning architectures, including CNNs and recurrent neural networks, for extracting social determinants of health from electronic health records.10,23 However, these performance gains often come with trade-offs in computational cost, model transparency, and deployment feasibility. Transformer models typically require large-scale infrastructure, substantial memory, and specialized hardware, which may not be available in community or primary care settings. 44
In contrast, convolutional neural networks can achieve competitive performance for localized, sentence-level classification while offering several practical advantages for deployment in resource-limited clinical settings.30,45 They require substantially less computational infrastructure, enable faster inference on standard clinical workstations, and provide more transparent feature representations through filter visualization. CNNs are characterized by local connection, spatial sampling, and weight sharing. 28 The neurons in CNNs use local connections which reduce the number of parameters in the model. Feature representations extracted for training and classification can be obtained using convolution. Spatial sampling is used to reduce feature dimensionality while enhancing robustness. Furthermore, CNNs’ weight-sharing characteristics reduce the complexity of feature extraction and data reconstruction compared to traditional models. These practical advantages motivated our systematic evaluation of CNN-based architectures for sociodemographic information extraction.
Despite the widespread adoption of deep learning for clinical text analysis, no prior study has systematically compared CNN architectures specifically for sociodemographic information extraction from EMRs. Existing work either focuses on isolated classification tasks or relies on complex transformer models without establishing whether simpler, more deployable architectures can achieve comparable performance. This gap is particularly important given that healthcare institutions often face computational constraints and require interpretable, efficient models for clinical deployment. The purpose of this research was to address this gap by conducting the first systematic evaluation of CNN model configurations for sociodemographic information extraction from clinical text, providing evidence-based recommendations for model development practices tailored to this domain. We applied various CNN-based models to categorize text fragments at the sentence level by extracting semantic information from a corpus of medical data. In addition, we integrated our CNN models with traditional machine learning algorithms, including support vector machines and random forests, to assess whether hybrid configurations enhance performance. We investigated 6 variations of convolutional neural network architectures to identify the presence or absence of sociodemographic characteristics in clinical text, comparing them against 2 traditional supervised learning baselines. We explicitly assessed the influence of model complexity on performance, comparing CNN architectures of varying depth and configuration to determine the trade-offs between efficiency, interpretability, and accuracy. We evaluated the models using F1 score, recall, precision, area under the precision-recall curves, and Matthews correlation coefficient. Unlike prior studies that explore isolated classification tasks or assume transformer models are necessary for optimal performance, our comparative approach provides practical guidance for selecting efficient, interpretable CNN architectures for real-world clinical deployment, particularly in resource-limited settings where computational efficiency and model transparency are critical considerations.
Methods
Data Source
This project received research ethics board (REB) approval from the University of Toronto (#40129) and North York General Hospital (#20-0044). The models were evaluated using data from the University of Toronto Practice-Based Research Network (UTOPIAN) Data Safe Haven, a repository containing de-identified EMR data from over 400 family physicians across 96 clinics and approximately 400,000 patients in Ontario. 46 The UTOPIAN database includes records from 3 EMR vendors, which are among the most widely used in family physician practices across the province.47,48 To define the baseline cohort all physicians and their patients that had insufficient or low-quality data were removed. The cutoff for each cycle of data included physicians with less than 20% of billing records, lab records, medication records, and less than 200 rostered patients. Furthermore, the criteria for a patient to be included in the baseline cohort required that their physician’s data quality was sufficient, having a valid age and sex, an EMR start date greater than 1 year from the data extraction cut-off date (unless the patient was less than 1 year of age), populated entries in any of the cumulative patient profile tables provided in the EMR, and be rostered to a physician or had at least 2 family physician visits in the past 3 years. The social history and risk factor sections of the EMR are semi-structured fields that contribute to the summary information found in the cumulative patient profile. These sections typically contain patients’ sociodemographic details and are regularly updated during clinical visits.
The social history and risk factor sections were filled with 561,210 patient entries. The system logs patient data chronologically, with each entry timestamped. However, this sometimes led to duplicate entries for the same patient. To reduce redundancy, we kept only the most recent entry when multiple records started with the same text during preprocessing. As a result, our analyses were based on the most current status of each sociodemographic characteristic examined in this study. The patient cohort used to train the models consisted of adults aged 18 or older as of December 31st, 2021, since characteristics such as marital status and occupation are less likely to be recorded for children and adolescents. We first grouped entries by eligible patients and merged data from the semi-structured fields within the cumulative patient profile section of the EMR. To ensure the sample accurately reflected the UTOPIAN database, we randomly selected 1.5% of patients from each clinic, resulting in a final cohort of 4375 patients. The 1.5% per-clinic sampling rate was chosen to balance computational feasibility with broad representation across 96 clinics, ensuring that smaller clinics contributed proportionally while preventing larger clinics from dominating the dataset. We assessed the representativeness of this random sample by comparing age, sex, and EMR start date distributions to those of the entire database. Additionally, we verified that the sample included all physicians from each clinic and preserved the distribution of patient counts per physician.
A reference standard was created by a trained PhD student who manually labeled social phrases in the cohort using predefined annotation guidelines to produce a dataset for supervised machine learning. The annotation guidelines were developed collaboratively by the clinical team members to ensure clinical relevance and accuracy. The PhD student received dedicated training from the clinical team and was supervised throughout the annotation process. The guidelines included specific examples for each sociodemographic characteristic, explicit rules for handling ambiguous cases, and clear distinctions between patient-specific information and references to family members’ characteristics. Two labels were assigned for each characteristic: one captured the actual documented information from the semi-structured fields, and the other indicated whether that sociodemographic characteristic had been documented at all. Due to resource and budget constraints, a single annotator was used for the primary annotation task. To assess annotation quality and ensure consistency, approximately 5% of the dataset (219 phrases) was double-annotated by the same annotator within the same month, yielding a kappa score of 0.98 for documentation status and 0.96 for the documented information labels, averaged across all characteristics. These high kappa values indicate excellent intra-rater reliability and suggest that the annotation guidelines were sufficiently clear and comprehensive. Figure 1 presents the distribution of each characteristic within the labeled dataset. Due to documentation rates below 3%, race, gender identity, and sexual orientation were excluded from model training because of insufficient data to support effective classification.
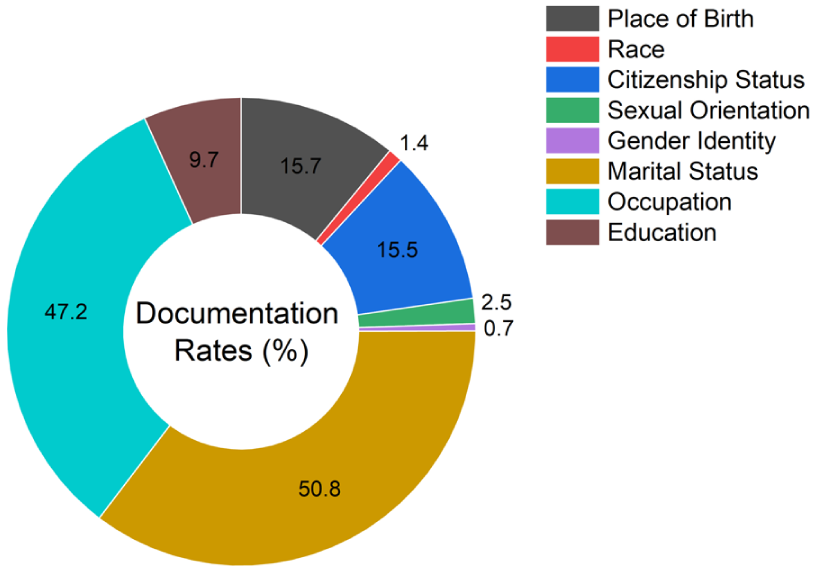
The frequency of documentation for each sociodemographic characteristic in the labeled sample.
Data Preprocessing
Due to common occurrences of misspellings, non-word symbols, abbreviations, and acronyms in clinical text, the retrieved sample had to undergo a series of text preprocessing before being fed to the classification algorithms. First, punctuation, common stopwords (e.g., ‘the’, ‘is’, ‘in’, ‘for’, ‘where’, ‘when’, ‘to’, ‘at’, etc.), non-alphabetic and 1-letter words were removed from the tokenized input text since they do not provide any semantic meaning. Abbreviations and acronyms were preserved in their original form rather than expanded, as the Word2Vec embeddings can learn representations for commonly occurring abbreviated terms, and expansion would risk introducing errors given the high variability in clinical abbreviation usage across different EMR systems and clinicians. The letters were then converted to lowercase and went through a lemmatization process that transformed the words into their root forms. To prepare the data for the word embedding models, the data sequences (clinical text) were truncated to 100,000 tokens based on word frequency to optimize model training. This cutoff was selected based on vocabulary size optimization principles established in prior clinical NLP work, 29 where retaining the most frequent 100,000 tokens captures the majority of semantic information while reducing computational complexity and mitigating overfitting on rare terms. Furthermore, sentences were converted to the same length by applying post padding based on the number of words in the longest sentence. Finally, the categorical target variable (absent/present label) was transformed into numeric values (0/1) using a label encoder.
Classification Modeling
We focused on binary presence/absence classification due to the sparsity, inconsistency, and heterogeneity of value-level documentation in EMRs. This approach reflects a practical and generalizable task aligned with real-world needs, such as flagging under-documented characteristics for manual review or downstream imputation. Transformer-based models such as BERT or ClinicalBERT were not included in this study for several reasons. First, our research objective was to provide the first systematic comparison of CNN architectures for sociodemographic extraction, as these models have not been previously benchmarked in this domain. Second, for binary sentence-level classification tasks, CNNs can achieve competitive performance while requiring substantially less computational infrastructure, an important consideration for deployment in resource-limited primary care and community health settings that may lack access to GPU clusters or cloud computing resources necessary for transformer inference. Third, CNNs offer faster training and inference times, making them more practical for real-time integration into clinical workflows. Fourth, CNNs provide greater interpretability through visualization of activated filters and learned features, which is essential for clinical trust and adoption. While transformer models excel at capturing long-range dependencies in complex, multi-sentence narratives, the sociodemographic characteristics in our dataset were typically documented in short, localized phrases where CNNs’ ability to capture local semantic patterns is well-suited. However, we acknowledge that transformer comparisons would strengthen future work, particularly for more complex multi-class extraction or characteristics requiring broader contextual understanding.
The parameter configuration of the CNN architectures, such as filter region size, learning rate, etc., was tuned for each characteristic based on suggestions from a previous study using Bayesian optimization. 38 The tuned hyperparameters for each model and the assessed characteristics can be found in Table 1. All models utilized pre-trained Word2Vec word embeddings, trained on a corpus of approximately 100 billion words from the Google News dataset. 49 This model contains 300-dimensional vector representations for 3 million words and phrases. This choice was motivated by its widespread adoption in prior EMR and health informatics studies, providing a robust and reproducible baseline for benchmarking CNN architectures.50,51 Many of the sociodemographic terms of interest (e.g., marital status, education, occupation) overlap substantially with general-language usage, making general-domain embeddings appropriate. In preliminary analyses, we also compared Word2Vec with GloVe 52 embeddings and found no significant differences in classification performance, further supporting the suitability of Word2Vec for this task. Nevertheless, future work could explore whether domain-specific embeddings trained on clinical corpora (e.g., MIMIC-III, clinical notes) provide additional performance gains, particularly for characteristics with more specialized medical terminology.
Hyperparameter Tuning Results for Each CNN Architecture and Sociodemographic Characteristic.

We used a weighted binary cross-entropy loss function to account for class imbalance in which each label is inversely weighted based on their frequency in the data. The training was performed using the Adam optimizer. We assessed the most optimal number of epochs for model training including 10, 20, 30, 60, and 100, where we found that 20 epochs produced the best performance without overfitting on the training data. The hidden layers collectively used the ReLU activation function excluding Models D and E which utilized the tanh function. To avoid potential data leakage between the training and testing stages, only singular entries for each patient were incorporated into the patient sample. We used the Keras software package with the TensorFlow backend for model implementation. 53
The dimensionality of the word vectors produced by the word embedding layer is denoted by d. If a sentence has a length of s, the corresponding sentence matrix has a dimensionality of

where

Feature maps are used by CNNs to learn rich representations of the training data and find intrinsic patterns of the sociodemographic information in the text.
We evaluated 6 CNN architectures of varying complexity to systematically assess the impact of model configuration on classification performance. Table 2 provides a comparative overview of these architectures, highlighting their key structural differences and design rationales. Models A and B represent simpler, single-layer architectures with uniform and multi-scale filters respectively. Models C and D explore depth versus width, with Model C employing sequential convolutional blocks and Model D using parallel blocks. Models E and F are hybrid approaches that combine CNN feature extraction with traditional classifiers (support vector machine and random forest, respectively). Detailed descriptions of each architecture follow.
Comparative Summary of CNN Architectures Evaluated in This Study.


The CNN architecture representation of Model A.

The CNN architecture representation of Model B.

The CNN architecture representation of Model C.

The CNN architecture representation of Model D.
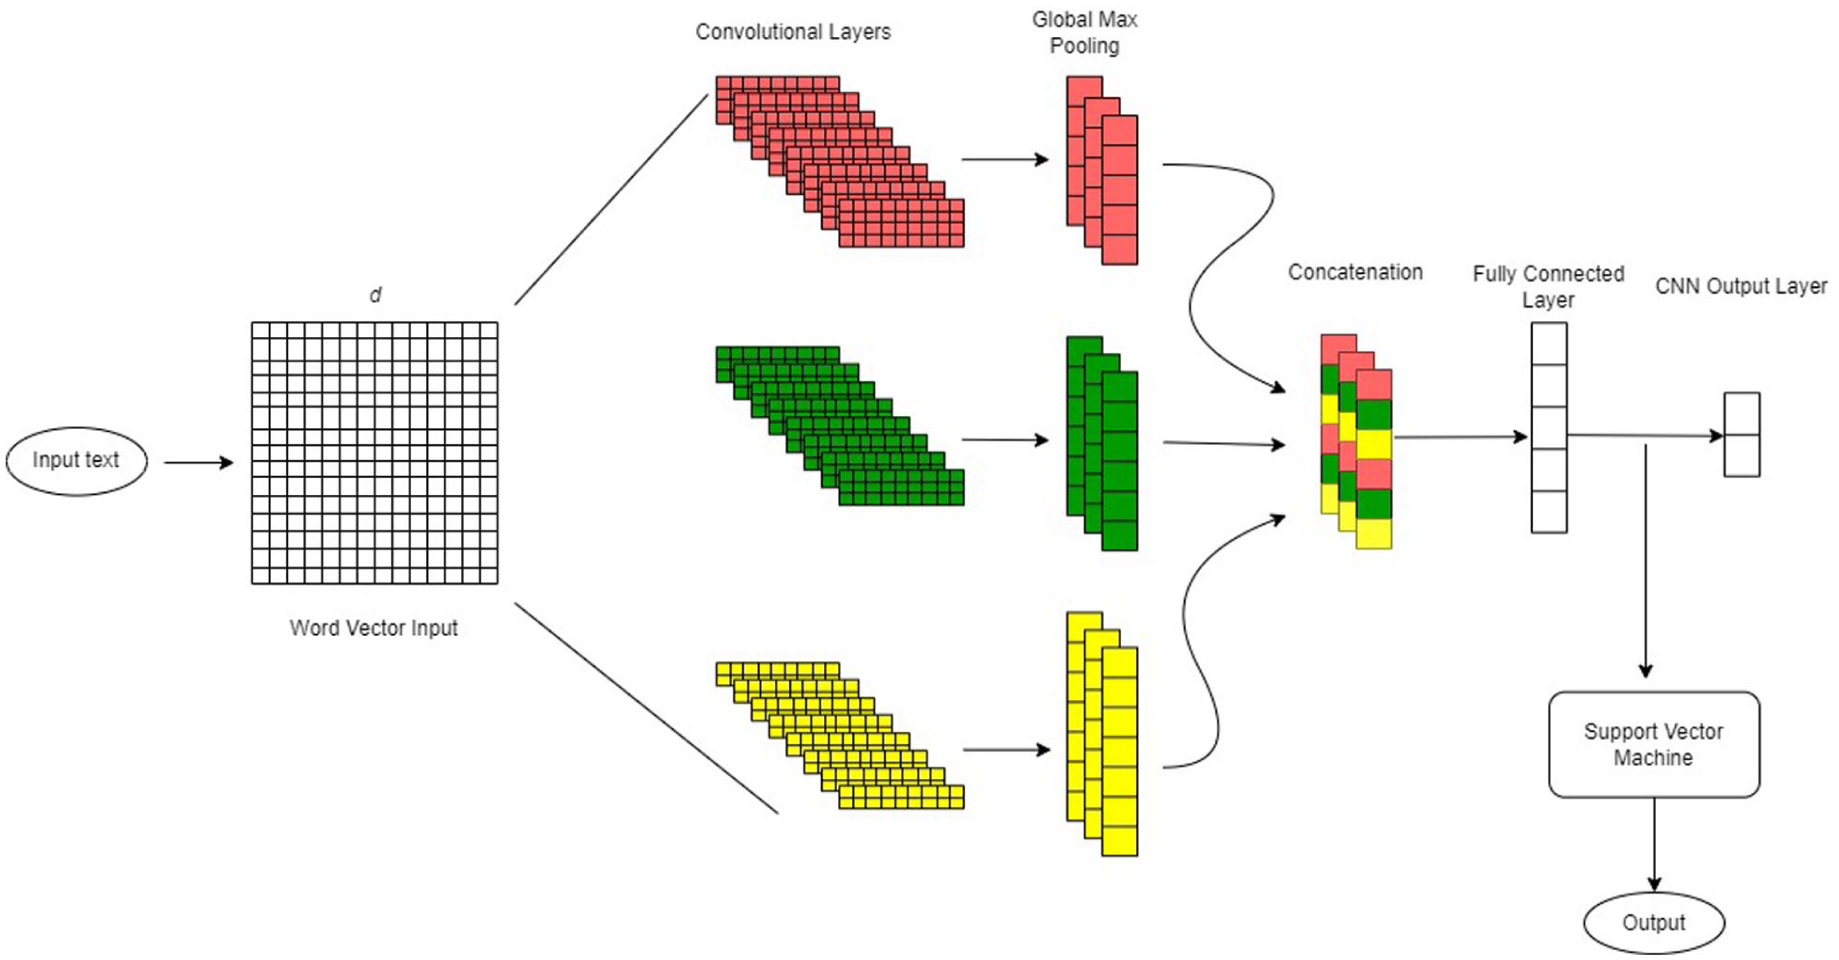
The CNN architecture representation of Model E.
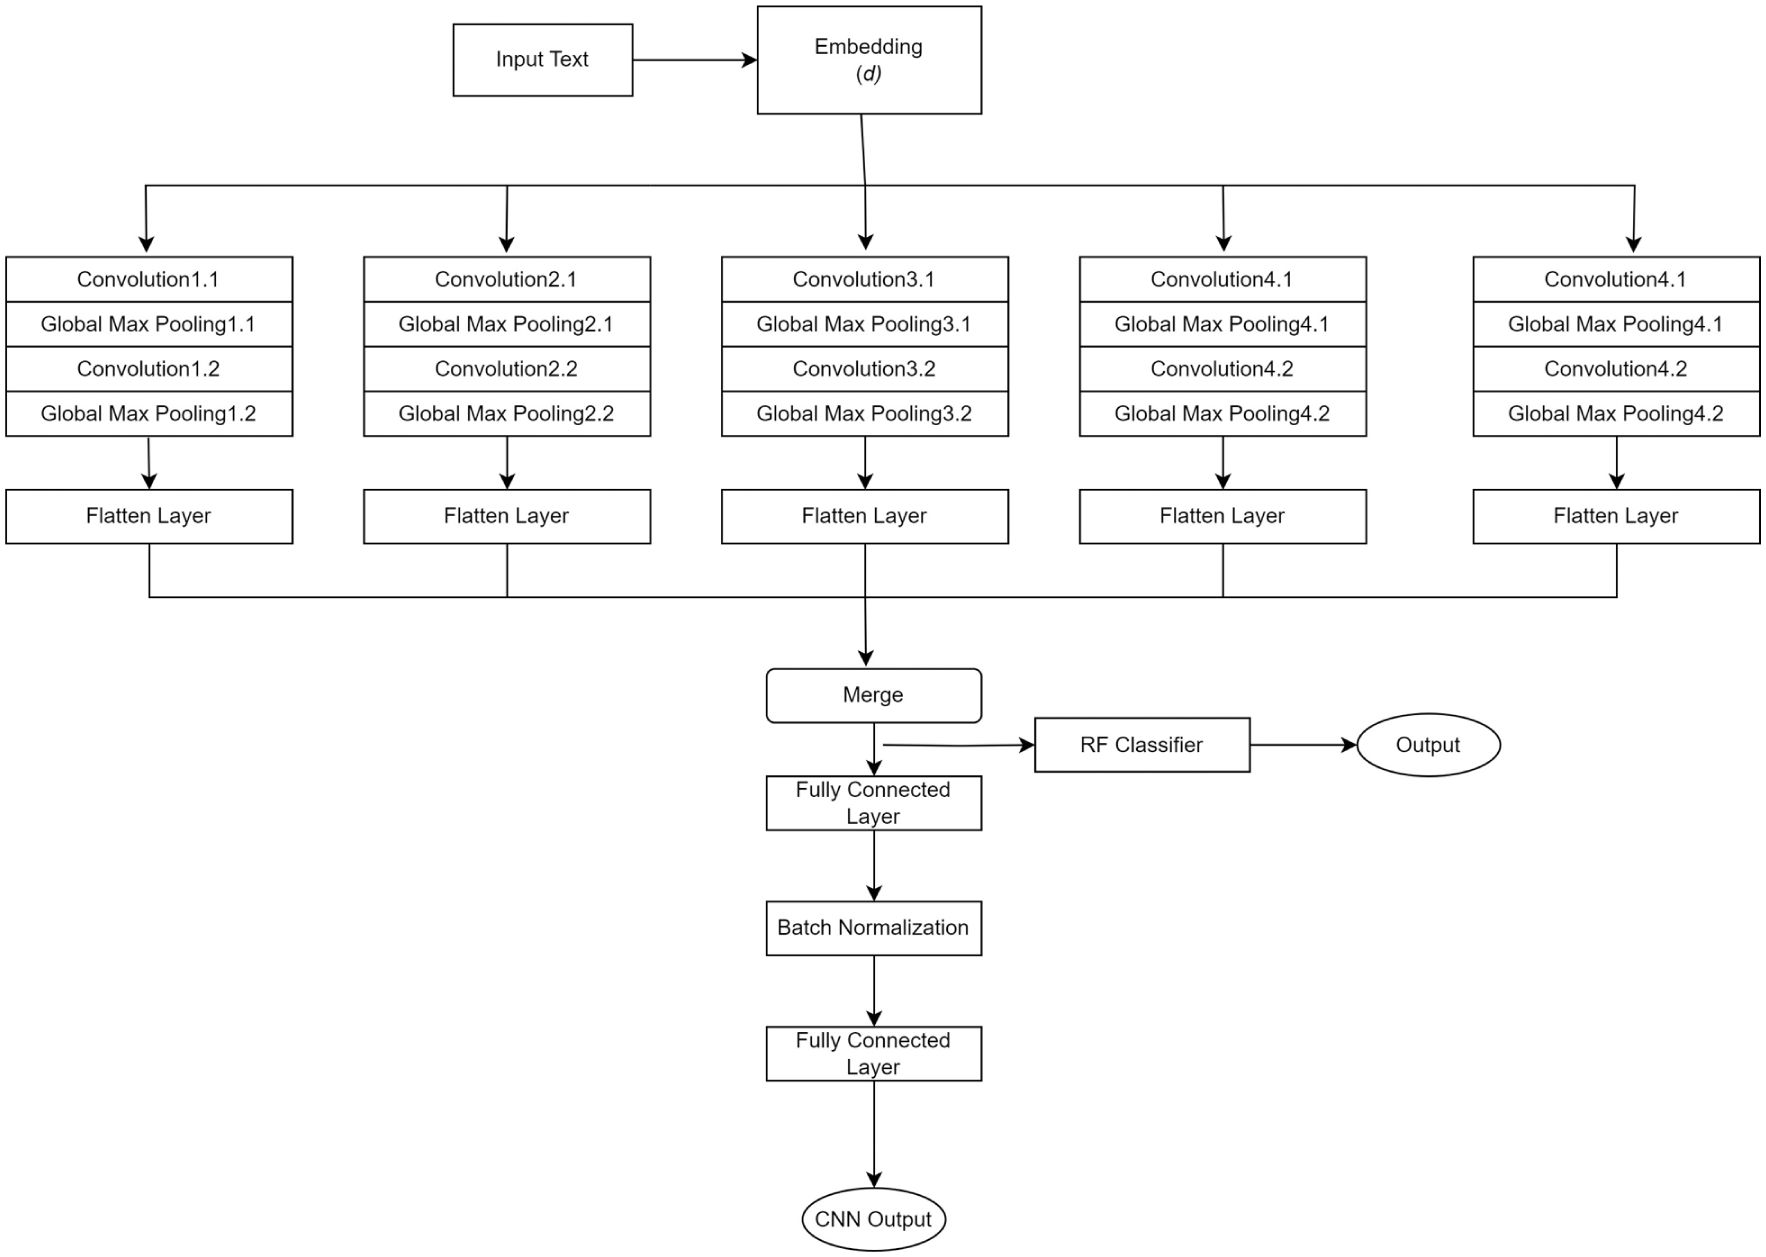
The CNN architecture representation of Model F.
Baseline Models
We implemented 2 baseline models for performance comparisons against our deep neural networks: logistic regression and random forest as these 2 models were found to have the best performance for sentence level classification of social and behavioral characteristics in clinical text.61,62 The models were trained on features derived from term frequency-inverse document frequency representations of the preprocessed text. To enhance performance, Bayesian optimization was used for hyperparameter tuning tailored to each characteristic. Model evaluation was conducted using stratified 10-fold cross-validation to ensure robust performance assessment while addressing class imbalance.
Evaluation Criteria
The primary evaluation metrics were recall, precision, F1 score, area under the precision-recall curve, and Matthews correlation coefficient, computed across all sociodemographic characteristics. 10-fold stratified cross-validation was used to evaluate the generality of model performance. F1 score is generally used to measure model performance for imbalanced datasets as it takes both precision and recall into account. Furthermore, the decision as to whether to optimize precision or recall is dependent on the clinical application which in this case is unknown, therefore, we considered F1 score as the primary evaluation metric.
26
To provide a more comprehensive assessment of model performance, we also reported Matthews correlation coefficient, a metric that evaluates the quality of binary classifications by incorporating true and false positives and negatives. Unlike F1 score, Matthews correlation coefficient is a balanced metric even when the classes are of very different sizes, offering a more reliable indicator of overall performance, particularly in imbalanced datasets. For each performance metric, we report the mean across the 10-folds along with 95% confidence intervals, calculated as mean ± 1.96 × (SD/


where TP represents true positive, TN represents true negative, FP represents false positives, and FN represents false negatives. To compare model performances, the precision-recall curve (PR curve) was used as it is generally preferred for imbalanced classes. 63
To evaluate whether the differences in model performance were statistically significant, we employed a combination of parametric and non-parametric tests, depending on the distribution of the data. Shapiro-Wilk tests 64 were conducted to assess data normality. If normality was satisfied (p > 0.05, for all metrics), we used repeated measures ANOVA, 65 followed by Tukey’s honestly significant difference test 66 to control for multiple comparisons in pairwise model evaluations. If normality was violated, we applied the Friedman test, 67 a non-parametric alternative, with the Nemenyi post-hoc test 68 to identify significant differences while adjusting for multiple comparisons.
Results
As shown in Figure 8, Model A achieved the highest recall (91.8%), F1 score (91.0%), area under the precision-recall curve (95%), and Mathews correlation coefficient (88.1%), indicating a strong balance between precision and recall and high predictive reliability even in imbalanced datasets. Model B performed comparable to Model A, with an F1 score of 90.0%, slightly lower than Model A, but still performed well on all metrics. Model F, on average, had the best overall precision (92.2%) compared to the rest of the models. The more complex models (Models C and D) generally achieved high recall, while the hybrid approaches (Models E and F) tended to have high precision due to the strengths of their traditional classifiers. However, both sets of models often struggled to maintain a balance between precision and recall, leading to lower F1 scores and Mathews correlation coefficient values, which ultimately reflected in their overall performance compared to simpler CNN architectures.

Grouped bar chart comparing 10-fold average (in percentage) of recall, precision, F1 score, area under the precision-recall curve (AUCPR), and Mathews correlation coefficient (MCC) across all sociodemographic characteristics for all 6 CNN models.
Table 3 summarizes average performance metrics across the 6 models from the stratified 10-fold cross-validation for individual characteristics. The values in parentheses represent 95% confidence intervals. For all characteristics, at least 1 CNN model consistently outperformed the baseline models, namely logistic regression and random forest. Model A significantly outperformed logistic regression for place of birth by 10.556 percentage points in F1 score (92.058% vs 81.502%) and citizenship status by 10.004 percentage points (91.098% vs 81.094%), and significantly outperformed random forest for marital status by 3.691 percentage points (97.536% vs 93.845%) and occupation by 6.465 percentage points (91.770% vs 85.305%) (p < 0.05). Model B (F1: 91.916%) and Model E (F1: 90.796%) both significantly outperformed logistic regression for citizenship status by 10.822 and 9.702 percentage points respectively (p < 0.05). For marital status and occupation, Model F significantly outperformed random forest by 3.480 percentage points (97.325% vs 93.845%) and 6.661 percentage points (91.966% vs 85.305%) respectively (p < 0.05), indicating that incorporating CNN-based feature extraction before random forest classification can enhance performance in balanced datasets. In terms of marital status both Models C (F1: 97.801%) and D (F1: 97.153%) also significantly outperformed random forest by 3.956 and 3.308 percentage points respectively (p < 0.05). No significant differences were observed between performances across models for the classification of education status, likely due to its high class imbalance, though Model A achieved the highest F1 score (82.477%), only 2.599 percentage points above the best baseline (random forest: 79.878%).
10-fold Average Model Performance on Each Sociodemographic Factor Using Recall, Precision, F1 Score, Area Under the Precisions Recall Curve (AUCPR), and Mathews Correlation Coefficient (MCC) as Evaluation Metrics.

Numbers in parentheses represent the 95% confidence intervals. Bold-faced numbers represent the highest performance among the 6 models. Multiple values are highlighted for 1 metric if they only vary by a few decimal points.
There was notable variability in performance across both models and sociodemographic characteristics. While Model A generally demonstrated strong performance, it did not consistently outperform all other models across every characteristic. This variability highlights that although simpler CNN architectures like Model A often deliver robust results—particularly in imbalanced datasets—model effectiveness is highly influenced by the underlying data characteristics. For instance, Model B proved superior for classifying citizenship status. At the same time, the more complex models (Models C and D) as well as Model F provided competitive performance results for marital status. For occupation, the hybrid models (Models E and F) alongside Model C excelled, suggesting that each model has advantages over others depending on how the output characteristic is documented in the medical text.
To assess the impact of integrating traditional classifiers with CNN-based feature extraction, we compared the F1 score performance of the hybrid models against their standalone CNN counterparts (shown in Table 4). Across most sociodemographic characteristics, the standalone CNN models generally outperformed their hybrid counterparts, suggesting that the addition of traditional classifiers did not consistently enhance performance and, in some cases, resulted in a decline. This performance drop was particularly notable for education status, where the F1 score declined from 80.041% to 75.954% when the CNN of Model F was combined with random forest. Similarly, for citizenship status, both hybrid models underperformed relative to the standalone CNNs. In contrast, for more structured and balanced characteristics such as marital status and occupation, using a hybrid approach increased performance. For example, Model F resulted in a slight improvement in performance from 97.153% to 97.732% for marital status and 90.513% to 91.966% for occupation.
F1 Score Comparisons (in Percentage) of the Hybrid CNN Architectures to Their Standalone CNN Components for Each Sociodemographic Characteristic.

The CNN component of Model E is depicted as CNN(E) and the support vector machine as SVM. The CNN component of Model F is depicted as CNN(F) and the random forest as RF. Bold-faced numbers indicate an enhancement in model performance when a traditional classifier is added to the architecture. The differences in performance were not statistically significant.
The PR curves, calculated on a held-out test set of 438 data entries (10% of the labeled dataset), are shown in Figure 9 for each model grouped by the sociodemographic characteristic. Marital status, occupation, and place of birth were able to optimize well on both metrics, showing the highest separation of classes with the most agreement between models. Contrarily, education produced the lowest average precision scores and the most variation in the PR curves between models. What can be observed is that despite marital status and occupation having very similar data distributions (~50% presence), there is quite a noticeable variation in the PR curves between the 2 characteristics. Here, marital status had much better separability, as indicated by higher precision and recall across models. A similar pattern is observed for place of birth and citizenship status, confirming the challenges posed by data characteristics such as extreme class imbalance or high lexical variability.

The PR curves of the 6 deep learning models and the 2 traditional classifiers for each sociodemographic characteristic. The average precision (AP) for each model is displayed between brackets.
The F1 score distribution for each model, categorized by the sociodemographic factors, is presented in Figure 10. These distributions reflect the F1 scores obtained from the 10-fold stratified cross-validation process used to evaluate model performance. Unlike single-point metrics, these graphs provide a clearer depiction of each model’s stability across different data splits. Marital status exhibited the least variability in F1 scores across folds and models, indicating consistent performance regardless of the specific data partition. On the other hand, the F1 score distributions for occupation showed greater dispersion compared to marital status, reflecting the impact of data complexity on performance consistency. This pattern also extends to place of birth and citizenship status, where the former exhibited more pronounced peaks with less dispersion. Education status showed the highest variability, which is consistent with the above findings. Interestingly, model stability did not always correspond with peak performance. Some models demonstrated greater consistency across folds, suggesting stronger generalizability even without achieving the highest F1 scores. For instance, Model B showed the most stable performance for place of birth, while Model E was the most consistent for citizenship status, despite Model A and Model B having the highest average F1 scores for these characteristics, respectively.

The distribution of the F1 scores across data splits from the 10-fold stratified cross-validation for each sociodemographic characteristic and each model including the 2 traditional classifiers: (a) place of birth, (b) citizenship status, (c) marital status, (d) occupation, and (e) education.
Error Analysis
To better understand the differences in performance results for characteristics with very similar distributions (i.e., place of birth vs citizenship status, marital status vs occupation), we conducted an error analysis using the predictions on the held-out test set. We randomly sampled 20 sentences of cases where a factor was present but was predicted to be absent as well as the reverse where there was no indication of a factor but the models incorrectly classified these entries as present. Examples of misclassified sentences for both categories are presented in Table 5. Overall, we found that the majority of misclassified entries were due to incorrect annotations, contributing to both false positive and false negative errors. However, we did observe quite significant variations in how each characteristic was documented in the EMRs that helped explain the differences in model performance.
Sampled Sentences That Resulted in Misclassification by the Models.

For example, sentences that did contain occupation information but were misclassified as absent were primarily due to the sheer number of ways that can be used to document job details. Many instances in the clinical text featured single-word job titles or brief descriptions, which led to frequent classification errors. These errors likely stemmed from the lack of contextual framing around these terms, making it difficult for the models to distinguish between job titles and other similar lexical items found in the text. Furthermore, in the absence of contextual information around job titles and descriptions, the models rely on having a sufficient number of entries with the same job to effectively learn the cues needed to classify it as the presence of occupation information. On the other hand, marital status was found to be represented in a more semi-structured format where certain terms clearly indicate the presence of a patient’s marital status (e.g., ‘married to X’, ‘marital status: divorced’, ‘family: separated’). Many of the false positives for marital status were due to references to the marital status of family members, such as ‘parents are separated’.
When comparing place of birth and citizenship status, we found a very similar trend. Place of birth information tended to be more explicitly stated in the narratives, often in a consistent format (e.g., ‘born in [location]’), which likely caused more accurate classification. In contrast, citizenship status was documented in a less structured and more context-dependent manner, often requiring the model to infer status from indirect references (e.g., ‘born in Quebec’ or ‘immigrated to the country in 2005’). This lexical variability and reliance on implied information likely contributed to a higher rate of misclassifications for citizenship status compared to place of birth. Many of the classification errors related to place of birth occurred when sentences referenced previous residences or migration histories without explicitly stating the actual birthplace, especially when both involve geographic locations. For citizenship status, misclassifications often stemmed from the models’ inability to infer legal citizenship from indirect references. While it is generally assumed that individuals born in Canada are Canadian citizens, this inference requires contextual understanding that the models lack, as they rely solely on the presence of specific keywords rather than legal or societal assumptions.
Education status showed the weakest classification performance across all models (best F1: 82.477%), substantially lower than other sociodemographic factors. This limitation reflects several intertwined challenges. The dataset contained only 9.7% of records with documented education information, leaving the models with too few examples to learn reliable features. The descriptions that did appear were strikingly diverse, ranging from degree completion (e.g., ‘graduated from University X’, ‘bachelor’s degree in engineering’), to partial or ongoing study (e.g., ‘some college’, ‘currently enrolled in nursing’), to professional certifications (e.g., ‘licensed practical nurse’, ‘certified electrician’). Unlike marital status, which was often recorded in a consistent, structured format, educational references lacked standardization, making it difficult for the models to identify recurring patterns. The few positive examples that were available were spread thinly across many different institutions and programs, further limiting the ability to build robust representations. These overlapping factors created a particularly difficult classification setting that even the strongest CNN architectures struggled to address effectively.
These findings highlight that the observed performance variations across characteristics are influenced not only by the data distribution but also by the lexical diversity and structural consistency within the text. Characteristics with more structured representations (e.g., marital status, place of birth) tend to yield better model performance, while those with higher lexical diversity and that require context-dependent cues (e.g., education, occupation, citizenship status) pose greater challenges, even when their distributions are comparable.
Discussion
Previous studies have identified associations between patients’ sociodemographic characteristics and various health-related conditions.3-19 Extracting these factors from EMRs and grouping patients into cohorts enables researchers to better analyze these medically relevant risk factors, which may play a crucial role in disease development and progression. However, much of the EMR data is stored in an unstructured format, with sociodemographic factors often exhibiting high levels of missingness. Identifying an optimal approach for classifying these characteristics at the sentence level is a critical first step toward improving data availability for health disparities research and precision medicine. CNNs have been successfully applied to clinical text classification tasks, particularly for social and behavioral factor extraction.63,69 Their ability to highlight key local patterns in text makes them particularly useful for extracting structured information from unstructured EMR data. This study aimed to recommend model development practices for clinical text classification by evaluating 6 variations of CNN architectures for the binary classification of sociodemographic information in EMR free-text fields. These findings are directly actionable for informatics teams designing tools to augment EMR completeness or build demographically representative cohorts.
Our results demonstrate that model architecture plays a significant role in the classification of sociodemographic characteristics within EMRs. Overall, we found that simpler CNN architectures like Model A tended to perform robustly, likely due to reduced model complexity minimizing the risk of overfitting. However, when looking at a more granular level, more complex models like Model C and hybrid models like Model F demonstrated comparable performance, especially in more balanced datasets, such as marital status, or for more lexically diverse data such as occupation. Our models can be generalizable to categorize other sociodemographic factors as they have shown high performance for all assessed characteristics which varied by frequency and lexical diversity. Therefore, model architecture can be chosen based on documentation rates since we have provided detailed evaluations for the varying class sizes.
The hybrid approach, which integrated traditional classifiers, such as support vector machines and random forests, with CNN-based feature extraction, exhibited mixed performance when compared to their standalone CNN counterparts. While hybridization was expected to enhance classification by leveraging the robust feature extraction of CNNs alongside the structured decision-making capabilities of traditional classifiers, the results indicate that this approach did not consistently improve performance. In certain cases, such as marital status and occupation, the hybrid models achieved slightly higher F1 scores, suggesting that the traditional classifiers helped refine classification boundaries for structured or lexically complex characteristics. However, for citizenship status and education status, the hybrid models underperformed, likely due to the random forest and support vector machine’s sensitivity to imbalanced data, which led to a decline in recall. This was particularly evident in education status, where the hybrid models (especially Model F) struggled to capture contextual nuances. While hybrid architectures may offer advantages for structured or well-represented features, they may not always be suitable for highly imbalanced data mixed with lexically diverse text, where standalone CNNs appeared to generalize more effectively.
The observed variability in model performances revealed key insights into the relationship between data characteristics and model performance. Despite some characteristics exhibiting the same class distributions, the CNN models demonstrated noticeably higher performance for some over others. Marital status and occupation both had a prevalence rate of ~50% in the data while place of birth and citizenship status also shared a similar distribution in the data of ~15% presence. However, marital status and place of birth achieved higher scores and model stability when compared to occupation and citizenship status. This disparity is largely attributed to the greater lexical diversity inherent in documenting occupation data and the context-dependent nature of citizenship status. Marital status and place of birth are more explicitly mentioned following a very similar structure across entries such as ‘marital status: divorced’, ‘married to XX’, and ‘place of origin: France’. On the other hand, citizenship and occupational information varied considerably due to complex linguistic patterns and subtle contextual cues that may be evident to a human reader but create challenges for model training. Education status exhibited the lowest performance rates across models, likely due to both its pronounced class imbalance and the variability in how educational information can be expressed—ranging from phrases like ‘graduated from University X’ to ‘completed grade 10’ or ‘pursuing a master’s degree’. This linguistic complexity increases the difficulty for models to generalize effectively.
The CNN models consistently performed well on characteristics with balanced presence-absence distributions, such as marital status and occupation, achieving high F1 scores and Matthews correlation coefficients. The lexical diversity in occupation seemed to favor models with more complex architectures (Models C and D), while marital status performed well across any architecture due to its structured nature and balanced distribution. Conversely, characteristics with lower presence rates, such as place of birth and citizenship status (~15%) and education status (~9%), generally benefited from simpler architectures. Model B excelled at identifying citizenship status likely due to its use of multiple filter region sizes that enhanced its ability to capture diverse linguistic patterns common with that characteristic.
This analysis indicated that balancing model complexity with data characteristics is essential for optimal performance, particularly in sensitive domains like healthcare data, where both recall and precision can have significant implications. Each CNN model might have subtle architectural differences (e.g., filter size, layer depth, activation functions) that emphasize certain aspects of the data. For instance, Model A might excel in capturing broad patterns that generalize well, whereas Model F might have layers or filters optimized to detect features specific to the positive class, resulting in higher precision scores. Generally, for complex models to outperform simpler models, more high-quality or well-documented data may be required. In cases with sparse or imbalanced data, simpler architectures seem to offer a performance advantage without the added computation costs.
Our findings build on and extend prior research on deep learning approaches for extracting social determinants of health from clinical text. Earlier work has demonstrated the effectiveness of CNNs,63,69 long short-term memory networks,26,70 and transformer-based architectures,23,41-43 though most studies have focused on evaluating individual models or benchmarking deep learning against traditional machine learning approaches. More recent research highlights the advantages of transformer-based models, particularly BERT and its variants, which deliver state-of-the-art performance for fine-grained entity recognition and the capture of complex contextual relationships.41-43 These models consistently outperform CNNs and LSTMs across diverse social determinant domains, including housing, education, occupation, substance use, and broader social environments.10,23 However, such studies typically rely on well-resourced datasets and substantial computational infrastructure, often addressing intricate tasks that involve temporal, hierarchical, or multidimensional representations of social determinants of health. By contrast, our work addresses a complementary gap by providing, to our knowledge, the first systematic comparison of CNN architectures for binary presence/absence classification of sociodemographic characteristics in resource-limited settings. We demonstrate that relatively simple CNNs can achieve strong performance (F1 ≈ 91%) for sentence-level classification when sociodemographic information is documented in structured formats. This finding underscores that architectural complexity should be calibrated to the characteristics of the data and the institutional context, rather than assumed to be universally advantageous. Importantly, these results have direct practical implications for healthcare systems with limited computational resources or those requiring real-time workflow integration, where the efficiency and interpretability of CNNs may outweigh the marginal performance gains offered by transformer-based models. Our findings also reinforce prior observations on the influence of lexical diversity and documentation consistency, 26 highlighting the importance of aligning model choice with both data properties and implementation environments.
We found that deep learning architectures can be successfully leveraged for real-world medical text classification without requiring extensive feature engineering techniques. Importantly, CNNs demonstrated robustness in highly imbalanced and small training sample sizes, achieving strong performance without the need for explicit data-balancing methods. This is particularly relevant in the clinical domain, where minority sociodemographic groups are often underrepresented in datasets, and balancing strategies risk discarding valuable information or compromising representativeness. These findings highlight CNNs’ potential to deliver reliable classification in real-world settings where data availability and distribution cannot be easily controlled.
In practical terms, CNN-based classifiers could be integrated directly into EMR systems to automatically flag missing or incomplete sociodemographic information, prompting clinicians or administrative staff to verify and update records during routine encounters, thereby improving data completeness for clinical decision support and equity-driven research. This enhanced data capture directly supports patient care by enabling more accurate risk stratification for conditions with known sociodemographic associations (e.g., cardiovascular disease, diabetes, mental health disorders), facilitating targeted preventive interventions for high-risk populations, and supporting culturally appropriate care delivery tailored to patients’ backgrounds and life circumstances. At the health system level, complete sociodemographic data reduces administrative burden by eliminating redundant data collection efforts, enables population health management through identification of underserved communities, supports compliance with health equity reporting requirements, and facilitates research on social determinants of health without requiring labor-intensive manual chart review. Implementation could follow a tiered approach: (1) batch processing of existing records to identify documentation gaps and prioritize outreach for vulnerable populations, (2) real-time flagging during clinical encounters to prompt timely data collection when clinically relevant, and (3) integration with structured data entry fields to guide standardized documentation practices. Because CNNs are computationally lightweight, they can be deployed locally in primary care and community health settings on standard clinical workstations or local servers without requiring high-performance infrastructure, avoiding the latency and privacy concerns associated with cloud-based processing that would be necessary for transformer-based approaches. Such systems should operate in a human-in-the-loop fashion, where automated predictions are reviewed and validated by clinicians or trained staff, ensuring oversight, reducing risks of misclassification, and preserving alignment with clinical workflows. Key implementation considerations include establishing clear governance for model updates and retraining as documentation practices evolve, ensuring compliance with privacy regulations and institutional review processes, and conducting prospective evaluation to monitor performance drift over time, following successful deployment patterns from other clinical NLP tasks such as automated coding assistance and clinical decision support.
Our study has several limitations. The models we developed were designed to detect the presence or absence of sociodemographic characteristics rather than classifying patients into distinct subcategories. A multi-class framework could offer deeper insights by distinguishing between specific subgroups, thereby improving downstream analyses and risk stratification. Another limitation lies in the lack of interpretability of deep neural networks, an important consideration for clinical decision-making. Future work should explore the application of post hoc explainable AI techniques to enhance transparency. We also did not compare convolutional neural networks with state-of-the-art transformer-based models (e.g., BERT, ClinicalBERT), which have demonstrated strong performance on clinical NLP tasks.41-43 Our emphasis on CNNs was intentional, reflecting their computational efficiency and suitability for binary classification tasks in resource-limited settings. Given the relatively small dataset size and the structured nature of certain characteristics, more complex models may have been prone to overfitting, reducing their comparative advantage. Moreover, the CNN architectures already achieved high performance (F1 ≈ 91%), leaving limited headroom for further improvement. Nonetheless, direct comparison with transformer-based approaches remains an important direction for future work, particularly for lexically diverse or context-dependent sociodemographic characteristics and for more complex multi-class extraction tasks where transformers may excel.
A further limitation is that primary annotation was performed by a single annotator. Although intra-rater reliability was high (kappa: 0.98 for documentation status, 0.96 for documented information), multiple annotators with inter-rater reliability assessment would have provided stronger validation and reduced the potential for systematic bias in the reference standard. In addition, several sociodemographic variables of high relevance to health equity research (including race, gender identity, and sexual orientation) were excluded because documentation rates fell below 3%. Training classifiers on such sparse data would have yielded unreliable models dominated by class imbalance. While this exclusion reduces comprehensiveness, it reflects current documentation limitations in EMRs; larger multi-site datasets or semi-supervised methods may help address this gap. Finally, our dataset was derived from family medicine clinics in Ontario using 3 EMR vendors and comprised English-language documentation. Although this reflects real-world practices across 96 clinics and diverse patient populations within Canadian primary care, its regional and linguistic scope may limit generalizability to other provinces, countries, or health systems. Documentation styles, language use, and sociodemographic recording conventions can vary across jurisdictions and EMR platforms, potentially influencing model performance. Broader datasets spanning multiple geographic regions and healthcare settings will therefore be essential to assess external validity.
Future research should build on these findings in several ways to advance automated sociodemographic extraction from clinical text. Semi-supervised learning offers 1 promising direction, as it could leverage large volumes of unlabeled clinical text alongside smaller annotated datasets to support robust modeling of rare characteristics that are currently excluded due to sparse documentation. Another avenue is the exploration of lightweight transformer architectures (e.g., DistilBERT, ALBERT, MobileBERT), which may balance the contextual strengths of transformers with the efficiency required for resource-limited clinical environments. Expanding beyond binary classification to multi-label and multi-class frameworks would also be valuable, enabling simultaneous extraction of multiple sociodemographic attributes and more fine-grained categorization (such as differentiating education levels or employment types). Prospective validation across diverse healthcare settings, including varied regions, EMR platforms, languages, and clinical specialties, will be critical for establishing generalizability and clinical relevance. Finally, the development of explainable AI methods tailored to CNN-based models could enhance interpretability and foster clinician trust, ensuring that automated extraction systems are not only accurate but also transparent and usable in practice.
Conclusion
There is increasing interest in leveraging information documented in electronic medical records, as it offers valuable insights into disease onset, progression, and responses to treatments or interventions. As EMR adoption continues to expand, large-scale real-world clinical data is becoming more readily available for biomedical research. This data includes sociodemographic information that can be used to find associations between specific factors and a patient’s health. Understanding the relationship between these factors and certain health risks first requires the classification of each characteristic documented in the EMR. However, not only are these characteristics rarely documented, but the medical text on its own is composed of complex medical vocabulary and medical measures that often do not follow natural language grammar. This creates challenges of high dimensionality and data sparsity, making the classification of sociodemographic factors a particularly difficult but important area of research.
This study provides the first systematic comparison of CNN architectures for binary presence/absence classification of sociodemographic characteristics in EMR clinical text. By evaluating 6 CNN architectures across 5 sociodemographic factors with varying documentation rates and lexical diversity, we demonstrate that simpler architectures often outperform more complex models, particularly under conditions of data imbalance and sparse documentation. Our findings offer practical, evidence-based guidance for researchers and informatics teams developing automated extraction tools for clinical deployment, particularly in resource-limited settings where computational efficiency and interpretability are critical considerations. Because the evaluated CNN architectures are lightweight, transparent, and require minimal computational resources, they can be readily integrated into existing EMR infrastructures without disrupting routine workflows. Such deployable models could operate as embedded modules for real-time documentation audits, automated flagging of missing sociodemographic fields, or generation of structured data summaries to support clinical decision support systems.
The translational impact of this work extends to both clinical practice and health equity research. For clinical decision support, automated classification of sociodemographic characteristics can enhance risk stratification for conditions with known social determinants, facilitate culturally appropriate care delivery, and reduce documentation burden by flagging incomplete patient profiles for verification. For equity-driven research, these methods enable efficient construction of demographically representative cohorts, identification of underserved populations, and large-scale investigation of social determinants of health without labor-intensive manual chart review. By demonstrating that efficient CNN-based approaches can achieve high performance for binary classification tasks, this study contributes to ongoing efforts to make automated clinical text analysis more accessible and deployable across diverse healthcare settings, ultimately supporting both improved patient care and advances in health disparities research.
Footnotes
Acknowledgements
Dr. K Tu receives a Chair in Family and Community Medicine Research in Primary Care at UHN and a Research Scholar Award from the Department of Family and Community Medicine, Temerty Faculty of Medicine, University of Toronto.
Ethical Considerations
This project received Research Ethics Board (REB) approval from the University of Toronto (Protocol #40129) and North York General Hospital (Protocol #20-0044). UTOPIAN operates under the principles of the Tri-Council Policy Statement: Ethical Conduct for Research Involving Humans (TCPS2), specifically Chapter 5, Section D, Article 5.5A. All methods were carried out in accordance with relevant guidelines and regulations, including the Declaration of Helsinki.
Consent to Participate
The need for informed consent was formally waived by both REBs due to the use of de-identified, retrospective EMR data. The data is de-identified and processed by our research team, and UTOPIAN standard operating procedures ensure that no linkage can be made from the outcomes reported in this project to specific patients. Family physicians who contribute data to UTOPIAN each signed a data sharing agreement that allows for research with REB approval.
Author Contributions
K.T. and E.S. conceived the study. R.A. designed and conducted the study, developed and implemented the models, collected and processed the data, performed model and error analyses, and drafted the manuscript. K.T. and E.S. supervised the study, provided resources, assisted in manuscript editing and review, and contributed to project administration. K.T. additionally curated data, and secured funding. All authors—R.A., K.T., and E.S.—reviewed and approved the final manuscript.
Funding
The authors disclosed receipt of the following financial support for the research, authorship, and/or publication of this article: This work was supported by the Canadian Institutes of Health Research [grant number 173094]. Dr. K Tu receives a Chair in Family and Community Medicine Research in Primary Care at UHN and a Research Scholar Award from the Department of Family and Community Medicine, Temerty Faculty of Medicine, University of Toronto.
Declaration of Conflicting Interests
The authors declared no potential conflicts of interest with respect to the research, authorship, and/or publication of this article.
Data Availability Statement
The data used in this study consisted of individual-level, de-identified records. In accordance with institutional policies and REB requirements, individual-level data cannot be made publicly available; only aggregate data may be shared. Due to the nature of this project, the data cannot be aggregated for public release. Additionally, the dataset—sourced from the University of Toronto’s Practice-Based Research Network (UTOPIAN) Data Safe Haven, a large primary care EMR repository—is no longer accessible, as the parent database has been archived. Future access to similar datasets may be possible upon REB approval. For inquiries, please contact the University of Toronto’s Human Research Ethics Unit at