
Abstract
Objectives:
The PINPOINT (PaIn aNd oPiOId maNagemenT) intervention in Oregon aimed to support primary care clinics in applying evidence-based guidelines for pain management and opioid use disorder treatment. We evaluated the impact of this intervention on opioid use disorder treatment and overdose outcomes.
Methods:
Data from the voluntary Oregon All Payer All Claims datasets were integrated with several administrative datasets to create the Provider Results of Opioid Management and Prescribing Training dataset, which tracks clinical and prescribing activities at the provider level. We employed difference-in-differences models to assess the impact of PaIn aNd oPiOId maNagemenT enrollment on changes in opioid use disorder treatment and overdose outcomes. The intervention sample consisted of 289 primary care providers from clinics participating in PaIn aNd oPiOId maNagemenT, compared with 2000 control providers identified through administrative claims.
Results:
The difference-in-differences models indicated statistically significant associations between intervention enrollment and treatment with medications for opioid use disorder (incidence rate ratio [IRR] = 1.214, 95% confidence interval [CI] = 1.100-1.340), any substance use disorder treatment (IRR = 1.120, 95% CI = 1.070-1.172), and any outpatient opioid use disorder treatment (IRR = 1.102, 95% CI = 1.034-1.175) compared to controls. No statistically significant changes were observed in overall non-fatal drug overdoses, non-fatal opioid overdoses, and naloxone overdose reversals, though absolute event rates were low.
Conclusions:
We found that multi-faceted, evidence-based approaches to improve clinical practice in primary care settings were associated with increased treatment for opioid use disorder, however differences in overdose outcomes were not observed. Further research is needed to assess the scalability and clinical impact of these interventions across diverse care environments.
Keywords
Introduction
Managing pain is a significant challenge for primary care clinicians, particularly when balancing the need for effective pain relief with concerns about opioid use disorder (OUD) and overdose risk.1 -3 Many primary care providers are not formally trained in OUD management, 4 lack confidence in prescribing treatments such as medications for opioid use disorder (MOUD), 5 or are unsure how to effectively reduce overdose risk. 6 To address these challenges, multiple programs and interventions aim to support clinicians in managing chronic pain in the primary care setting. 7
In 2019, the Centers for Disease Control and Prevention (CDC) launched the Overdose Data to Action (OD2A) program to increase state efforts in addressing opioid overprescribing and decrease overdoses. 8 Using OD2A funding, the Oregon Health Authority (OHA) initiated the PaIn aNd oPiOId maNagemenT (PINPOINT) project. PINPOINT sought to support primary care clinics in Oregon in implementing evidence-based guidelines for pain management, opioid prescribing, and OUD treatment. Oregon’s early experience with the opioid crisis mirrored national trends, and by 2010, opioid overdose had surpassed motor vehicle accidents as a cause of death in the state. However, beginning in 2015, opioid overdose deaths started to decline due to a combination of regulatory, clinical, and community-based approaches. 9 The PINPOINT project builds on those efforts, addressing critical gaps in care and equipping clinicians with tools and knowledge to provide effective OUD treatment in primary care.
The PINPOINT project integrated 3 evidence-based approaches to drive change at both the clinic and provider levels: the 6 Building Blocks (6BB),10,11 academic detailing (AD),12,13 and practice facilitation (PF).14,15 The intervention aimed to improve opioid prescribing practices among clinicians, focusing on reducing high-dose opioid prescriptions and the co-prescription of opioids and benzodiazepines, while increasing the use of MOUD such as buprenorphine.
Conventional claims databases may not consistently include outcomes related to OUD treatment and overdose prevention. We connected data from several administrative datasets within Oregon to develop a data resource that would allow evaluation of PINPOINT’s impact on OUD treatment and clinical outcomes. Due to the COVID-19 pandemic, certain elements of the PINPOINT intervention and its evaluation required adaptations to address the changing healthcare landscape and maintain key elements of the intervention. 16
Methods
Study Data Source
To evaluate the impact of the PINPOINT intervention on OUD treatment and overdose outcomes, we combined several datasets to form the Provider Results of Opioid Management and Prescribing Training (PROMPT) dataset. This comprehensive dataset integrates voluntary submissions from the Oregon All Payer All Claims (APCD) database, linked with data from the Hospital Discharge Registry, Prescription Drug Monitoring Programs (PDMP), Vital Records (death records), Measures and Outcomes Tracking System (MOTS), Emergency Medical Services (EMS), and data collected directly from providers and clinics involved in the PINPOINT intervention. We obtained data on outpatient MOUD treatment, primarily buprenorphine, from the PDMP, MOTS, and APCD. Data on methadone and other forms of substance use disorder (SUD) treatment was sourced from MOTS and APCD. Overdose data, including both fatal and non-fatal cases, were collected from EMS and overdose-related outcomes requiring hospital care were identified using the Hospital Discharge Registry. Mortality data was acquired or confirmed through Vital Records.
The APCD encompasses claims for all services provided in Oregon that are covered by Medicaid, Medicare, and commercial payers who voluntarily contribute their claims to the Oregon Data Collaborative (ODC). This includes approximately 80% of the Oregon population, excluding the uninsured, self-pay patients, and TRICARE beneficiaries (active-duty military insurance). From the APCD, we derived all patient demographic information, comorbidities, insurance enrollment details, and patient attribution to provider panels. We linked the other datasets as shown in Figure 1, with each patient assigned a unique encrypted identification number across all of the included data sourced. We have previously published a detailed description of that process. 16 The creation of the PROMPT dataset was delayed due to the COVID-19 pandemic, leading to a disruption of the timeline for dataset development as previously documented. 16

PROMPT linkage methodology.
Study Sample
Intervention
The unit of analysis for this evaluation was the individual provider, aligning with the provider-focused nature of the intervention. The intervention group consisted of providers from primary care clinics in Oregon participating in the PINPOINT initiative. 16 Clinics were recruited from the Oregon Rural Practice-based Research Network. 17 This 15-month intervention included an initial half-day educational training on the 6BB approach to enhance opioid management.11,18 The 6BB approach is a team-based approach to providing effective care for chronic pain and long-term opioid therapy patients in the primary care setting. 10 It includes leadership and consensus; policies, patient agreements, and workflows; tracking and monitoring patient care; planned, patient-centered visits; caring for patients with complex needs; and measuring success. 11 The training covered evidence-based therapies for chronic pain in alignment with CDC recommendations 19 ; for example, safer opioid prescribing and tapering practices, use of functional goals to guide therapies, tracking prescribing through PDMP, and treatments for opioid use disorder when present. Training also reviewed quality improvement methods and strategies for clinician and clinic-level implementation. There was no specific standardized curriculum about treatment for OUD, but high-level strategies for integrating OUD treatment into practice were discussed throughout the intervention and clinics were referred to ongoing educational communities 20 that offered sessions specifically for treatment of SUD in primary care.
Following the training, clinics could engage in PF (an approach to support primary care clinics in building organizational capacity for continuous improvement by using trained professionals14,15), AD (an approach using social marketing techniques to conduct individualized, 1:1 education with front-line clinicians to improve health care quality and patient outcomes through clinician behavior change12,13), learning collaboratives, and/or independently guided efforts to improve chronic pain management and opioid prescribing. The intervention’s tailored approach allowed clinics to address their specific improvement priorities. Most clinics opted for support through PF.
Providers in the intervention group were identified using PINPOINT clinic rosters as of when the intervention started, which included names and practice identifiers (NPI, primary specialty, and affiliation start and end dates). These identifiers facilitated the linkage process to retrieve data for provider-attributed patients. Identifiers were removed post-linkage (Figure 1). Practices and providers enrolled quarterly, and 4 cohorts were evaluated (May, August, and November 2020, and February 2021). Additional cohorts enrolled in August and November 2021 were excluded from the present analyses due to implementation delays. Some clinics deferred their enrollment due to the pandemic, which introduced challenges such as altered care delivery, new workflows, and staffing changes. 16 The original plan for the study was a stepped wedge design with balanced randomization for cohort assignment, but this was no longer possible due to the changes just described.
Providers identified in PROMPT were excluded from the analyses if they were not affiliated with the practice by the end of the 6-month period before the intervention, had fewer than 50 attributed patients in the previous year and the 6 months before the intervention, or lacked the necessary clinical credentials (MD, DO, NP, and PA) to serve as primary care providers in Oregon.
Control Providers
The APCD lacks detailed clinic site information and provider lists that would align precisely with the identification available using PINPOINT rosters. To address this, we used administrative claims to create a control group, carefully ensuring that control providers were selected from sites that had not yet been matched with PINPOINT recipients. Claims data in the APCD are often reported at the billing organization level rather than the clinic level, particularly for large health systems, making it challenging to assign providers to specific clinics. To build the control pool, we identified the billing organizations for providers from the 6 months preceding each PINPOINT intervention cohort’s start. Providers were then affiliated with the practice where they had billed the most claims during the last 2 months of that period. Controls were excluded if they worked at a PINPOINT clinic in a subsequent cohort or at a billing organization where any clinics received PINPOINT support (see Supplemental eTable 1). We then randomly selected 500 controls per cohort, totaling 2000 controls.
Patient Attribution
Patients were assigned to a provider using an algorithm implemented by the APCD data custodian. 21 This algorithm designates a primary provider based on the highest number of primary care visits within a rolling 2-year lookback period, which is updated quarterly. If a patient’s highest number of primary care visits is with multiple providers, the algorithm selects the most recently visited provider as the attributed primary provider.
Baseline Demographic and Clinical Variables
All baseline patient panel variables were calculated for the 6 months prior to cohort entry and expressed as percentages of the provider’s patient panel based on the attribution table. Patient demographic variables included: age groups by year (<18, 18-44, 45-64, and 65+), sex (male, female), race and ethnicity (white, Black, Hispanic, other, unknown), payer type (commercial, Medicaid, Medicare Advantage, Medicare FFS, Dual eligible), continuous enrollment (defined as no more than 30 days without coverage in any plan or combination of plans), and rurality (urban, frontier, rural). Clinical variables assessed were pain diagnoses (chronic, acute, any pain), substance use diagnoses (any SUD, substance abuse, or dependence), and Elixhauser 22 comorbidities (median combined comorbidity score, proportion of patients with a score of 0). Patients’ sex (male, female) was matched for intervention and control groups. ICD diagnostic codes are provided in Supplemental eTable 2.
Outcomes
Clinical outcomes included MOUD treatment, any SUD treatment (including both inpatient and outpatient services coded for SUD), any outpatient OUD treatment, any drug non-fatal overdose, non-fatal opioid overdose, opioid overdose death, and naloxone overdose reversal. We calculated the percentage of patients in each provider’s panel with specific outcomes on a monthly basis for both control and intervention providers. Prescribing outcomes have been evaluated in a separate manuscript. The number of attributed patients per month, updated quarterly, served as the denominator for these outcomes.
Analysis
We used the difference-in-differences (D-i-D) statistical method23,24 to estimate the differential effect between intervention and control groups before and after the PINPOINT intervention. This approach aligns with the monthly data collection structure and effectively measures changes in outcomes over time. The D-i-D method was selected due to the challenges in our study’s data collection, particularly in calculating baseline covariates as percentages of provider patient panel characteristics, which complicates balancing differences in confounding factors between groups.
The D-i-D method mitigates the need for balanced baseline confounders by assuming that any baseline confounding is time-invariant. Although this assumption is more plausible for our setting, it may not be entirely accurate. Therefore, our results should be considered exploratory.
To estimate the intervention’s effect, we fitted a negative binomial model with a pre-post interaction term for the intervention group. Adjustments were made for cohort entry time and an indicator for AD uptake (categorized as no AD visits, baseline AD only, or baseline AD plus additional visits), given that implementation of AD was more challenging in the setting of the pandemic. This model allowed us to calculate incidence rate ratios (IRRs) for various outcomes related to the intervention. A description of the model used to calculate the DiD effect is shown in equation (1) below.

In equation (1), β0 represents the intercept, β1 the effect of being in the intervention group, β2 the effect of being in the post-intervention period, β3 the D-i-D estimate, β4 × X1i and β5 × X2i the coefficients for other control variables (cohort entry time and AD uptake). All statistical analyses were performed using SAS Studio, version 9.4 (SAS Institute Inc), and R, version 4.1.3, with a significance threshold of P < .05 for 2-sided tests.
Results
The clinic rosters for PINPOINT sites included 577 providers. Providers were excluded for leaving their practice or having fewer than 50 attributed patients (n = 278), or not having the specified professional degrees (MD, DO, NP, and PA; n = 10), yielding a final sample of 289 intervention providers. We identified 2000 potential controls, 500 for each of the 4 intervention waves. Table 1 shows provider specialties, which encompassed a wide range of primary care providers, including pediatricians, many of whom have patients 18 years or older and thus were eligible for inclusion in the PROMPT dataset.
Provider Specialties.

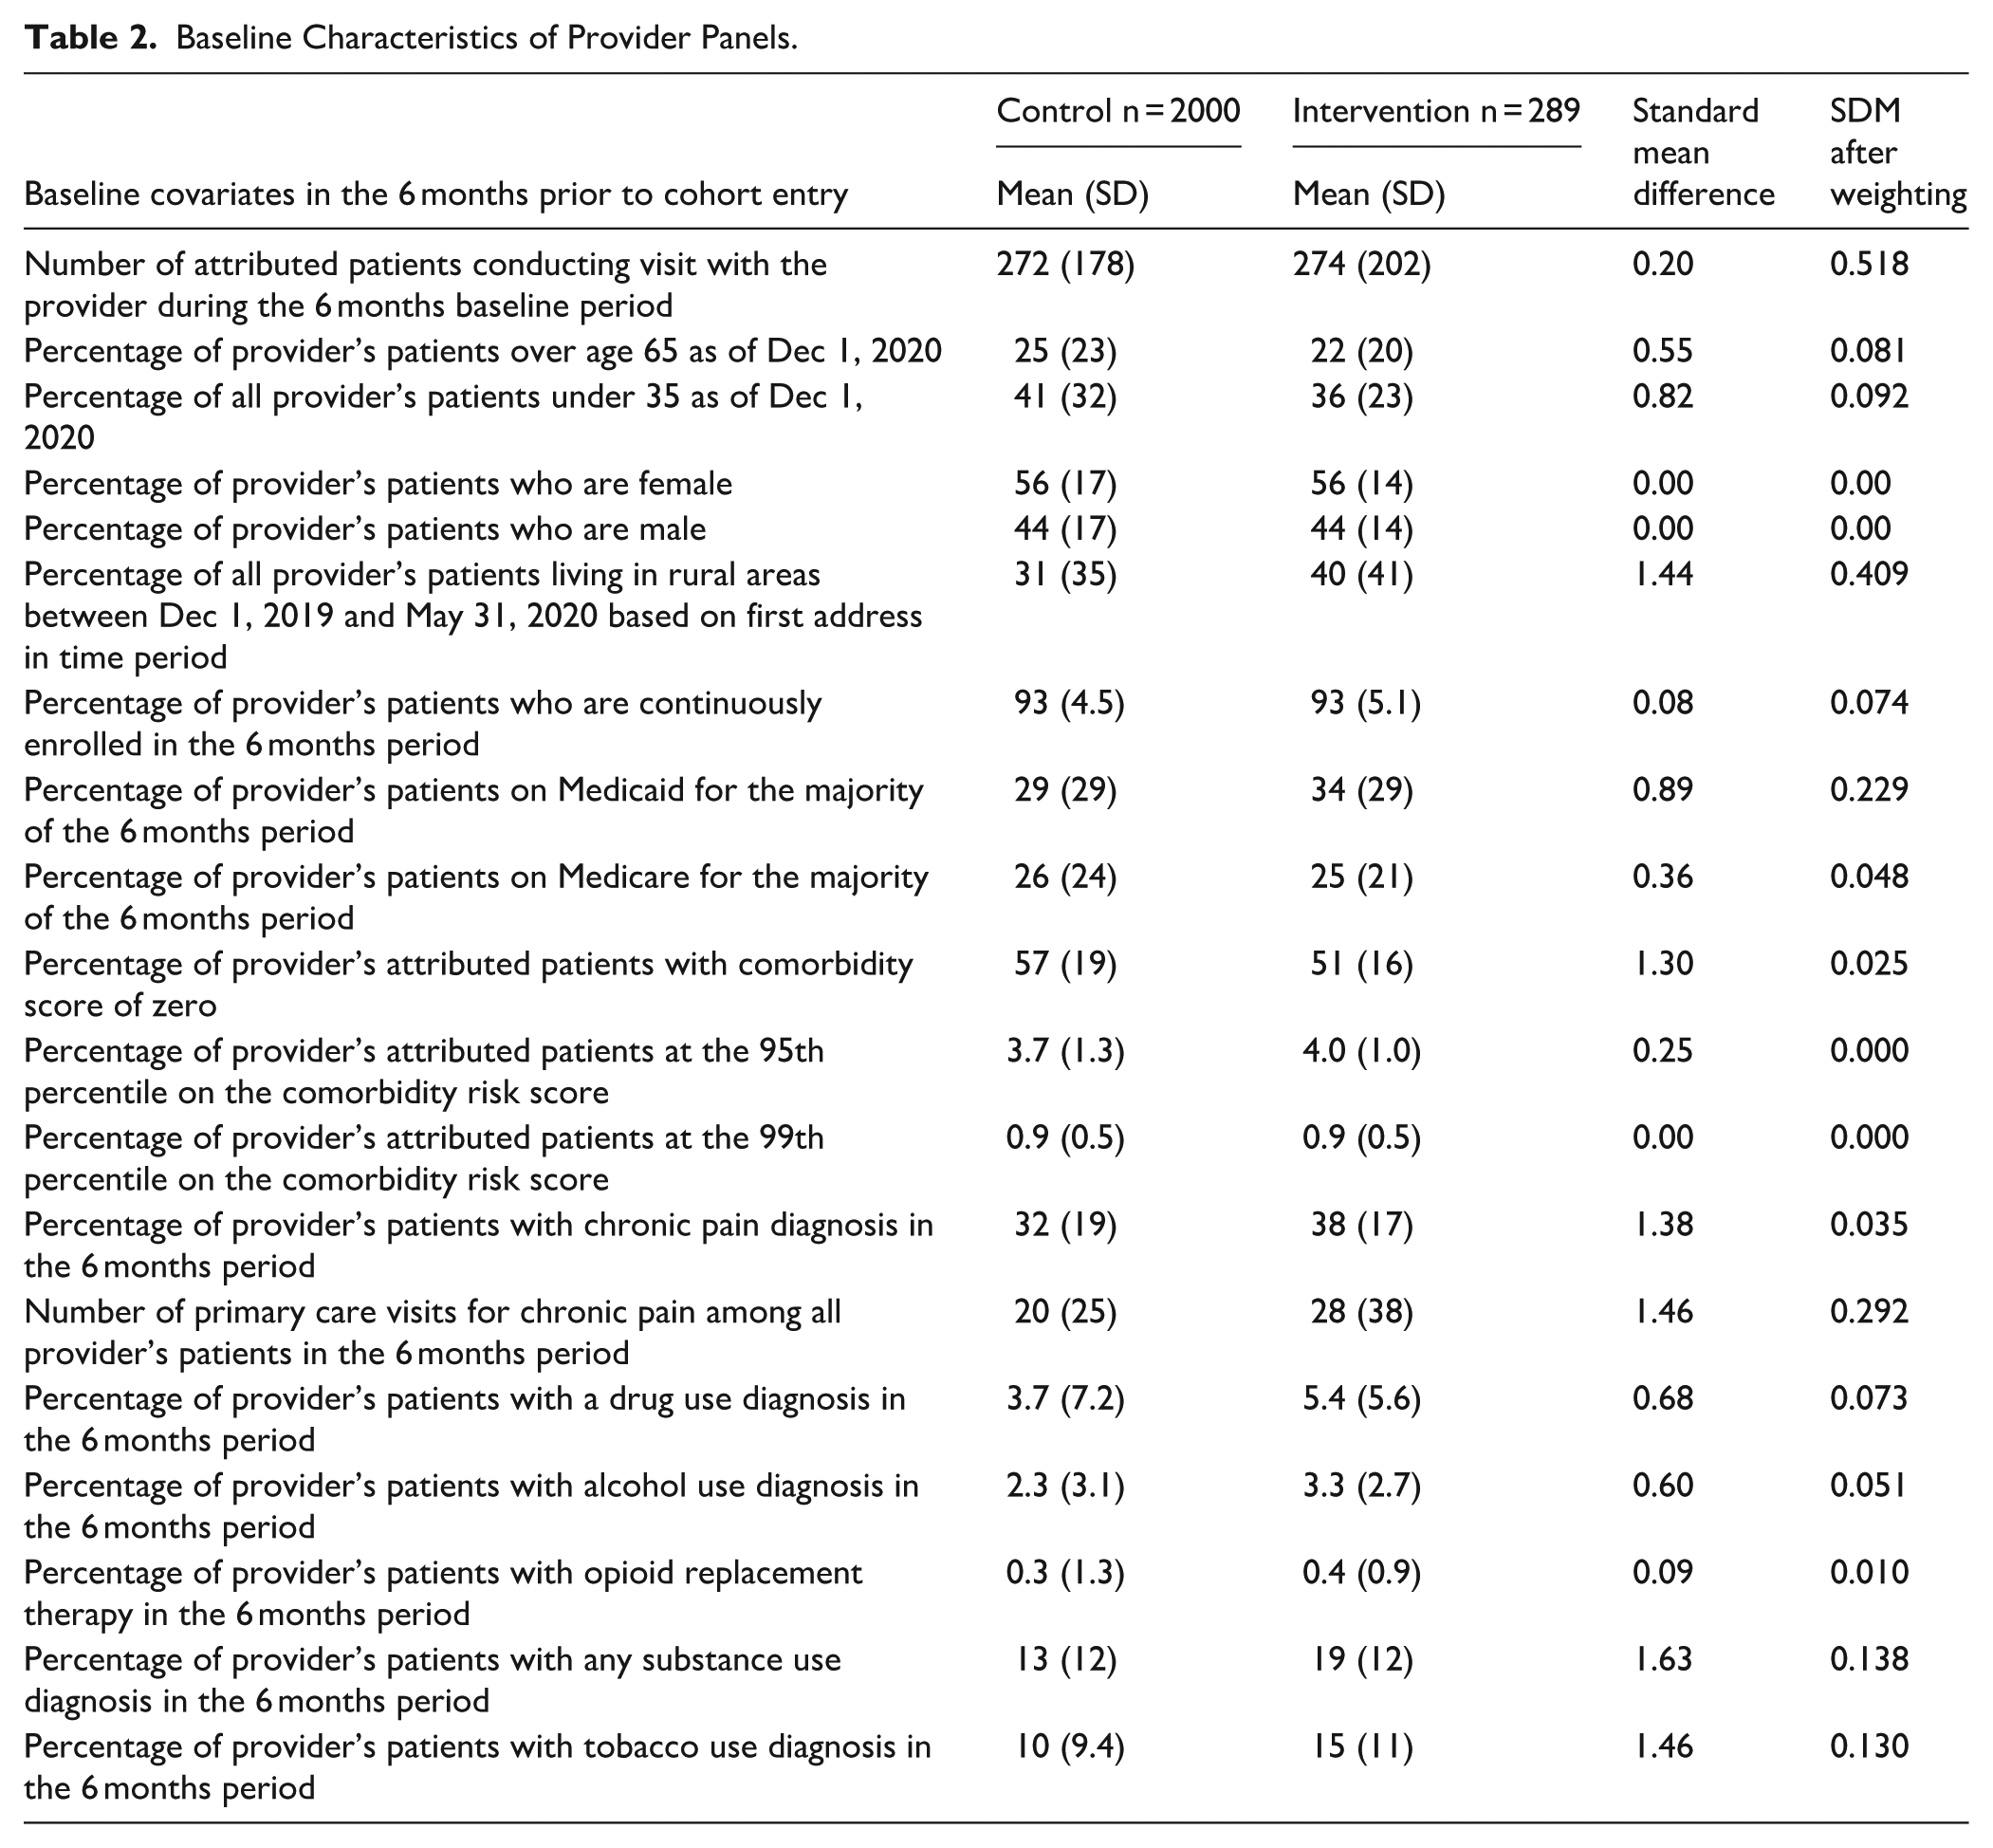
Table 2 shows baseline sample characteristics for the intervention and control providers. Compared to controls, intervention providers had fewer patients over 65 years and under 35 years, indicating a more middle-aged population. Over half of patients were on Medicaid or Medicare; the percentage of Medicaid patients was higher for intervention providers (34%) than for controls (29%). Diagnoses of chronic pain were common in both groups, and intervention clinicians had more proportion of patients with SUD diagnoses (19%) than control clinicians (13%). Race was missing for over 50% of the cohort and is not shown in Table 2.
Baseline Characteristics of Provider Panels.
The raw distribution of outcomes is presented in Figure 2. In each panel of Figure 2, 0 = controls and 1 = intervention; the mean unit is percentage of a provider’s panel with the outcome of interest. Panel 2a shows that intervention clinicians had a higher percentage of patients who received MOUD pre-intervention through 16 months post-intervention. Panel 2b shows that intervention clinicians had a lower percentage of patients who engaged in any SUD treatment about 1.5 years before the intervention and more patients who engaged in any SUD treatment from that point forward. Panel 2c shows intervention clinicians had more patients who engaged in any outpatient OUD treatment from 18 months before the intervention start date through to 18 months after the intervention start date.

Monthly clinical outcome levels for intervention and control providers, expressed as mean percentage of patients per provider panel with each outcome. Months are expressed relative to start of intervention, or corresponding control time period. (a) MOUD treatment, (b) any substance use treatment, and (c) any outpatient opioid treatment.
The modeling results in Table 3 show that intervention providers were more likely to have an increased proportion of their patient panel on MOUD after the intervention compared to control providers (IRR = 1.214, 95% confidence interval [CI] = 1.100-1.340). We observed similar results for the outcomes of any SUD treatment (IRR = 1.120, 95% CI = 1.070-1.172) and any outpatient OUD treatment (IRR = 1.102, 95% CI = 1.034-1.175). We did not observe significant differences for any non-fatal drug overdoses, non-fatal opioid overdoses, and naloxone overdose reversals. The models for the outcome of opioid overdose deaths did not converge.
Results of Difference in Differences Models for Associated Between PINPOINT Enrollment and Provider-level Clinical Outcomes.
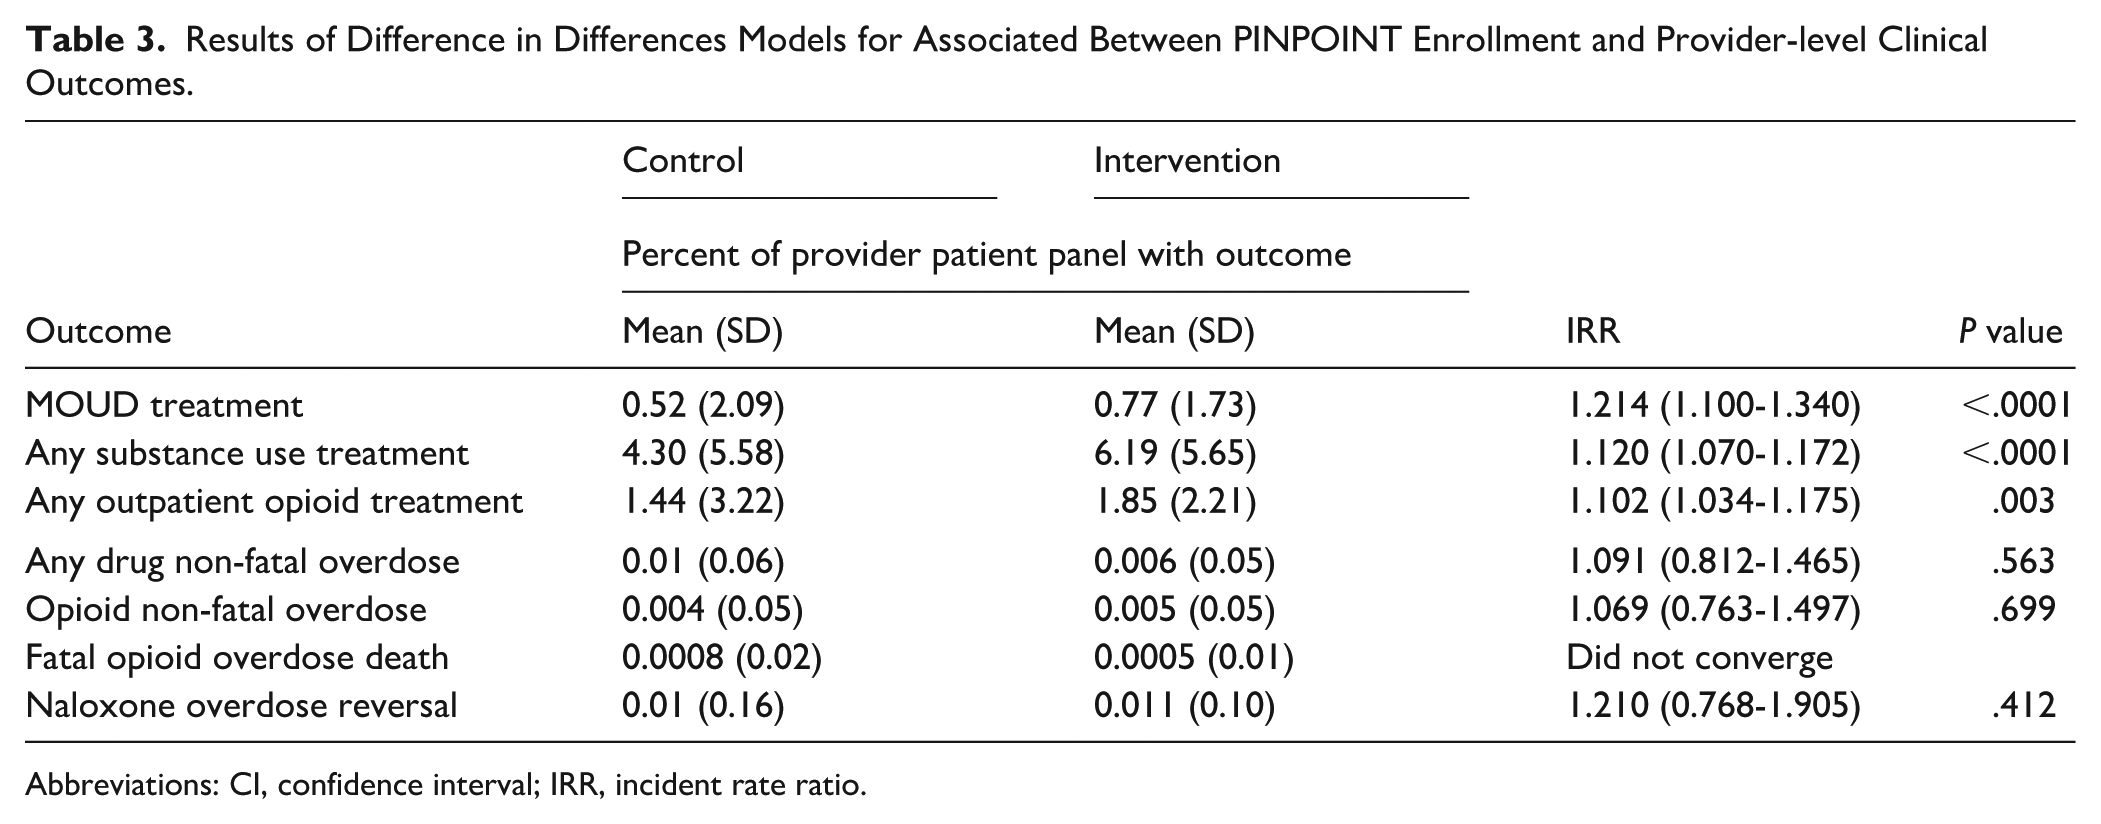
Abbreviations: CI, confidence interval; IRR, incident rate ratio.
Discussion
We assessed the impact of PINPOINT, a practice-based intervention in Oregon implemented as part of the national OD2A program, on OUD treatment, and overdose outcomes. The analyses indicate potentially promising associations of the PINPOINT intervention with outcomes related to treatment. These findings are especially notable given the challenging circumstances in which the intervention was implemented. Specifically, with the onset of the pandemic, elements of the intervention had to be rapidly adapted for virtual delivery and many practice sites delayed participation or dropped out. 16 The pandemic’s impact on access to care was complex, including reduced access to in-person OUD and SUD treatment, 25 as well as increased ability to use telehealth to deliver treatments for patients with OUD.26,27 While the dynamic setting in which the study was conducted limits our ability to draw firm conclusions about the impact of PINPOINT on OUD treatment, the suggestive findings should encourage further study of practice-based interventions.
Increases in any SUD treatment and any OUD treatment were associated with the PINPOINT intervention, as was an increase in MOUD treatment. Of note, differences in treatment rates were observed before PINPOINT implementation, with intervention clinicians showing higher treatment rates than control clinicians in the baseline period (Figure 2). The original design for the present study called for a stepped-wedge approach with balanced randomization to assign start dates to each practice. The start of the pandemic 2 months before the first scheduled stepped-wedge group resulted in a switch to voluntary enrollment based on practice willingness to continue participating. Practices and clinicians that elected to proceed with PINPOINT may have been more open to adopting OUD treatment. While the difference-in-difference models indicated an increase in treatment rates associated with the start of the intervention above and beyond those baseline differences, we cannot exclude the possibility of residual confounding factors that may have made the intervention practices more receptive to the intervention.
All of the overdose outcomes had much lower event rates and correspondingly wide CIs for the modeled effect estimates. There are several reasons why event rates for overdose outcomes were low. First, even with high overdose rates at the statewide level, the number of events within a single clinician’s panel is relatively small. Second, the overdose outcomes may not be captured as reliably as other clinical events, even with the inclusion in the PROMPT dataset of multiple additional sources of clinical and administrative data.
Our study contributes to the existing body of literature on interventions designed to support OUD treatment in primary care settings. Existing evidence highlights significant barriers faced by primary care clinicians in treating OUD, including negative attitudes, stigma, lack of administrative support, lack of supportive resources, and concerns about managing an overwhelming influx of patients.4,5,28 -32 The PINPOINT intervention was created to address some of these barriers. A systematic review of patient outcomes across 35 interventions for OUD in primary care highlighted that successful approaches used coordinated, multidisciplinary models to support clinicians in prescribing OUD treatments. Multiple studies in the review emphasized the perceived benefits of coordinated care among providers. 33 While the PINPOINT intervention is not a traditional coordinated care model, it combined the 6BB, AD, and PF approaches to support both clinicians and entire clinics in improving opioid prescribing practices and OUD treatment.
While the results of these analyses indicate promising potential impacts of the PINPOINT intervention, limitations must be considered. The APCD data that forms the basis for the PROMPT dataset excludes the uninsured, self-pay patients, and TRICARE beneficiaries, so that approximately 80% of the Oregon population was included, somewhat limiting the generalizability of our findings. The PROMPT data did not include information on the full range of mental health diagnoses, a potential confounder. The pandemic also significantly heightened the pressures on primary care during the time of the study,34,35 making it challenging to adopt new workflows, practices, and approaches.36,37 As noted, the PINPOINT intervention was not implemented as originally designed due to the pandemic. 16 In addition to changes in intervention delivery, the original plan for balanced stepped-wedge implementation was no longer possible. We treated the analyses as observational in the setting of an intervention that was delivered over multiple waves and with inability to use the pre-specified plan. As described in the Methods section, we opted for a difference-in-differences methodology as the best way to obtain effect estimates, which means our results should be considered exploratory rather than conclusive. However, the results provide an important indication of the potential of this approach and point toward additional interventional and analytic approaches that could be used in future work.
When interpreting our results and planning future studies, it will be important to account for the shift from prescription opioids and heroin to synthetic opioids as primary causes of overdoses.38,39 This trend has accelerated significantly over the past few years. While interventions supporting clinically appropriate pain management, and efforts to increase OUD treatment remain important, the prevalence of highly potent synthetic opioids needs a broader range of interventions. 40 These interventions will be required to effectively reach individuals at risk of opioid overdose and provide them with effective treatments.
Further research should examine the long-term effects of the PINPOINT intervention, especially since many practices began participating late in the project period. Future studies could also explore whether the effects of interventions like PINPOINT differ across primary care specialties or level of training (MD vs NP vs PA), for which our study was not powered. Conducting qualitative studies with individual practices could enable mixed-methods evaluations, providing deeper insights into which components of PINPOINT were most effective. Another important area for future research is the integration of additional data resources into datasets like PROMPT, allowing for the exploration of more outcomes relevant to clinicians, patients, policymakers, and communities.
In conclusion, our findings suggest that multi-faceted, evidence-based approaches have the potential to improve OUD treatment in primary care settings. Further research is necessary to explore the reproducibility, scalability, and clinical impact of such interventions.
Supplemental Material
sj-pdf-1-jpc-10.1177_21501319251375393 – Supplemental material for Impact of a Multi-Factorial Primary Care Intervention on Opioid Use Disorder Treatment and Overdose Outcomes
Supplemental material, sj-pdf-1-jpc-10.1177_21501319251375393 for Impact of a Multi-Factorial Primary Care Intervention on Opioid Use Disorder Treatment and Overdose Outcomes by Anna R. Morgan-Barsamian, Sanae El Ibrahimi, Michelle A. Hendricks, Kendra L. Blalock, Erin Stack, Richard Wyss, Brigit A. Hatch, Victoria Sánchez and Michael A. Fischer in Journal of Primary Care & Community Health
Footnotes
Acknowledgements
The authors acknowledge the primary care clinics from the Oregon Rural Practice-based Research Network for their participation in this project and their commitment to continuous improvement and research. The authors also thank Dagan Wright, PhD, MSPH (Oregon Health Authority, Oregon Health and Science University) for data support and Robert J. Glynn, ScD, PhD (Division of Pharmacoepidemiology and Pharmacoeconomics, Brigham and Women’s Hospital, Harvard Medical School), Jessica Franklin, PhD (Optum), and Alec Walker, DPH, MD (Harvard T.H. Chan School of Public Health) for input on methodological questions.
Author Note
We have previously published a manuscript describing the development of the study database which we reference in this manuscript, 16 and currently have a manuscript under review evaluating the impact of this intervention on prescribing patterns.
Ethical Considerations
This study was submitted, approved by, and is in accordance with the Oregon Health and Science University Institutional Review Board (STUDY00020592) and granted a Federal Certificate of Confidentiality.
Consent to Participate
Informed consent was deemed unnecessary and waived by the Oregon Health and Science University Institutional Review Board (STUDY00020592).
Consent for Publication
Not applicable.
Author Contributions
Dr. El Ibrahimi had full access to all the data in the study and takes responsibility for the integrity of the data and the accuracy of the data analysis. AMB and SE were major contributors in writing the manuscript. SE, MH, KB, and RW contributed to dataset preparation and analysis. BH, ES, VS, and MF were involved in interpretation of the findings. BH and MF conceptualized the study and obtained study funding. All authors read and approved the final manuscript.
Funding
The authors disclosed receipt of the following financial support for the research, authorship, and/or publication of this article: The authors disclosed receipt of the following financial support for the research, authorship, and/or publication of this article: This work was supported by the Centers for Disease Control and Prevention (R01CE003153).
Declaration of Conflicting Interests
The authors declared no potential conflicts of interest with respect to the research, authorship, and/or publication of this article.
Data Availability Statement
The datasets generated and analyzed during the study are not publicly available to protect the confidentiality of the intervention. De-identified datasets are available from the corresponding author on reasonable request and approval of the IRB.
Supplemental Material
Supplemental material for this article is available online.
References
Supplementary Material
Please find the following supplemental material available below.
For Open Access articles published under a Creative Commons License, all supplemental material carries the same license as the article it is associated with.
For non-Open Access articles published, all supplemental material carries a non-exclusive license, and permission requests for re-use of supplemental material or any part of supplemental material shall be sent directly to the copyright owner as specified in the copyright notice associated with the article.