
Abstract
Introduction:
Genetic testing helps individuals with disease management, family planning, and medical decision-making. Identifying individual-level factors related to the use of genetic services is essential but may only partially explain differential genetic service usage. To address this knowledge gap, we analyzed data on a national sample of US adults to evaluate whether higher neighborhood vulnerability is significantly associated with lower genetic testing utilization, controlling for sociodemographic and health characteristics.
Methods:
A 2024 nationally representative cross-sectional survey of 631 US adults recruited using NORC’s probability-based AmeriSpeak panel. Genetic testing uptake was measured as self-reported ever use of ancestry, personal trait, specific disease, or prenatal genetic carrier testing. Secondary outcomes were indicator variables for each genetic testing type. Neighborhood vulnerability (low versus high) was measured by the Social Vulnerability Index, capturing socioeconomic factors affecting community resilience to natural hazards and disasters.
Results:
Forty-eight percent of the weighted sample used genetic testing services. Compared to those in low vulnerability areas, individuals in high vulnerability areas had 42% lower odds (adjusted OR: 0.58, 95% CI: 0.37-0.90) of using genetic testing services, controlling for individual-level characteristics. Secondary analyses showed no evidence of statistically significant relationships between neighborhood vulnerability and specific types of genetic testing services.
Conclusion:
Findings suggest that neighborhood vulnerability may contribute to differences in genetic testing uptake, which is crucial to increasing early detection of cancer susceptibility and reducing US cancer incidence. This study demonstrates the importance of going beyond examining individual characteristics to investigating structural factors negatively impacting genetic testing usage.
Keywords
Introduction
Genetic testing—a tool for assessing susceptibility to health conditions—helps individuals with disease management, family planning, and medical decision-making. 1 For example, inherited genetic mutations can significantly increase an individual’s risk of developing conditions such as cancer, and genetic testing can inform prevention and screening recommendations.2-4 Other types of genetic testing, such as carrier screening, can inform reproductive decision making by identifying genetic diseases that may be passed on to biological children. 5 Prior research indicates that lower genetic testing use is associated with individual-level characteristics.1,6-18 For example, data from the 2020 Health Information National Trends Survey suggest that lower genetic testing usage is related to male sex, low income, not having a personal cancer history, and minoritized race/ethnicity (non-Hispanic Black and Hispanic). 1 Identifying individual-level factors related to the use of genetic services is essential but may only partially explain differential genetic service usage. Prior research has shown that factors related to the health care institution and neighborhood may impact genetic services use,19-21 but research on these structural drivers is limited, particularly for neighborhood-level factors.
Neighborhood vulnerability refers to “the demographic and socioeconomic factors that adversely affect communities that encounter hazards and other community-level stressors.” 22 These factors include socioeconomic status (eg, percent of the population living below 150% of the poverty threshold), household characteristics (eg, single-parent households), racial and ethnic minority status (eg, percent of the population identified as non-Hispanic Black or African American), and housing type and transportation (eg, percent of the population with no vehicle). 23 It is plausible that neighborhood vulnerability—a structural factor—may also contribute to differences in genetic service use given their negative effects on health outcomes and utilization. 24 Individuals living in disadvantaged neighborhoods have higher mortality rates, longer times between routine clinic visits, and poorer chronic disease management than individuals in advantaged areas.25-27 However, the literature has mixed conclusions regarding the association between neighborhood disadvantage and genetic service utilization.21,28,29 Studies using single measures of socioeconomic disadvantage (eg, neighborhood education level, wealthy zip code) show no significant relationship with genetic service use.28,29 In contrast, our recent report based on the Social Vulnerability Index—a multi-domain measure of neighborhood social vulnerability—demonstrated that neighborhood vulnerability was negatively associated with initiation of pre-test genetic services. 21 Given these inconsistent patterns, more work is needed to clarify the relationship between socioeconomic disadvantage and genetic service utilization. In addition, the findings from previous studies—including our recent report—are based on data from certain patient populations (eg, neurology patients) in health systems servicing specific geographic areas (eg, NYU Langone Health [New York, NY], Henry Ford Health System [Detroit, MI]), limiting generalizability.21,28,29 Investigating the role of neighborhood vulnerability, as assessed through a multi-domain measure, is essential to inform the development of structural-level approaches to improve equitable uptake of genetic services.
To address this knowledge gap, we analyzed data on a national sample of US adults to evaluate whether higher neighborhood vulnerability is significantly associated with lower genetic testing utilization, controlling for sociodemographic and health characteristics. We hypothesized that adults living in areas with high neighborhood vulnerability would have lower odds of using genetic testing services than those in low vulnerability areas, even after adjusting for sociodemographic and health factors. Secondary analyses explored neighborhood vulnerability and its associations with different types of genetic testing: ancestry, personal trait, specific disease, and prenatal genetic carrier testing.
Methods
Study Design, Setting, and Sample
We analyzed data from the 2024 Measurement of Genetic Literacy Survey, a questionnaire assessing genetic literacy and possible predictors of access to genetic services for patients. This survey was administered by NORC at the University of Chicago using the probability-based AmeriSpeak® panel. 30 NORC constructed the sample using strata based on sociodemographic characteristics (age, race/ethnicity, education, and gender) to make the participating panel members a representative sample of US adults aged 18 years or older. Study participants completed the survey using a mobile application, web portal, or email invitation link. Individuals received email reminders 3 days after the initial survey invite, every 5 days thereafter, and the day before the last recruitment day. This survey was fielded from July 29, 2024, to August 15, 2024, and oversampled individuals from mountain states: Utah, Idaho, Montana, Nevada, and Wyoming. These oversampled study participants were weighted down in the analyses to match their proportion of the US population. Sampling weights accounted for the complex survey design, including selection probabilities, participant nonresponse, and poststratification adjustments. The survey was administered in English and took participants about 20 minutes to complete. All participants provided informed consent and received three US dollars for completing the survey based on NORC policies. The University of Utah Institutional Review Board approved this study protocol. The current investigation adhered to the Strengthening the Reporting of Observational Studies in Epidemiology guidelines. A total of 650 individuals completed the survey. We excluded 19 (3%) participants with missing data, resulting in a final unweighted analytic sample of 631 participants. The sampling weights (mean = 0.990309) ranged from 0.000313 to 7.295777. Thus, the weighted sample slightly differed from the unweighted sample.
Genetic Testing Use
Genetic testing uptake was measured using one item from the Health Information National Trends Survey. 31 Participants were shown the following text: “Genes are inherited from your parents and are passed down from one generation to the next through the family tree. Genetic tests can determine your genetic makeup.” Subsequently, the survey asked participants, “Which of the following types of genetic tests have you had? Please select all that apply.” Response options were as follows: (a) Ancestry testing to understand where you and your relatives are from (for example, tests offered by companies such as Ancestry or 23andMe), (b) Personal trait testing to understand whether you have genes that are linked to certain characteristics like enjoying the taste of cilantro (for example, tests offered by companies such as Ancestry or 23andMe), (c) Testing for specific diseases to understand your risk of getting certain diseases such as breast cancer, colon cancer, cardiovascular (heart) disease, diabetes, or dementia/Alzheimer’s, (d) Prenatal genetic carrier testing to determine the risk that a man and a woman will have a baby with certain diseases such as cystic fibrosis or Tay Sachs, (e) Other, and (f) I have not heard of any genetic tests. Participants who selected “Other” provided text write-in responses such as “Disease strains and medicine resistance,” “Genesite [sic],” and “Prison DNA swabs.” We defined the primary outcome as whether the participant had undergone genetic testing in the past. Secondary outcomes were derived as four individual indicator variables for each genetic test type (except for other). These outcome measures have been employed in recent studies of nationally representative samples.1,6,7
Neighborhood Vulnerability
We merged participants’ census tract data to the 2022 Social Vulnerability Index, a measure of neighborhood vulnerability. 23 This index comprises 15 indicators across the following content areas: household composition, transportation, economic opportunities and resources, racial/ethnic composition, education, housing resources, and disability. Index values range from 0 to 1, with higher values indicating higher percentile ranking of neighborhood vulnerability (eg, 0.60 represents the 60th percentile). A cut-point of 0.25 was used to operationalize low neighborhood vulnerability (≤25th percentile) versus high neighborhood vulnerability (>25th percentile).
Covariates
We controlled for sociodemographic and health factors that could confound the relationship between neighborhood vulnerability and genetic testing uptake. Sociodemographic factors included age (measured continuously), sex (male vs female), race/ethnicity (non-Hispanic White, non-Hispanic Black, Hispanic, Other), educational attainment (high school or less, some college education/associate’s degree, bachelor’s degree or higher), employed status (yes vs no), income (<$30 000, $30 000 to <$60 000, $60 000 to <$100 000, $100 000, or more), and marital status (married, divorced/separated/widowed, never married). Health characteristics included health insurance coverage (private, public, uninsured), self-rated health status (good/very good/excellent vs fair/poor), personal cancer history (yes vs no), family cancer history (yes vs no), and health literacy.
We assessed health literacy using the validated Brief Health Literacy Screen.32,33 The four items included (1) “How often do you have someone (like a family member, friend, hospital/clinic worker or caregiver) help you read hospital materials?” (2) “How often do you have problems learning about your medical condition because of difficulty understanding written information?” (3) “How often do you have a problem understanding what is told to you about your medical condition?” (4) “How confident are you filling out medical forms by yourself?” The first three questions were rated using a 5-point Likert scale from all of the time (1) to none of the time (5). The fourth question was rated on a scale from not at all (1) to extremely (5). Scores were summed (Cronbach’s α = .84) and categorized as inadequate (scores 4-12), marginal (scores 13-16), or adequate health literacy (scores 17-20). 34
Statistical Analysis
We accounted for the complex survey design using the survey R package. 35 Summary statistics were computed for all variables. Bivariate tests assessed differences in sample characteristics by neighborhood vulnerability. We fit three weighted logistic regression models to quantify the associations between neighborhood vulnerability and overall genetic testing uptake. Model 1 assessed the unadjusted relationship. To evaluate whether neighborhood vulnerability associations strengthened or attenuated, Model 2 controlled for sociodemographic factors, and Model 3 further adjusted for health characteristics. We used a similar staggered modeling approach to quantify the associations between neighborhood vulnerability and each secondary outcome (ancestry testing, personal trait testing, testing for specific diseases, and prenatal genetic carrier testing). We plotted predicted probabilities for interpretability. Statistical significance was assessed as a 2-sided P < .05. Statistical analyses were performed in R version 4.4.2 (R Core Team, R Foundation for Statistical Computing).
Results
Weighted Sample Statistics
After applying sampling weights, the final weighted sample consisted of 625 US adults (mean age: 49 years, SD = 18). Of these individuals, 76% lived in high vulnerability areas, with 51% who were female, 61% non-Hispanic White, and 90% with no personal history of cancer (Table 1). Forty-eight percent used genetic testing services, with 29% testing for ancestry, 15% for specific diseases, 13% for prenatal genetic carriers, and 8% for personal traits. Compared to those in low vulnerability areas, individuals in high vulnerability areas were more likely to identify as non-Hispanic Black (14% vs 2%, P = .018), have an annual household income less than $30 000 (25% vs 15%, P = .008), and have never married (35% vs 28%, P = .019).
Distribution of Sample Characteristics, Overall and by Neighborhood Vulnerability, Measurement of Genetic Literacy Survey, 2024.

Wilcoxon rank-sum test for complex survey samples; chi-squared test with Rao and Scott’s second-order correction.
Bold font indicates p<0.05.
Associations Between Neighborhood Vulnerability and Genetic Testing Use
The three weighted models relating the odds of genetic testing use to neighborhood vulnerability are presented in Table 2. The unadjusted model (Model 1) indicated that, without controlling for any covariates, individuals in high vulnerability areas had 36% lower odds (OR: 0.64, 95% CI: 0.41-0.99) of using genetic testing services. This association strengthened to a 45% reduction in odds (adjusted OR: 0.55, 95% CI: 0.36-0.84) after adjusting for age, sex, race/ethnicity, educational attainment, employment status, annual household income, and marital status. Compared to Model 2, Model 3 indicated a slightly attenuated association (adjusted OR: 0.58, 95% CI: 0.37-0.90) when health factors were included in the model. Secondary analyses showed no evidence of statistically significant relationships between neighborhood vulnerability and specific types of genetic testing services (all P ≥ .40, Table 3).
Associations Between Neighborhood Vulnerability and Genetic Testing Uptake, Measurement of Genetic Literacy Survey, 2024 (Primary Analysis).

Abbreviations: CI, confidence interval; OR, odds ratio.
Model 1 was unadjusted; Model 2 controlled for age, sex, race/ethnicity, educational attainment, employment status, annual household income, and marital status; and Model 3 controlled for age, sex, race/ethnicity, educational attainment, employment status, annual household income, marital status, health insurance, self-rated health, personal and family cancer history, and health literacy.
Bold font indicates p<0.05.
Associations Between Neighborhood Vulnerability and Different Types of Genetic Testing Uptake (Ancestry Testing, Personal Trait Testing, Testing for Specific Diseases, and Prenatal Genetic Carrier Testing), Measurement of Genetic Literacy Survey, 2024 (Secondary Analyses).

Abbreviations: CI, confidence interval; OR, odds ratio.
All models controlled for age, sex, race/ethnicity, educational attainment, employment status, annual household income, marital status, health insurance, self-rated health, personal and family cancer history, and health literacy.
Figure 1 displays the predicted probabilities based on the fully adjusted model for each outcome. The plotted results show noticeable differences in the probability of using genetic testing overall across neighborhood vulnerability levels. By contrast, the probabilities for each secondary outcome do not differ by neighborhood vulnerability.
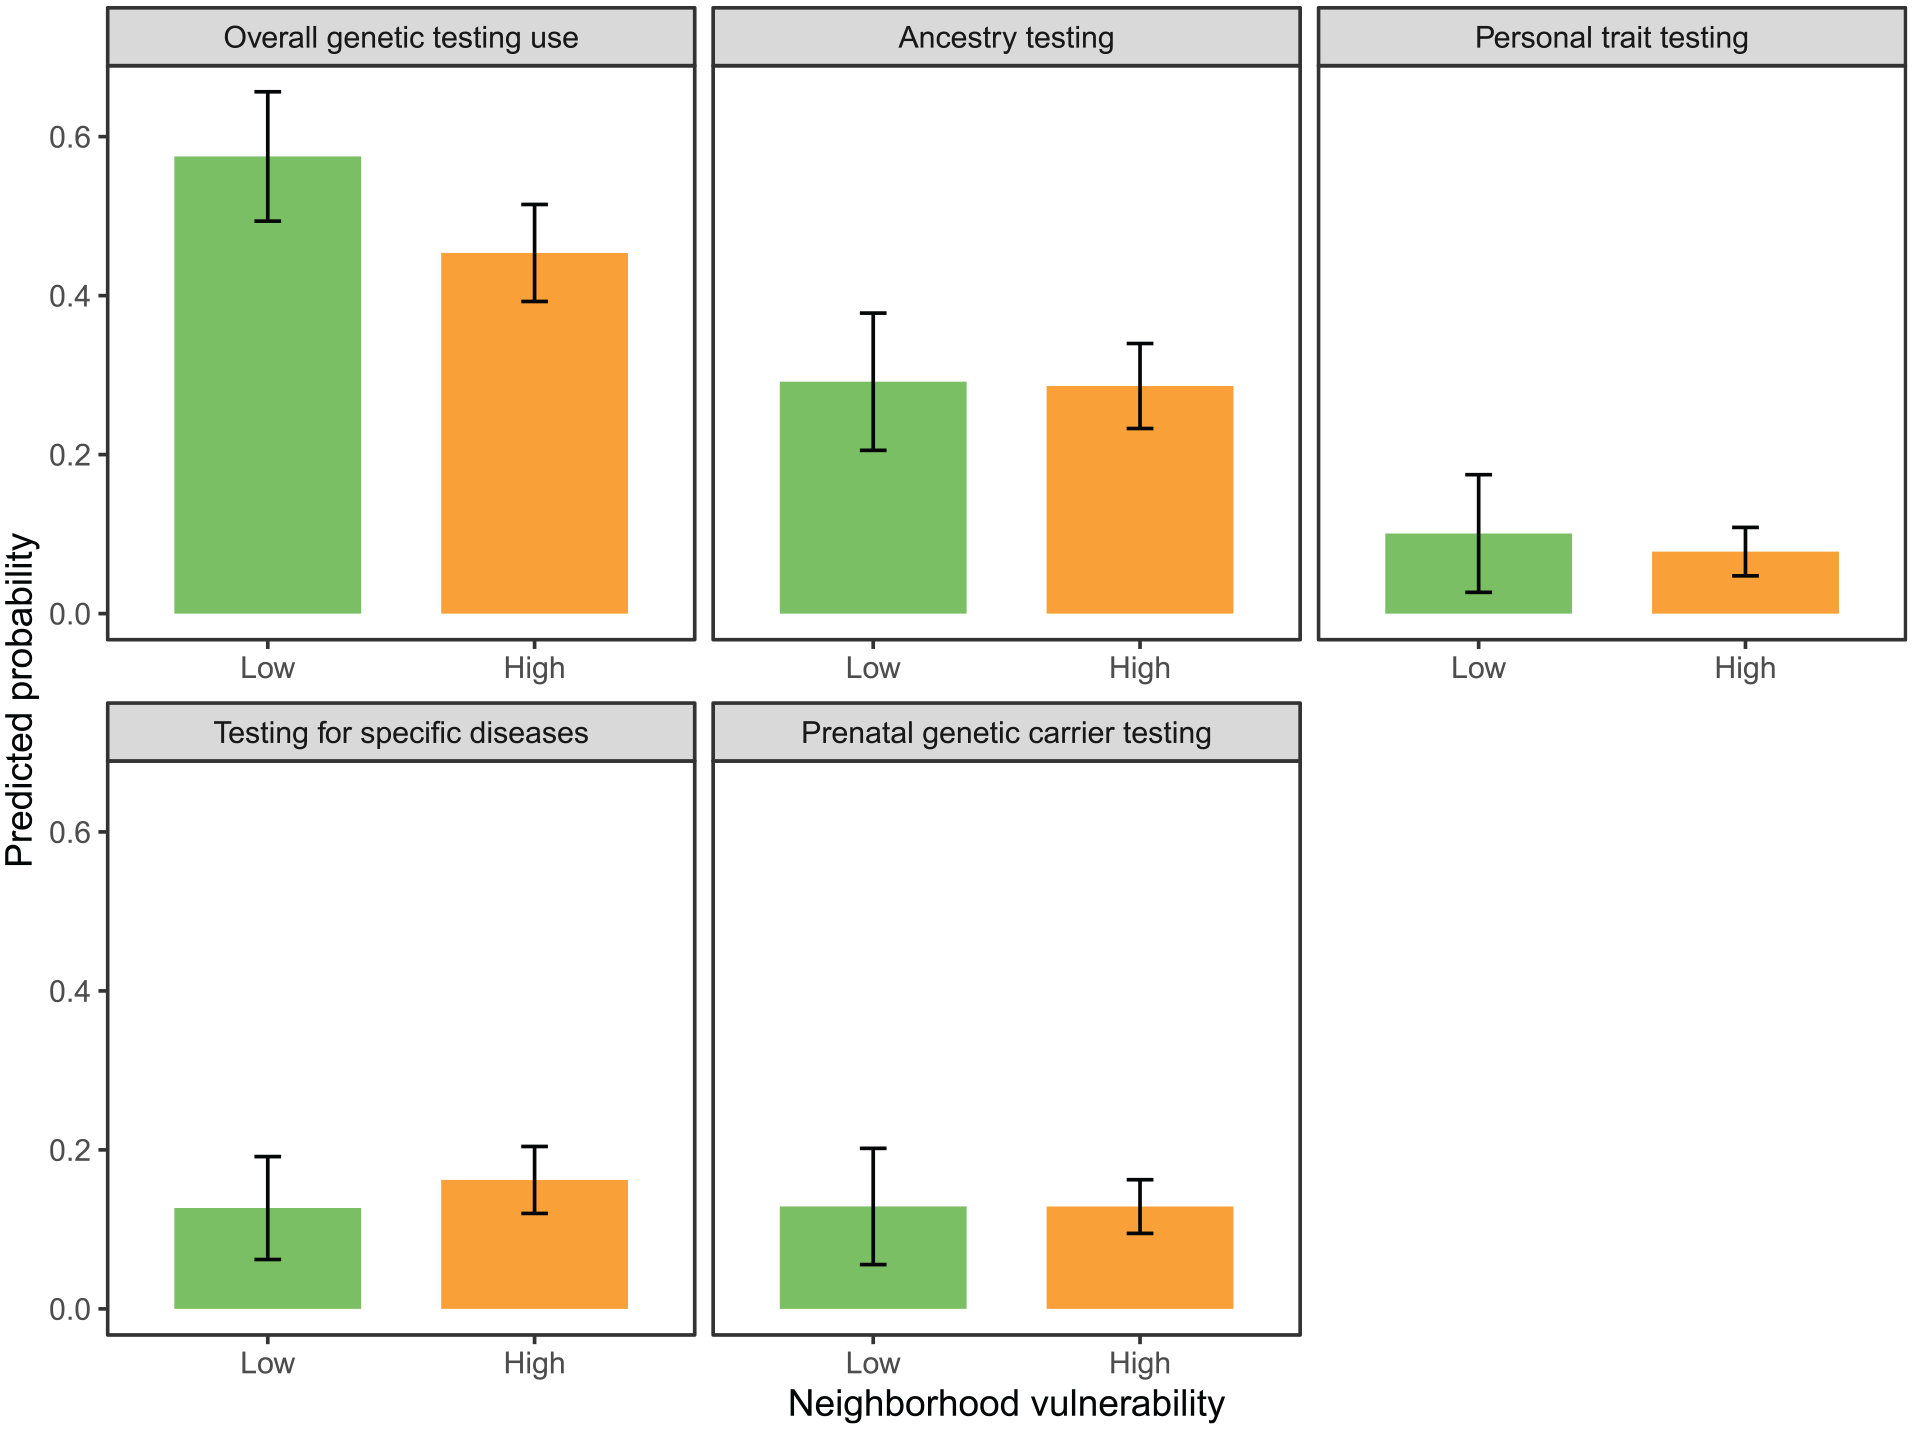
Average predicted probabilities, overall and by different types of genetic testing uptake (ancestry testing, personal trait testing, testing for specific diseases, and prenatal genetic carrier testing), Measurement of Genetic Literacy Survey, 2024. Predicted probabilities were averaged over the sample and aggregated by neighborhood vulnerability category.
Discussion
Genetic testing can inform health decisions across the lifespan, reducing disease burden for individuals and families. 1 However, there is a dearth of evidence on structural drivers of genetic testing uptake. Despite extensive research on individual-level factors influencing genetic service utilization,1,6-18 considerably less attention has been given to structural determinants. We present a novel investigation quantifying the association between neighborhood vulnerability and genetic testing usage among a nationally representative sample of US adults. We found that the odds of using genetic testing services were significantly lower among individuals in high vulnerability areas compared to those in low vulnerability areas, even after controlling for individual-level characteristics. This evidence further supports the notion of moving beyond examining socially constructed variables (eg, race/ethnicity), which are proxies of structural mechanisms that negatively affect health utilization and outcomes.24,36
Results from previous studies of neighborhood disadvantage and genetic testing use are varied.21,28,29 A study conducted among Henry Ford Health System patients reported that 47% of individuals living in highly educated areas completed genetic testing compared to 41% of those in areas with low education levels, but this association was not statistically significant after adjusting for race and gender. 28 Similar conclusions were drawn among a sample of neurology patients in the University of Pennsylvania Health System. 29 The unadjusted results from that study indicated that patients residing in low socioeconomic status areas had significantly decreased odds of attending a neurogenetics visit. 29 However, this relationship attenuated to non-significance after controlling for race, ethnicity, and insurance coverage. 29
In contrast, the present study and our previous report demonstrate statistically significant differences in genetic testing uptake across neighborhood levels of socioeconomic advantage. 21 A key distinction between our studies and the studies concluding non-significance is the measurement of neighborhood disadvantage. The Henry Ford Health System study defined neighborhood education as census blocks with 10% or more of residents with high school or less education (“low”) versus census blocks with <10% of residents with high school or less education (“high”). 28 The University of Pennsylvania Health System study characterized neighborhood socioeconomic status using quartiles of median household income based on zip code. 29 In contrast, the present study used the Social Vulnerability Index, a comprehensive measure based on 15 indicators (eg, housing cost burden, English language proficiency, crowding). 23 This underpins the importance of assessing neighborhoods in social genomics research as multi-dimensional instead of as singular measures.
The current investigation found a significant association between neighborhood disadvantage and genetic testing uptake, which may be explained by several mechanisms. Firstly, compared to those in advantaged areas, individuals in disadvantaged neighborhoods have poorer healthcare access, infrastructure, and quality. 36 As a result, clinicians servicing these areas may have limited time and resources to discuss genetic testing and facilitate genetic testing access to their patients. Secondly, disadvantaged neighborhoods (vs advantaged areas) have weaker social capital and information-sharing networks. 37 Therefore, awareness and experiences with genetic testing services may spread less rapidly among low-resourced communities. 38 Lastly, disadvantaged neighborhoods often have a high proportion of racially-minoritized residents who tend to have less trust in the healthcare system than their non-minoritized counterparts. 39 A potential consequence is that, due to worries of potential misuse, individuals from disadvantaged areas may have a low propensity to share their genetic information with genetic testing services.40,41 These mechanisms collectively demonstrate the pathways by which neighborhood vulnerability may impact genetic testing uptake.
The study results should be considered in the context of its limitations. The observed associations do not infer causality. Future investigations should explore longitudinal designs to establish whether there is a causal relationship between neighborhood vulnerability and genetic testing usage. The secondary analyses were underpowered to detect statistically significant associations between neighborhood vulnerability and specific types of genetic testing. Therefore, the null findings should be interpreted with caution, as they may reflect insufficient statistical power rather than the true absence of associations. Future studies with larger samples are needed to examine these relationships.
Another potential limitation was the subjective measure of genetic testing uptake, which may be susceptible to recall and social desirability bias. Still, this measure may provide more insights than medical records given the range of types of genetic testing investigated since individuals may pursue direct-to-consumer genetic testing services (eg, AncestryDNA, DNAFit) that usually are not linked to electronic health records.42,43 We acknowledge that the survey did not distinguish whether healthcare providers offered participants testing versus seeking it independently. This distinction is vital as some testing types (specific disease and prenatal) typically require provider referral, while others (ancestry and personal trait) are available directly to consumers.42,43 Future research should examine whether neighborhood vulnerability affects provider recommendations for genetic testing, insurance coverage for testing services, and awareness of testing options.
The survey’s English-only administration limits this study’s generalizability to English-speaking populations. While NORC’s sampling methods cover 97% of US households, 30 this study’s findings may not fully represent the experiences of linguistic minority communities. Future studies should include multiple languages to better capture the diverse experiences of all US residents regarding genetic testing access and utilization. Unmeasured confounding (eg, gene mutation risk, Ashkenazi Jewish heritage) is also plausible but may have been minimized because we controlled for key sociodemographic and health factors (eg, personal/family cancer history, health literacy). We did not have information on local genetic service availability and specific measures of the proposed mechanisms (healthcare access, information-sharing networks, and trust levels in healthcare systems), which would require additional geospatial and community-level data collection in future studies to test these pathways directly. Lastly, since genetic testing could have occurred months or years before the survey, this temporal mismatch represents a limitation of this study’s cross-sectional design. Longitudinal studies tracking neighborhood conditions and genetic testing uptake over time would address this limitation.
Despite those limitations, the current study has several strengths, including its probability-based sampling design, novel application of the Social Vulnerability Index, and comprehensive analyses across different types of genetic testing services. We incorporated analytic weights to account for the 21% (650 out of 3147 invited individuals) survey completion rate, selection bias, and non-response bias. These weights were calibrated using NORC’s post-stratification adjustment procedures to align with known population parameters, strengthening the generalizability of this study’s findings to the US adult population. Seventy-six percent of the weighted sample lived in areas with high neighborhood vulnerability, aligning with the 74.4% national estimate in 2022. 23 Generalizability is also vital given that national recommendations for cancer screenings have evolved to include younger age groups. 44 The novel application of the Social Vulnerability Index in relation to genetic testing utilization permitted us to evaluate the relationships of neighborhood vulnerability with ancestry, personal traits, specific diseases, and prenatal genetic carrier testing. These strengths enable the current investigation to inform the broader research agenda for mitigating inequities in genetic testing usage and have important implications for the advancement of personalized and precision medicine, which relies on equitable access to genetic testing services across diverse communities.
Conclusion
Using data from a national representative sample of US adults, we found that high neighborhood vulnerability was associated with lower odds of using genetic testing services, controlling for sociodemographic and health factors. This finding suggests that neighborhood disadvantage may contribute to differences in genetic testing uptake, which is crucial to increasing early detection of cancer susceptibility and reducing cancer incidence in the US. The insights from this study demonstrate the importance of going beyond the examination of individual characteristics (eg, race/ethnicity) to investigating structural factors that may negatively impact genetic testing usage.
Footnotes
Acknowledgements
We greatly appreciate the reviewers and the editorial team for taking the time to review our manuscript and providing constructive comments.
Ethical Considerations
The University of Utah Institutional Review Board approved this study protocol.
Consent to Participate
NORC obtained informed consent from all participating AmeriSpeak® panel members.
Author Contributions
Conceptualization: JRB, MSG, KAK. Data curation: JRB, KAK. Formal analysis: JRB. Investigation: JRB, MSG, KAK. Methodology: JRB. Validation: MSG, KAK. Writing-original draft: JRB. Writing-review & editing: MSG, KAK.
Funding
The author(s) disclosed receipt of the following financial support for the research, authorship, and/or publication of this article: The authors received funding from the Huntsman Cancer Foundation to support data collection.
Declaration of Conflicting Interests
The author(s) declared no potential conflicts of interest with respect to the research, authorship, and/or publication of this article.
Data Availability Statement
The data supporting this study’s findings are available from Drs. Kaphingst (