
Abstract
Introduction:
Despite rising rates of depression and diabetes, assessments of depression’s burden on diabetes management and its economic burden remain limited. In this study, we evaluate the burden of depression on diabetes management and quantify the financial implications of comorbid depression and diabetes.
Methods:
We performed propensity score matching on Texas commercial claims data (2016-2019) to match type 2 diabetes patients with depression (n = 613) to those without (n = 583). Depression flagged in 2016/2017 indicated initial depression, and an A1C level of ≥8% in 2018/2019 indicated follow-up uncontrolled diabetes. Healthcare costs included total, diabetes-related, outpatient, and inpatient costs incurred during 2018/2019.
Results:
A depression flag in the initial period was linked to a 2.7 percentage point increase (P = .031) in the probability of having an A1C level of ≥8% in the follow-up, compared to individuals without a depression flag. Having both a depression flag and uncontrolled A1C in the initial period was associated with $2,037 higher total medical costs (P = .004), $494 higher diabetes-related costs (P = .020), and $336 higher outpatient costs (P = .008) in the follow-up, compared to the respective averages of $6,900, $474, and $583 for individuals without a depression flag or uncontrolled A1C.
Conclusions:
Our findings highlight the detrimental effect of depression on uncontrolled diabetes and the subsequent increase in healthcare costs. Further research is warranted to determine the effectiveness of proactive treatments for depression in managing diabetes, improving glycemic control, and reducing healthcare costs.
Introduction
Depression frequently co-occurs with diabetes 1 and complicates the management and outcomes of both conditions. It is estimated that 18% to 25% of people with type 2 diabetes will meet the criteria for a major depressive episode, 2 which is associated with a 60% higher risk of developing type 2 diabetes. 3 A recent systematic review confirmed the comorbid nature of depression and diabetes, showing a significantly higher prevalence of depression in people with type 2 diabetes (19% vs 11%) compared to those without diabetes. 4 Comorbid depression and diabetes are likely to occur more frequently as the prevalence of both conditions is projected to increase. The projected number of adults with diabetes has been estimated to increase from 22.3 million (9.1%) in 2014 to 39.7 million (13.9%) in 2030, and to 60.6 million (17.9%) in 2060. 5 Similarly, the estimated total number of U.S. adults with depressive disorder would increase by 35%, from 33.9 million in 2005 to 45.8 million in 2050. 6 Sociodemographic characteristics such as age, 7 sex, 7 health insurance coverage, 8 and rurality 9 have been linked to current and projected levels of diabetes and depression.
The financial burden of comorbid diabetes and depression is significant. 10 Roughly 37% of healthcare expenditures for those with diabetes can be attributed to a comorbidity, such as depression. 11 In another early study, depression was associated with an estimated 50% to 75% increase in healthcare costs. 12 The individual incremental costs associated with both diabetes and depression were $6,037 per year, which is higher than for those with only depression, only diabetes, or neither. 13 A prior study found that costs for patients with diabetes and depression were $19,707 per year, compared to $11,237 for patients with diabetes but without comorbid depression. 14 Given the ever-increasing healthcare costs, identifying the financial burden of comorbid depression and diabetes is critically meaningful from both policy and program perspectives.
Previous studies were typically limited by their cross-sectional design, making it impossible to determine causality.1,15,16 A common limitation among previous research was the varying methods used to measure depression. Several studies noted that different measures were used for depression15 -17 as well as self-reported measures for depression and diabetes, 18 making comparisons difficult. Furthermore, some studies did not include any biomarkers to assess changes or diagnoses. 17 To address this research gap, this study aims to achieve three objectives: (1) to understand the characteristics of patients with a depression flag based on clinical diagnosis codes; (2) to investigate the relationship between a depression flag in earlier years (2016/2017) and an uncontrolled glycated hemoglobin (A1C) level (≥8%) in later years (2018/2019); and (3) to estimate medical costs (ie, total, diabetes-related, outpatient, and inpatient) based on the presence of a depression flag and an uncontrolled A1C level.
Methods
Study Sample
The study used claims data from a large commercial insurer with a significant presence in Texas between January 1, 2016, and December 31, 2019. 19 The raw data provided by the insurer in a longitudinal format were aggregated by quarter. Individuals with type 2 diabetes were identified using the International Classification of Diseases, 10th Revision (ICD-10) code. 20 Hemoglobin A1C values between 4 and 14 were considered valid to account for variability in the sensitivity of measurement instruments across clinical settings. Patients were included in the study if they met the following criteria: (1) commercially insured; (2) individuals with a Texas address; (3) diagnosed with type 2 diabetes (without a type 1 diabetes flag); and (4) aged 18 to 89 years. Eligible patients were required to have at least 1 quarterly health record per year between 2016 and 2019, with no gaps in enrollment allowed. Patients were also excluded if they did not have at least 1 quarterly recorded A1C value per year between 2016 and 2019.
Patient Flow
Figure 1 shows that a total of 423,646 patients were included in our analysis of uncontrolled hemoglobin A1C levels and medical costs after excluding those with type 1 diabetes and individuals who did not have at least 1 quarterly health record or quarterly recorded A1C value per year for 4 years. In the propensity score matching process (discussed later), 15,306 patients were further excluded, leaving 1,196 matched patients, including 613 with a depression flag and 583 without a depression flag. A depression flag was assigned based on patients’ clinical diagnosis of depression, including bipolar disorder (ICD-10 codes: F31.3x, F31.4, F31.5, F31.6x, F31.7x, F31.8x), major depressive disorder (F32.x, F33.x), dysthymic disorder (F34.1), and adjustment disorder with depressed mood (F43.21).
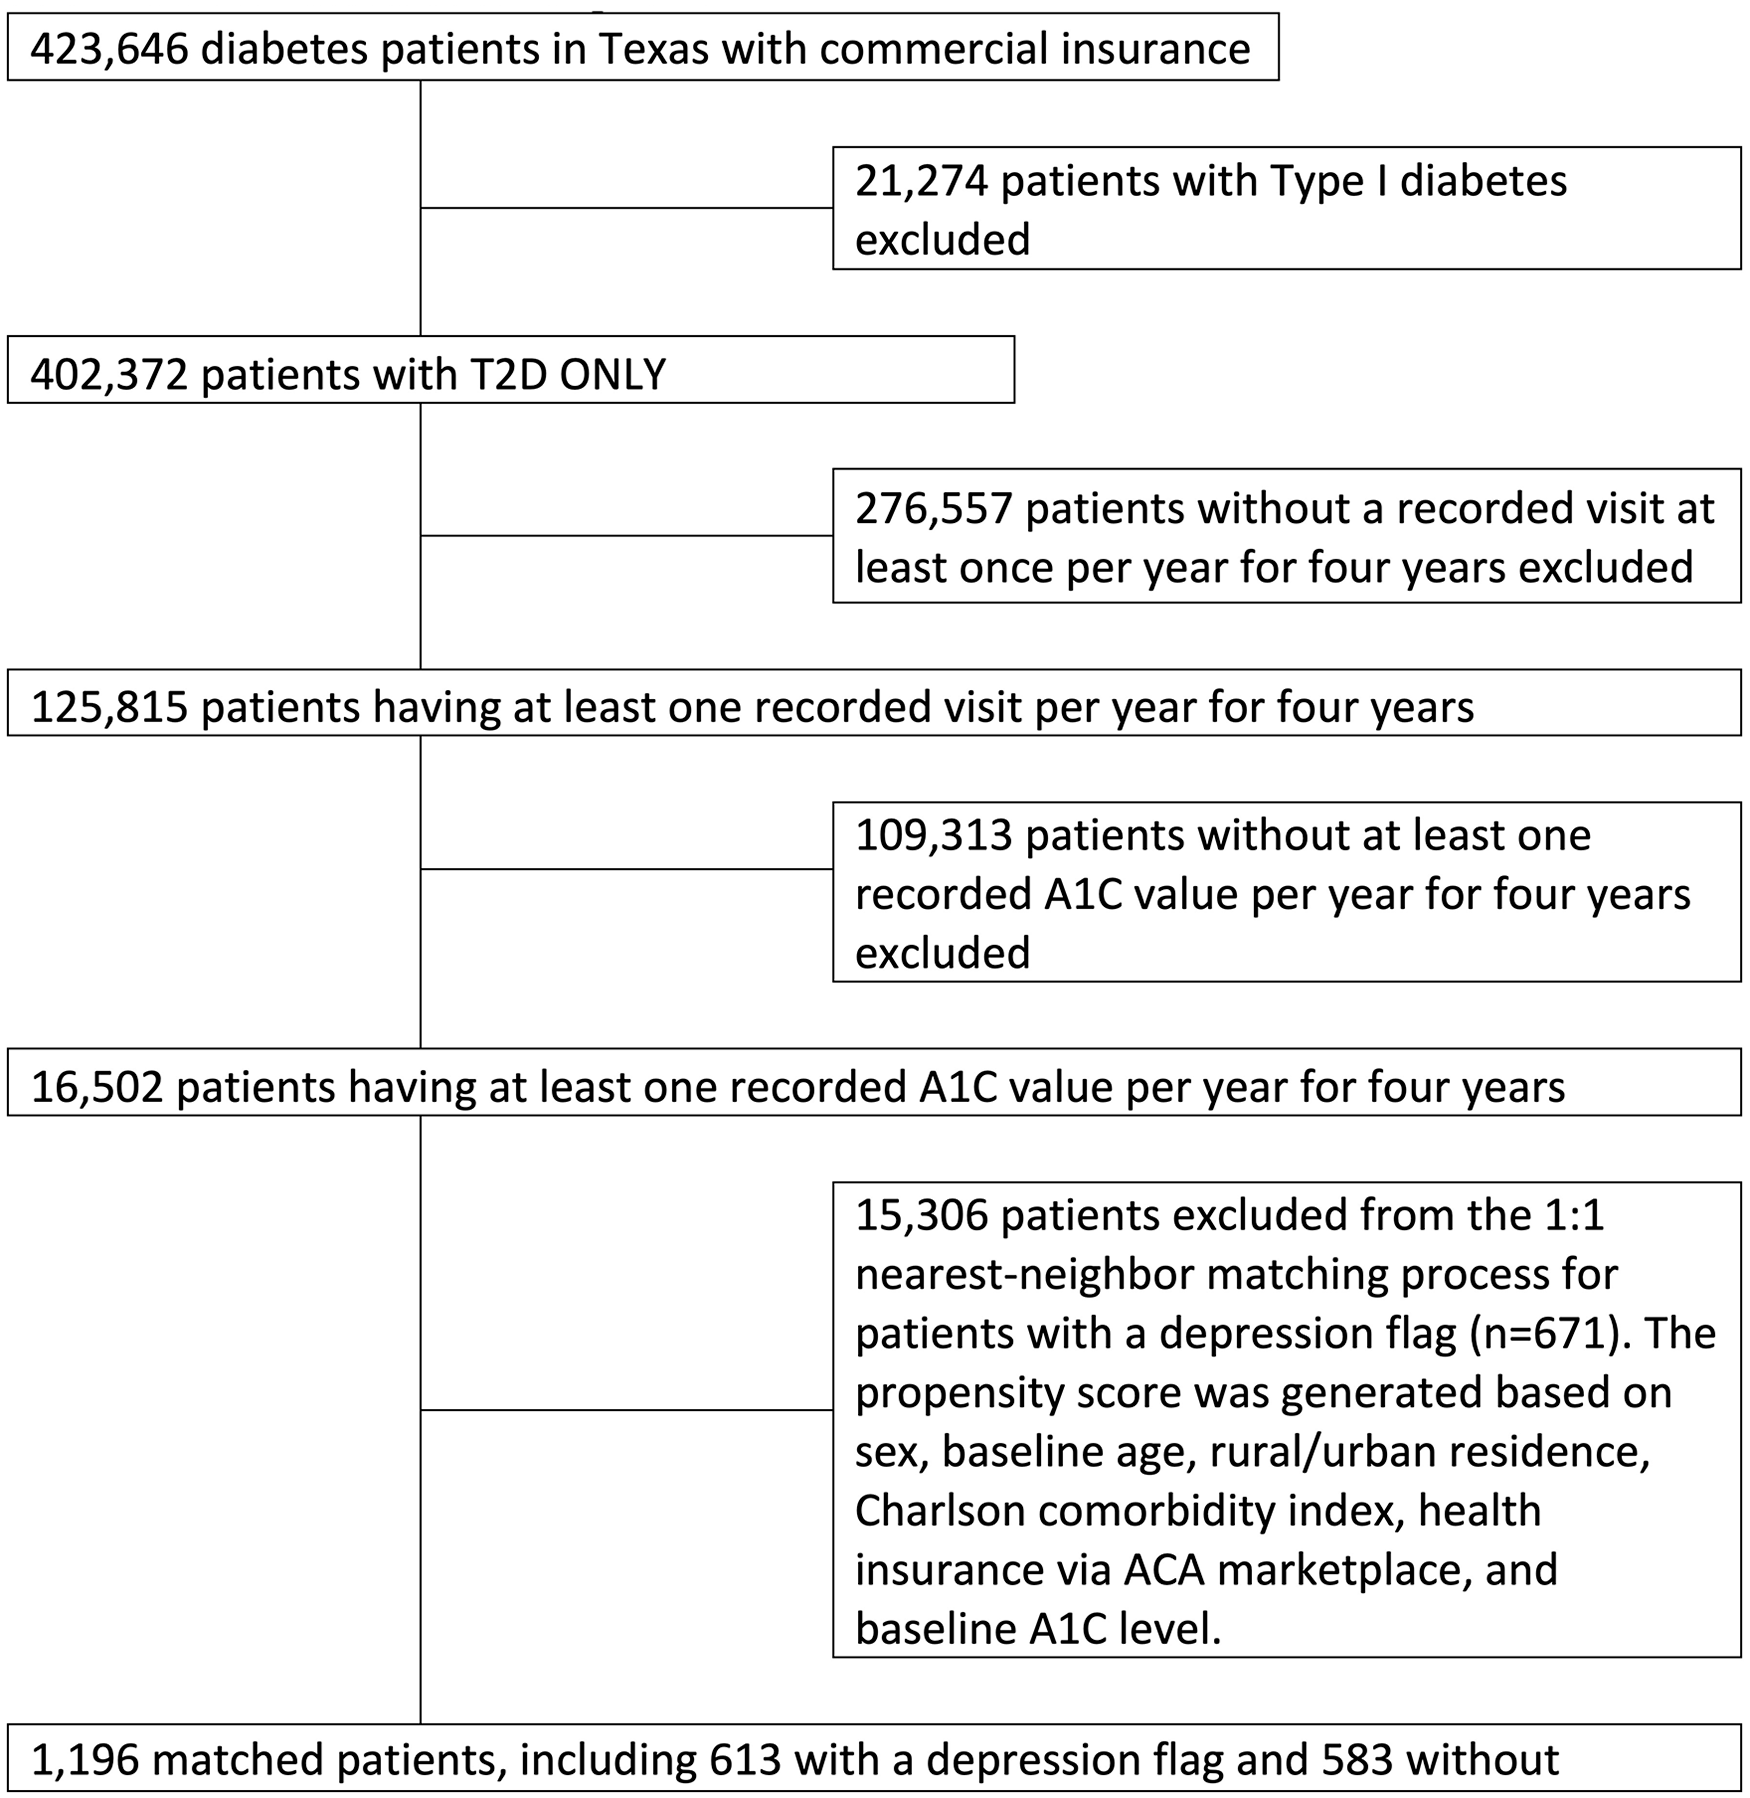
Patient flow diagram.
Measurements and Variables
Sociodemographic Characteristics
Patients’ baseline age (18 to 89 years) and sex (male/female) were used in the analyses.
Charlson Comorbidity Index (CCI)
The CCI values were available for patients based on the ICD-10 diagnosis codes. 20 In each quarter, the CCI scores are continuous, ranging from 0 (no comorbidities) to 17, with higher scores indicating a more severe condition and, consequently, a worse prognosis. 21
Non-metropolitan or Metropolitan Status
Rurality was measured based on the patient’s county of residence from a database maintained by the National Center for Health Statistics (NCHS), specifically the NCHS Urban-Rural Classification Scheme for Counties. 22 This scheme includes 6 levels: 4 for metropolitan areas (large central metro, large fringe metro, medium metro, small metro) and 2 for non-metropolitan areas (micropolitan, non-core). 22 In the analysis, these 6 levels were dichotomized to indicate rurality as either non-metropolitan or metropolitan counties. This study used the term “metro status” to reflect associations with non-metro and metro geographic residence.
Health Insurance via ACA Marketplace
Patients’ health insurance was documented and included in the analysis if they purchased coverage through the ACA marketplace at baseline (2016).
Study Outcomes
Hemoglobin A1C
The glycated hemoglobin (A1C) test measures the average plasma glucose in the previous 8 to 12 weeks. 23 Our analysis was limited to those who had A1C values in their claims record for at least 1 quarter of each year during the study period. A1C was measured by the mean and median values at baseline, defined as the first measurement in the dataset. When observing A1C longitudinally, it is a quarterly-measured value. A1C was further collapsed to create a binary variable to indicate glycemic control: 0 (controlled A1C [<8%]) vs 1 (uncontrolled A1C [≥8%]). The 8% A1C cutoff was selected based on prior empirical studies, which found that 8% was the tipping point for significantly worse outcomes, including higher rates of inpatient complications and long-term mortality.24,25
Medical Costs
The costs refer to the actual amount paid by the insurer and the patient to the provider. This is the total amount the provider receives for services rendered. All healthcare costs were adjusted to 2019 U.S. dollars using the medical care component of the U.S. Consumer Price Index. In our analyses, this study included 4 types of medical costs: total (including outpatient, inpatient, and office visits), type 2 diabetes-related, outpatient, and inpatient.
Statistical Analysis
To ensure the homogeneity of the patient participants, propensity scores were used to match patients with and without a depression flag in 2016/2017. The use of propensity score matching can decrease the risk of selection bias and adjust for potential confounders between the 2 groups. 26 Specifically, we used a nearest-neighbor 1:1 matching algorithm and covariates including sex, baseline age, rural/urban residence, Charlson Comorbidity Index, health insurance via the ACA marketplace, and baseline A1C level for estimating the log-odds of having a depression flag or not. When generating the propensity score, a caliper width of 0.005 was also used, which is 1-quarter of the standard deviation of the calculated propensity score. 27 Among matched patients, a logistic regression model was conducted to estimate the odds of having an uncontrolled A1C level in 2018/2019 based on the depression flag in 2016/2017. Regression models were further generated to estimate healthcare costs in 2018/2019 based on whether patients had a depression flag or uncontrolled A1C level in 2016/2017 among mutually exclusive groups (having neither a depression flag nor an uncontrolled A1C level, having a depression flag only, having an uncontrolled A1C level only, and having both a depression flag and uncontrolled A1C level). All statistical analyses were performed using Stata MP 18.0 (StataCorp, College Station, TX). A P-value of less than .05 was considered statistically significant.
Results
Baseline Characteristics and Medical Costs Before and After Matching
Table 1 shows the baseline characteristics of the study population regarding a depression flag in 2016/2017 before (unmatched, n = 16,502) and after (matched, n = 1,196) propensity score matching. Before matching, patients with a depression flag in 2016/2017 tended to be younger (P < .001), female (P < .001), sicker (higher CCI score; P = .002), and have a controlled A1C level in 2016 (<8.0%, P = .011). However, after matching, none of these factors remained significant at the P < .05 level. Before matching, despite not using medical costs to generate the propensity score, the depression flag in 2016/2017 was not significantly associated with any of these medical costs in 2016. After matching, a depression flag in 2016/2017 was associated with higher total medical costs ($2,193 vs $1,292 among individuals without a depression flag; P = .003) and higher outpatient medical costs ($669 vs $340) in 2016 (P = .004).
Baseline (2016) Characteristics of Study Population Regarding Depression Flag in 2016/2017 Before (Unmatched, n = 16,502) and After (Matched, n = 1,196) Propensity Score Matching.
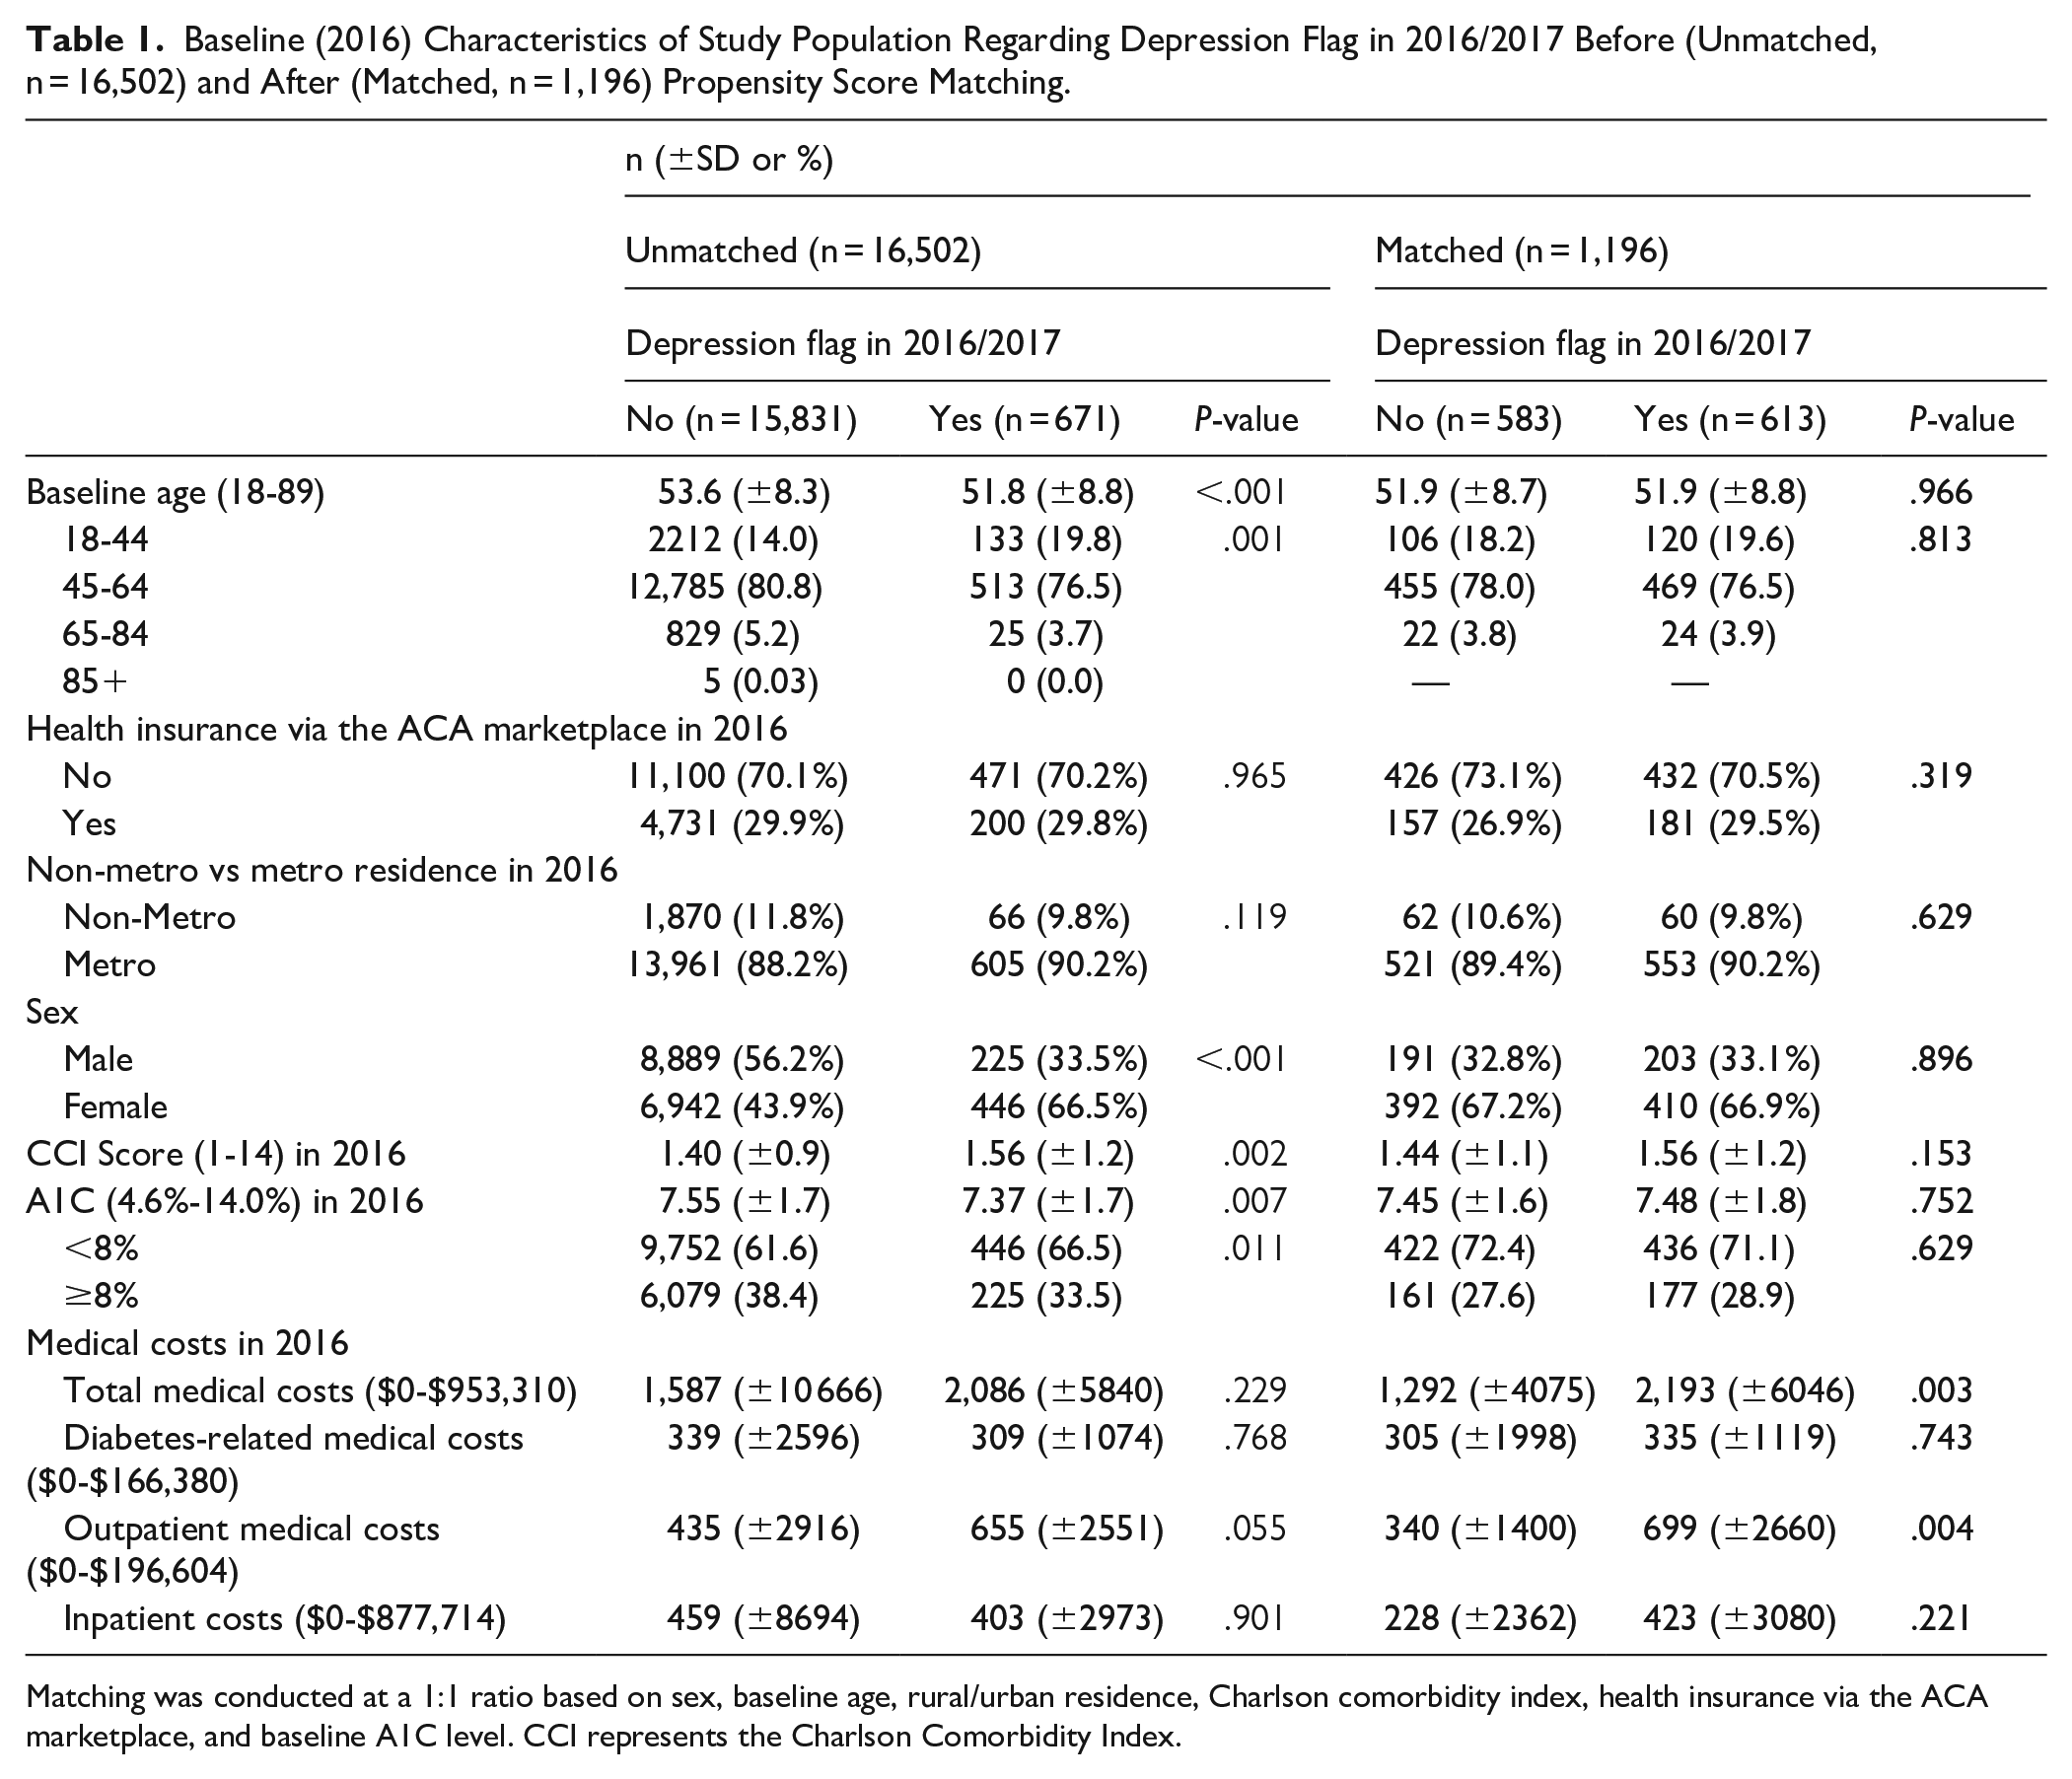
Matching was conducted at a 1:1 ratio based on sex, baseline age, rural/urban residence, Charlson comorbidity index, health insurance via the ACA marketplace, and baseline A1C level. CCI represents the Charlson Comorbidity Index.
Longitudinal Multivariate Analysis Predicting A1C Levels
With propensity score matching, Table 2 shows the results of the logistic regression of having A1C ≥ 8% in 2018/2019 based on the depression flag in 2016/2017 (n = 1,196). Controlled covariates include baseline age, health insurance via the ACA marketplace, rural/urban residence, sex, and baseline A1C level. Having a depression flag in 2016/2017 was associated with a 2.7 percentage point increase (P = .031) in the probability of having A1C ≥ 8% in 2018/2019, compared to individuals without a depression flag in 2016/2017.
Logistic Regression of Having A1C ≥ 8% in 2018/2019 Based on Depression Flag in 2016/2017 With Propensity Score Matching (n = 1,196).
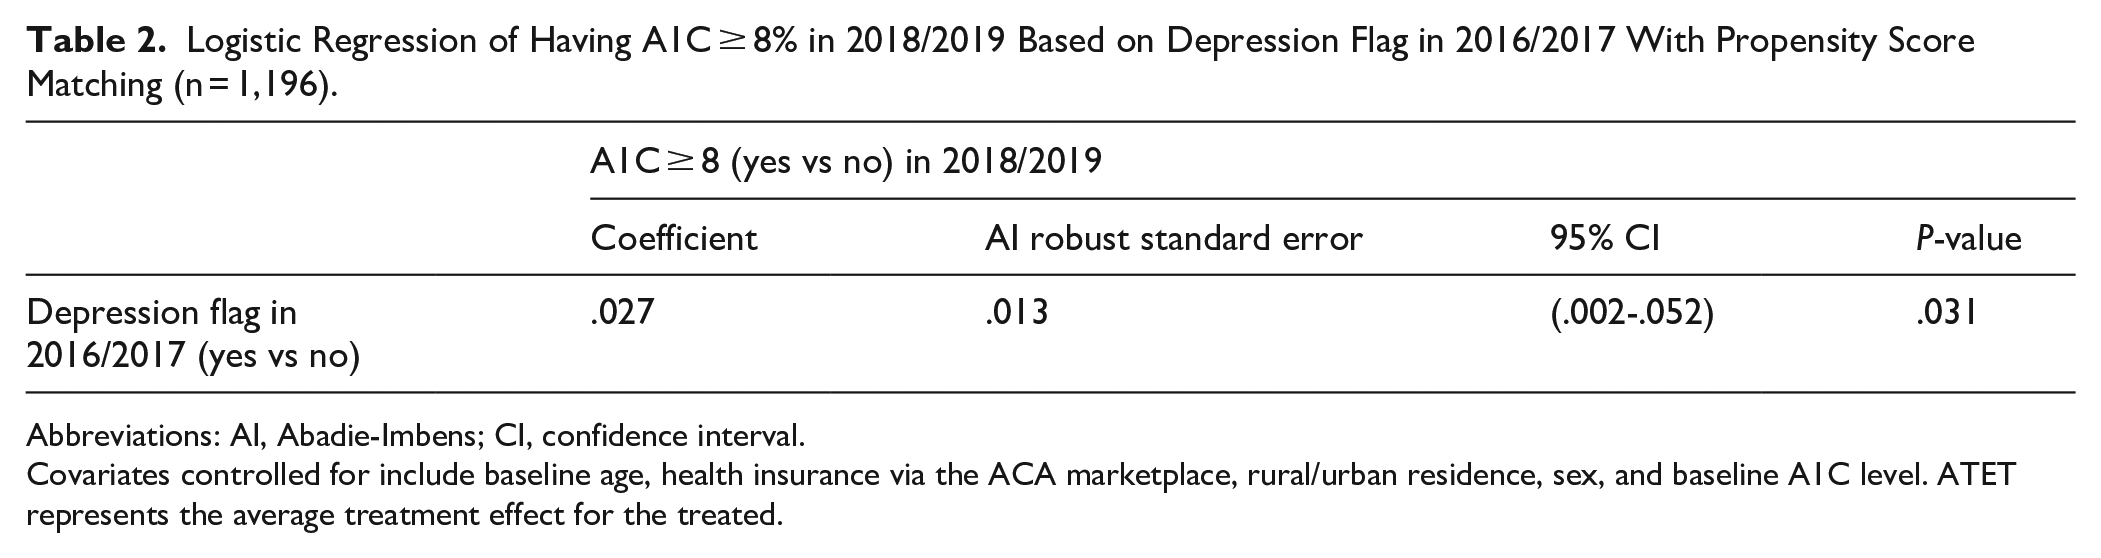
Abbreviations: AI, Abadie-Imbens; CI, confidence interval.
Covariates controlled for include baseline age, health insurance via the ACA marketplace, rural/urban residence, sex, and baseline A1C level. ATET represents the average treatment effect for the treated.
Longitudinal Multivariate Analyses Predicting Medical Costs
With propensity score matching, Table 3 presents the results of the regression analyses examining how the depression flag and uncontrolled A1C level in 2016/2017 were associated with total medical costs, diabetes-related costs, outpatient costs, and inpatient costs in 2018/2019. As aforementioned, 4 mutually exclusive groups were formed based on their depression flag and uncontrolled A1C level, including individuals with only a depression flag (Group 1), only uncontrolled A1C (Group 2), both a depression flag and uncontrolled A1C (Group 3), and neither condition (Group 0, reference group).
Regression Estimates for Medical Costs (2018-2019) Depending on Depression Status and A1C Level (2016-2017) Using Propensity Score Matching (n = 1,196).

Abbreviations: AI, Abadie-Imbens; CI, confidence interval.
Reference = no depression, A1C < 8% (Group 0). Effect size = coefficients/standard error. Covariates controlled for included baseline age, health insurance via the ACA marketplace, rural/urban residence, and sex. ATET represents the average treatment effect for the treated.
Group 1 versus Group 0: The average total medical cost for individuals with only a depression flag (Group 1) in 2016/2017 is $3,698 higher, and the average outpatient cost is $704 higher than the respective averages of $6,900 and $583 incurred in 2018/2019 by individuals with neither condition (Group 0) (both P < .001).
Group 2 versus Group 0: The average diabetes-related cost for individuals with only uncontrolled A1C (Group 2) in 2016/2017 is $495 (P < .001) higher, the average outpatient cost is $270 (P < .001) higher, and the average inpatient cost is $420 (P = .026) higher than the respective averages of $474, $583, and $765 incurred in 2018/2019 by individuals with neither condition (Group 0).
Group 3 versus Group 0: The average total medical cost for individuals with both a depression flag and uncontrolled A1C (Group 3) in 2016/2017 is $2,037 (P = .004) higher, the average diabetes-related cost is $494 (P = .020) higher, and the average outpatient cost is $336 (P = .008) higher than the respective averages of $6,900, $474, and $583 incurred in 2018/2019 by individuals with neither condition (Group 0).
Discussion
This study contributes to the literature by utilizing large administrative data from a private insurer, focusing on comorbid depression and type 2 diabetes, and examining healthcare costs with a temporal perspective. Notably, the current study found that having a depression flag in 2016/2017 is associated with a 2.7 percentage point increase in the probability of having uncontrolled A1C (≥8%) in 2018/2019, compared to individuals without a depression flag in 2016/2017. This finding is supported by prior studies.3,16,18 Similarly, a prior study reported that patients with depression (measured by the Patient Health Questionnaire-9) had 1.32 times greater prevalence of poor glycemic control (A1C ≥ 7%) than those without depression. 28 Regardless of different measurements of depression and diabetes, prior studies consistently found that coexisting depression in people with diabetes is associated with decreased adherence to treatment, 29 poor metabolic control,1,29 higher complication rates, 29 decreased quality of life, 29 increased disability, 29 and increased mortality.1,29
From a theoretical standpoint, depression and diabetes share similar biological origins, including the overactivation of innate immunity, which leads to an inflammatory response and dysregulation of the hypothalamic-pituitary-adrenal (HPA) axis.1,17,18 This theory suggests that increased HPA activity leads to higher cortisol release, decreasing insulin sensitivity. Therefore, chronically high cortisol levels, present in 50% of those with depression, may contribute to the development of diabetes. 16 Alternatively, type 2 diabetes may result from poor self-care behaviors, including unhealthy eating and lack of exercise, which are common among individuals with depression.2,18
Comorbid depression and uncontrolled diabetes require more healthcare services and can be costly. Higher healthcare utilization was observed among patients with both depression and diabetes. 14 The current study revealed that the average total medical cost for individuals with both a depression flag and uncontrolled A1C in 2016/2017 is $2,037 higher (P = .004) than the average cost of $6,900 incurred in 2018/2019 by individuals with neither condition. This finding is lower compared to a prior study based on Medical Expenditure Panel Survey (MEPS) data, 13 which reported an incremental cost of $6037 for individuals with both depression and diabetes compared to those without either condition. These differences may stem from variations in the dataset, study design, and the measures used. First, the current study, which is based on longitudinal data, differs from the MEPS study, which uses pooled data. Second, the current study utilized ICD-10 codes and lab-based A1C values, specifically focusing on uncontrolled A1C levels (≥8%), while the MEPS study relied on self-reported data. Third, the current study accounted only for inpatient stays, outpatient visits, and office visits to calculate total medical costs. In contrast, the MEPS study included additional costs such as emergency department visits, pharmacy costs, dental care, and home health services, in addition to the 3 categories considered in our study.
Moreover, unlike the MEPS study, where individuals with both conditions had the highest incremental total medical costs ($6,037), 13 the current study found that those with only depression had the highest incremental total medical costs ($3,698), surpassing those with both conditions ($2,037). These seemingly counterintuitive findings are supported by the MEPS study, which reported that the annual average aggregate estimated cost of depression alone ($238.6 billion) exceeds the cost of diabetes alone ($150.1 billion) and the combined cost of depression and diabetes ($77.6 billion). 13 Additionally, the MEPS study found that the costs associated with depression increased over time, while the costs associated with diabetes decreased. These findings support the speculation that depression could be a significant driver of higher medical costs. In a study, depression was associated with a 50% to 75% increase in health service costs among people with diabetes. 12 Higher medical costs among patients with depression may be linked to poor medical adherence, as suggested by other studies. 30 Patients with depression were 3 times more likely to be non-adherent to medication compared to non-depressed patients. 15 Poor adherence may lead to increased avoidable healthcare utilization. For example, among patients with diabetes, those with depression were more likely to make ambulatory visits (12 vs 7 visits, P = .0001) than those without depression. 31
These findings also suggest that effectively managing both depression and diabetes may help reduce overall medical costs for individuals. Proactively addressing both depression and diabetes simultaneously may assist in controlling A1C levels and preventing other diabetes-related complications. Prior intervention studies have highlighted the importance of collaborative care in helping participants with diabetes manage depression in primary care settings. 32 Psychiatrists or primary care physicians can oversee care managers and trained or specialist nurses who deliver psychological therapy and monitor progress, adjusting treatment plans as needed. 32 Various intervention modalities have significantly improved patients’ quality of life, as well as symptoms of depression and diabetes. This includes a community intervention program at a diabetes education center, 33 web-based cognitive-behavioral therapy, 34 and pharmaceutical therapy. 35 Additionally, collaborative care has been shown to reduce medical costs by 47% 36 and to decrease costs by $952 while providing 61 depression-free days over 24 months. 37
Limitations
Study limitations should be acknowledged. First, the observational nature of the study prevents us from drawing causal conclusions. Even with the presence of propensity score matching, unmeasured confounders may still exist. 38 The study relies on medical claims data, which are inherently complex and not originally collected for research purposes, leading to known limitations.39 -41 Furthermore, due to data constraints, key lifestyle factors such as dietary intake, physical activity, and medication adherence were not available. Additionally, a longer study timeline could have provided further insights into long-term health outcomes. Second, the sample size was significantly reduced due to a large amount of missing information during the process of creating a balanced and matched sample. Third, because the study population consists exclusively of insured individuals using claims data, the generalizability of the findings—particularly cost estimations related to comorbid depression and diabetes—may be limited. However, given that millions of Americans are insured, these findings remain highly relevant, particularly for individuals with T2DM in a large southern state along the U.S.-Mexico border. Fourth, there are potential measurement issues. Our binary measure of A1C (≥8% vs <8%) was chosen as a population-based threshold24,25 and may not represent individualized goals or targets for all individuals. Other thresholds, such as >9% 42 or >7%, 28 have been used in previous studies to denote uncontrolled or poorly controlled A1C, so the choice of threshold may influence the results. Finally, cross-validating claims data with clinical records could have reduced misclassification and identified demographic disparities for targeted interventions. However, data constraints prevented its inclusion in this study.
Conclusions
We found that a depression flag in earlier years (2016/2017) was significantly associated with subsequent uncontrolled A1C levels in later years (2018/2019), utilizing large administrative data from a private insurer. These findings highlight that having both a depression flag and uncontrolled A1C levels was associated with significantly higher medical costs, potentially driven by depression and related nonadherence. The results suggest that proactively addressing depression among patients with diabetes may be beneficial for controlling A1C levels and reducing medical costs. Moving forward, several evidence-based strategies are available for better managing depression symptoms and improving glycemic control. 43 However, additional research is needed to determine which treatment approaches are most effective for patients with comorbid depression and diabetes, including specific medications and combined pharmaceutical and psychotherapy approaches. This research may also help update clinical guidelines for healthcare providers managing patients with diabetes who suffer from depression.
Footnotes
Acknowledgements
We thank Drs. Carrie Byington and Nancy Dickey for their leadership and support at the Texas A&M Health Science Center with special appreciation for their vision in creating the Rural Health Moonshot Initiative.
Ethical Considerations
This study was deemed to be “non-human subjects research” by the Texas A&M Institutional Review Board (Organization Number: IORG00000397) as there was no personal contact with the participants.
Consent to Participate
Our IRB determination (IRB # IRB2020-0204) did not require individualized informed consent. As this study was based on the analysis of non-experimental deidentified administrative claims data, it was not possible to obtain informed consent from patients and/or their legal guardians. All research protocols were carried out in accordance with relevant secondary data guidelines and regulations.
Funding
The author(s) disclosed receipt of the following financial support for the research, authorship, and/or publication of this article: This research was supported by a grant from Blue Cross and Blue Shield of Texas (Grant number 23-468611) to establish a Rural Health Moonshot Program at Texas A&M Health Science Center. All claims made in this article are solely those of the authors and do not necessarily represent those of their affiliated organizations. The funders had no role in study design, data collection and analysis, decision to publish, or preparation of the manuscript. There was no additional external funding received for this study.
Declaration of Conflicting Interests
The author(s) declared no potential conflicts of interest with respect to the research, authorship, and/or publication of this article.
Data Availability Statement
The data that support the findings of this study are available from Blue Cross and Blue Shield of Texas (BCBSTX) with availability restrictions, which were used under license for the current study, and so are not publicly available. Data are, however, available from the authors upon reasonable request and with permission of Blue Cross and Blue Shield of Texas. We refer all data access inquiries to the BCBSTX point of contact for this collaborative effort (Mark Chassey, Chief Medical Officer,