
Abstract
Introduction:
Little is known about trends in the incidence of dependent adult abuse (DAA).
Objectives:
To determine the annual incidence of DAA in Iowa from 1984 to 2023. Trends in abuse rates were evaluated for their associations with calendar year, number of caseworkers and abuse laws, political party, and unemployment.
Methods:
Iowa Department of Health and Human Services DAA reports, investigations, and substantiations were analyzed. Report data were available for 10 years. Investigation and substantiation data were available for 40 years. Long-term trends over time were described and associations between abuse rates and number of caseworkers and abuse laws, political party, and unemployment were explored.
Results:
Both investigations and substantiations increased from 50 to 182 per 100 000 adults and 17 to 38 per 100 000 adults between 1984 and 2023, respectively. Increasing calendar year and Democratic party majority in the Iowa legislature were positively and independently associated with investigated and substantiated abuse rates. An inverse correlation between the proportion of reports that were investigated and the proportion of investigations that were substantiated (Spearman’s rho = −.81; P < .01) was found.
Conclusions:
During the 40-year study period, investigated and substantiated cases of DAA in Iowa have been steadily increasing.
Keywords
Introduction
Detecting and reporting elder and dependent adult abuse is challenging but important for healthcare providers. Challenging because it takes time to diplomatically address the possibility of abuse, and it can be difficult to know when to suspect it. Important because it results in preventable suffering and will be encountered several times a year in most emergency rooms and primary care clinics.1,2 The annual incidence of substantiated elder abuse was 2.7 per 1000 adults over age 60 years in 1 national study. 3 The incidence of abuse among dependent adults, however, is unknown and will likely remain unknown because the determination of dependency is not made until after the abuse is reported. 4
Most studies have found increasing trends in the annual incidence of elder abuse over limited time periods,5 -8 although 1 found a decrease in long-term care settings, 9 and none included trends over multiple decades or trends in dependent adult abuse rather than elder abuse. 4 All states have mandatory reporting laws for persons providing care for the elderly. 10 In some states, healthcare providers are mandated to report dependent/vulnerable adult abuse for those persons 18 years and older.10,11 Iowa is one of those states that requires dependent adult and elder abuse to be reported.
Epidemiologic studies of elder abuse have focused on risk factors and preventive strategies, but little knowledge is available about trends in incidence over time. The purpose of this study was to determine the annual incidence of reports, investigations and substantiations of dependent adult abuse in Iowa between 1984 and 2023. Further, any trends in abuse rates were evaluated for their associations with calendar year, number of caseworkers, number of abuse laws, political party, and unemployment.
Methods
This was an ecological study with time-trend analysis that used publicly available resources. Six resources regarding Iowa were accessed that included: (1) Adult Protective Services semi-annual dependent adult abuse reports (For 2022 & 2023 reports 12 ; For 2001 to 2020 13 ; For reports prior to 2001 14 ; (2) U.S. Census Bureau population from1984 to 2023 15 ; (3) Division of Field Operations at the Iowa Department of Health and Human Services (DHHS) for caseworker data (personal communication Cassie McAllister, Social Worker 6, Division of Field Operations, DHHS, email 11/16/2023); (4) Iowa DHHS summary of law changes 16 ; (5) Iowa General Assembly political party affiliation for senators and representatives 17 ; and (6) US Bureau of Labor Statistics for unemployment rate. 18
Dependent adult abuse data included reports, investigations, and substantiations of abuse. A “report” of abuse was defined as an allegation of abuse that was communicated to the Iowa DHHS. An “investigation” was defined as the acceptance of a report by a DHHS caseworker for further inquiry. A “substantiation” was defined as the finding that abuse occurred. The proportion of reports investigated, and proportion of investigations substantiated were also calculated. The data included semi-annual totals for reports of abuse among community-dwelling dependent adults aged 18 years or older from 2014 to 2023 and for investigations and substantiations from 1984 to 2023. We combined semi-annual totals into annual totals for each year.
The adult population of Iowa for each year from 1984 to 2023 was obtained from the U.S. Census Bureau. For the last 17 years of the study period (2007-2023), the numbers of caseworkers assigned to child and adult abuse were obtained from the Division of Field Operations at the Iowa DHHS. In 2020 and subsequent years, approximately 30 caseworkers were assigned to investigate only adult abuse reports, while the remainder (approximately 220) investigated both child and adult reports.
Iowa laws related to dependent adult abuse were summarized in a recent annual report from the Iowa DHHS. We determined the majority political party in the Iowa Legislature for each year by combining the 50 senators and 100 representatives and then taking the majority of the 150 legislators. Iowa unemployment rates by year were obtained from the US Bureau of Labor Statistics.
Statistical Analysis
Descriptive statistics were used to summarize the 3 outcome variables: reports, investigations, and substantiations of dependent adult abuse. We calculated crude incidence rates per 100 000 Iowa adults (age ≥18 years) by dividing the annual counts for each outcome by the adult Iowa population for the corresponding year and then multiplying the result by 100 000. Simple and multiple linear regression models were used to explore associations between the 3 outcome variables and 5 predictor variables: calendar year, number of caseworkers, legislation, political party, and unemployment rate. We modeled the proportion of reports that were investigated and the proportion of investigations that were substantiated as functions of the same 5 predictor variables. Finally, we used interrupted time series analysis to describe 3 different time periods with distinct slope coefficients.
In addition, we analyzed the associations between calendar year and the outcome variables using Spearman correlation coefficients because the linear regression assumptions were not met for some of the analyses. We analyzed trends in the age distribution of adults to explore the possibility that upward trends in abuse might be explained by upward trends in the proportion of adults over age 65 years. Analyses were conducted using Stata version 18 (StataCorp LLC).
The University of Iowa Institutional Review Board, determined that the study, IRB ID# 202207273, was not human subjects research.
Results
The 3 outcome variables (reports, investigations, and substantiations of dependent adult abuse) varied widely but generally increased during the study period (Tables 1-3, Figure 1). Report rates increased from 273 to 524 per 100 000 Iowa adults during the 10 years that report data were available (2014-2023). The mean (SD) report rate was 371 (87) per 100 000. Investigation rates also increased from 50 to 182 per 100 000 Iowa adults during the 40-year study period (1984-2023). The mean (SD) investigation rate was 87 (45) per 100 000. Finally, substantiation rates increased from 17 to 38 per 100 000 Iowa adults during the same 40-year period. The mean (SD) substantiation rate was 18 (7) per 100 000. The proportion of investigations that were substantiated (18/87) was 21%. To emphasize the complement, the proportion of investigations that were not substantiated (69/87) was 79% (1 – 0.2069).
Simple Linear Regression Models of Reported, Investigated, and Substantiated Abuse Rates. a

Each row in the table summarizes a separate simple linear regression.
Rate = (number of abuse cases/calendar-year specific Iowa adult population) × 100 000.
2014 through 2023. Reports of abuse were not recorded until 2014. Political party could not be analyzed as a predictor because the Republican party controlled the legislature from 2014 through 2023.
Caseworker rate = (number of caseworkers/(calendar-year specific Iowa adult population × 100 000.
1984 through 2023.
Iowa legislature majority party (Democratic vs Republican) after combining representatives (n = 100) and senators (n = 50). A negative slope coefficient corresponds to higher rates (or percents) during Republican majorities in the legislature because Republican majority was coded as 0 and Democratic majority as 1. A positive slope corresponds to higher rates (or percents) during Democratic majorities.
Spearman Correlation Coefficients for the Association between Calendar Year and Reported, Investigated, and Substantiated Abuse Rates.

Rate = (number of abuse cases/calendar-year specific Iowa adult population) × 100 000.
2014 through 2023. Reports of possible abuse were not recorded until 2014.
1984 through 2023.
Multiple Linear Regression Models of Investigated and Substantiated Abuse Rates. a

The effect of each predictor variable is controlled for the effect of the other predictor in each of the 3 regression models.
Rate = (number of abuse cases/calendar-year specific Iowa adult population) × 100 000.
1984 through 2023.
Iowa legislature majority party (Democratic vs Republican) after combining representatives (n = 100) and senators (n = 50). A positive slope coefficient corresponds to higher rates (or percents) during Democratic majorities in the legislature because Republican majority was coded as 0 and Democratic majority as 1.
Caseworker rate = (number of caseworkers/(calendar-year specific Iowa adult population × 100 000.

Dependent adult abuse investigations.
We found significant associations between the 3 outcome variables and the 3 predictors: calendar year, number of caseworkers, and majority political party (Table 1). The number of caseworkers was relatively constant during the years that caseworker data were available (2007-2023) with a mean (SD) of 9 (0.8) caseworkers per 100 000 adults, and, after controlling for the effects of calendar year and political party, there were no significant associations between caseworker rates and substantiation rates or between caseworker rates and percent of investigations substantiated (Table 3). After controlling for calendar year and majority political party, caseworker rates were positively correlated with investigation rates (Table 3). Between 2014, when the recording of abuse reports was initiated, and 2023, the number of reports per caseworker increased from 32 to 50. Between 2007 and 2023, the number of investigations per caseworker increased from 8 to 17.
The Iowa legislature passed 29 laws designed to strengthen dependent adult abuse interventions over the 40-year study period (Figure 1). 16 There were no associations between the yearly number of adult abuse laws passed and reports, investigations, and substantiations of dependent adult abuse.
Calendar year and Democratic party majority in the Iowa legislature were positively and independently associated with investigated and substantiated abuse rates (Table 3). There was an inverse relationship between the percent of reports that were investigated and the percent of investigations that were substantiated (Spearman’s rho = .81, P < .01, Figure 2). The acceleration in the investigation rates during the last 10 years of the study appeared to coincide with the 2014 implementation of a DHHS policy to record reports of abuse in addition to investigations and substantiations, which were both initiated in 1984 (Figure 1). In Figure 1, the 40-year increasing trend appeared to fall into 3 periods with different slopes. These 3 periods were further analyzed using interrupted time series, which documented significantly different slope coefficients (Figure 3).

Percent of abuse reports investigated and percent of investigations substantiated.
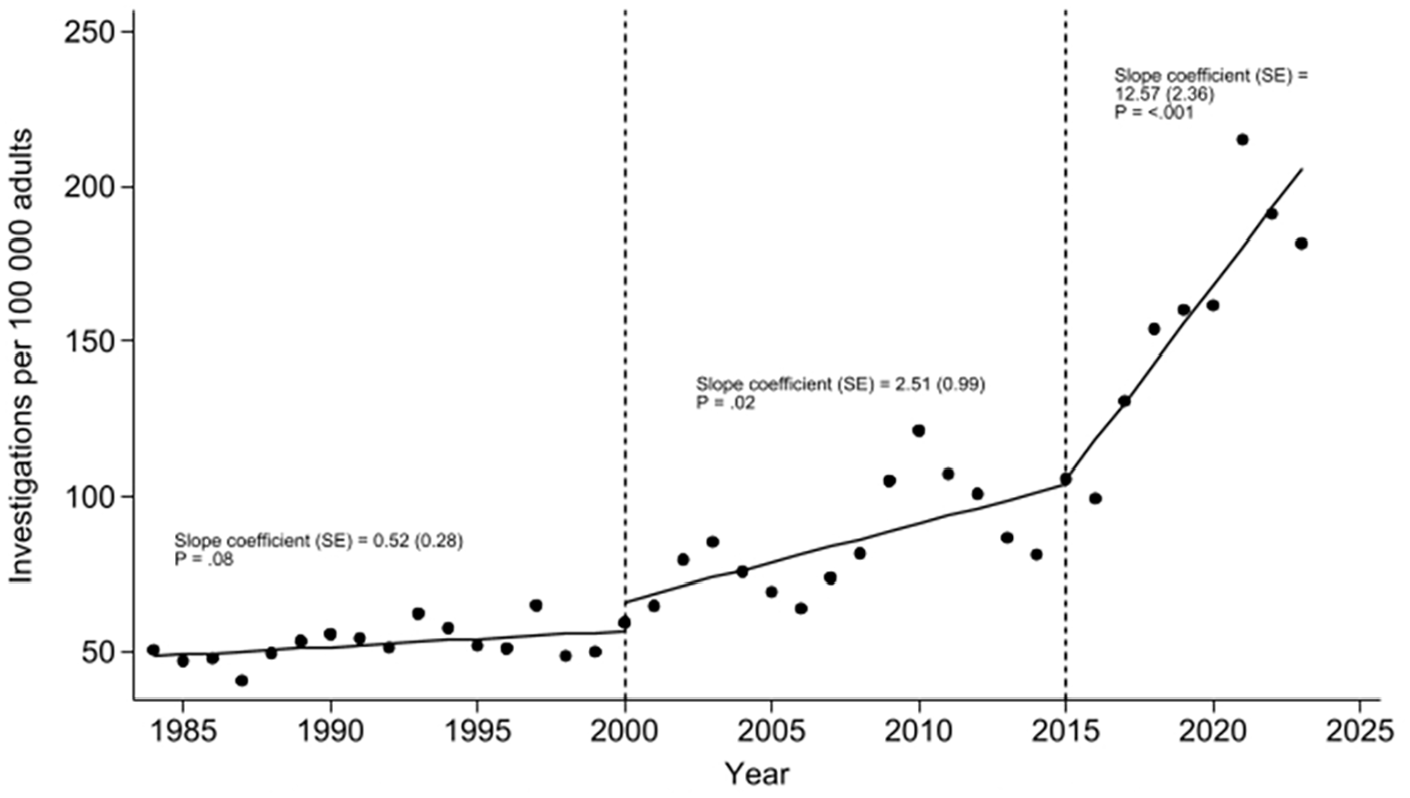
Dependent adult abuse investigations in 3 time periods.
Republicans outnumbered Democrats in the Iowa legislature during 24 (60%) of the 40-year study period, with Republican majorities concentrated in the later years. Republican majorities were associated with higher investigation rates than Democratic majorities in the simple linear regression (Table 1), but after controlling for calendar year and caseworker rate, the opposite relationship was found in the multivariable analysis (Table 3); that is, investigation rates were higher under Democratic majorities. Substantiation rates were not associated with majority political party in the simple linear regression (Table 1), but after controlling for calendar year and caseworker rate, substantiation rates increased during years with Democratic majorities (Table 3). The associations between political party and abuse rates were weaker than the associations between abuse rates and calendar year.
There were no significant associations between unemployment rates and any of the 3 abuse rates (reports, investigations, or substantiations).
Our data violated several assumptions of linear regression including autocorrelation in rates from 1 year to the next. The irregular cyclic patterns apparent in Figures 1 and 2 did not allow analysis using polynomial regression or data transformations. Therefore, nonparametric Spearman correlations were used to confirm the presence of increasing abuse rates over time (Table 2).
In the absence of age-specific data on abuse rates, we speculated that increasing rates over time might be explained by an increased proportion of older adults, who may be more likely to be dependent and more likely to be abused than younger adults. In Iowa, between 1984 and 2023, the proportion of adults aged 65 years and older increased from 19.5% of the adult population ((407 397/2 090 413) × 100) to 24.1% ((595 837/2 476 882) × 100). This change represents an absolute increase of 4.6% and a relative increase of 23.6%. During the same period, investigations increased from 50 to 182 per 100 000 adults, which was an absolute increase of 132 investigations per 100 000 adults and a relative increase of 264%. Substantiations increased from 17 to 38 per 100 000 adults, which was an absolute increase of 21 substantiations per 100 000 adults and a relative increase of 124%. Therefore, although the proportion of elder adults increased during the 40-year study period, the relative increase was not as great as the relative increase in abuse investigations and substantiations.
Discussion
For the first time, a state’s trends in annual dependent adult abuse recording are known. Findings indicated generally increasing report, investigation, and substantiation rates of dependent adult abuse during the 40-year study period. The proportion of reports that were investigated also increased during the limited time those data were available. The proportions increased for the first 7 years, but for the last 3 years they have been decreasing (Figure 2). The marked increase in the number of investigations per caseworker may have contributed to the decrease in substantiation rates over time. Healthcare providers need to realize abuse is increasing independent of the increasing aging population and they are in an ideal position to report abuse having an ongoing relationship with their patients.
Our findings are consistent with previous studies that have documented increasing trends in dependent adult and elder abuse over time.5 -8 In contrast, a study of nursing home patients found a decrease from 2006 to 2013. 9 The acceleration in the investigation rates after adoption of the Iowa DHHS policy to record reports is consistent with a previous study involving multiple states where similar recordings were conducted. 3 We were unable to explain the slope change in 2000, illustrated in Figure 3.
Overall study findings could be compared with National Adult Maltreatment Reporting System data for the year 2021. For that year, Iowa had a 48.9% acceptance rate of reports for investigations compared with national acceptance rate of 59.1%. 19 For substantiated investigations Iowa had a 13.6% rate versus a national rate of 34.2%. There is no reason to think that there is less adult abuse in Iowa than in other states. However, it is difficult to compare abuse reporting data across states as the population covered, state’s legislative abuse definitions, and available resources are different.
This report describes dependent adult abuse rates rather than elder abuse rates because Iowa did not distinguish elder abuse from dependent adult abuse until 2022. In addition, we were limited to reporting crude abuse rates based on the total population of Iowa adults rather than just dependent adults because dependency was determined by the caseworker only after the abuse was reported.
Iowa physicians believe that Iowa does not have enough resources to meet the needs of mistreated older adults which may impact their reporting of abuse. 1 Healthcare providers rely on adult protective services to manage and address suspected cases of abuse while the Iowa DHHS relies on mandatory and permissive reporters. Many factors contribute to the hesitancy of reporting abuse. Reporters may be concerned about violating the privacy and confidentiality of the dependent adult and/or damaging their doctor/patient relationship.20 -22 Another concern of reporters is the lack of feedback or insufficient communication from adult protective services regarding feedback on their respective report and how it has impacted the wellbeing of the dependent adult. 23
Study Limitations
The associations between abuse rates and political party should be interpreted cautiously because the confidence intervals for the regression slope coefficients were wide and the associations lack an easily interpreted mechanism that would explain them. A PubMed search on August 21, 2024 using Boolean logic with MeSH terms “‘Politics’ and ‘Elder abuse’” returned 9 citations, but none of them explored associations between political party and abuse rates. Both parties may be motivated to strengthen abuse laws with Republicans favoring law and order platforms while Democrats favor social programs.
Although we found strong associations between abuse rates and the passage of time, we were not able to explain the underlying causes that may have been correlated with time. For example, unemployment rates were not closely correlated with abuse rates in this study. Further research with other risk factors, such as drug abuse and family structure may yield different results.
The true trend in abuse rates as measured by a hypothetical standardized measure (ie, a “gold standard”) that did not depend solely on reports and subsequent judgments about whether to investigate and substantiate them may have differed from our findings. An increased tendency to report abuse caused by external factors, such as increased public awareness, or laws passed during the study period, could have led to an apparent upward trend that was actually stable or even downward when measured by more objective methods.
A strength of this study was the long time-period (40 years) over which abuse trends and risk factors were analyzed. The longest period in a search of previous studies investigating abuse trends over time was 15 years. 6
The incidence of dependent adult abuse rates in Iowa increased during the 40 years between 1984 and 2023. The overall upward trend was characterized by relatively short irregular cycles of increasing and decreasing rates and by longer successive rate increases when the 40-year period was divided into approximate thirds. The associations between abuse trends and political party in control of the Iowa legislature should be viewed with caution because of the inconsistent nature of these associations and their borderline significance in the face of the multiple comparisons we explored in the analysis.
Implications
The small proportions of reports that were investigated and investigations that were substantiated, in this study, could prompt efforts to educate the public on which concerns are likely to be investigated and efforts to educate mandatory reporters and caseworkers on which investigations are likely to be substantiated. Researchers might discover common elements that characterize reports not investigated and investigations not substantiated. In future efforts to accurately identify abuse, researchers could follow the 79% of dependent adults who were investigated but not substantiated over a period of years to determine the subsequent incidence of abuse.
Conclusion
There was an increase in annual rates of dependent adult abuse case reports, investigations and substantiations over the last 40 years. Increased rates for investigations were related to calendar year, political party and caseworker rates. Substantiation rates were associated with calendar year and political party. Dependent adult abuse rates were not related to the number of abuse laws or unemployment rates. The overall upward trend in abuse rates was characterized by relatively short irregular cycles of increasing and decreasing rates and by longer successively increasing rates when the 40-year period was divided into approximate thirds. The associations between abuse trends and political party in control of the Iowa legislature should be viewed with caution because of the inconsistent nature of these associations and their borderline significance in the face of the multiple comparisons we explored in the analysis.
Footnotes
Declaration of Conflicting Interests
The author(s) declared no potential conflicts of interest with respect to the research, authorship, and/or publication of this article.
Funding
The author(s) received no financial support for the research, authorship, and/or publication of this article.